The fashion industry never slows down. Trends change overnight. Customer preferences shift every season. Margins fluctuate with inventory cycles. And without structured tracking, brands lose visibility fast.
If you are still managing performance in scattered spreadsheets, you are reacting late instead of leading smartly.
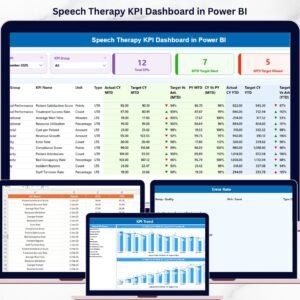
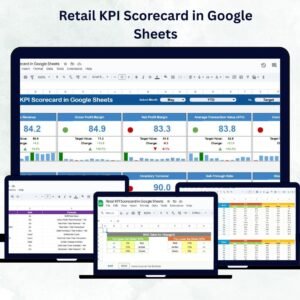
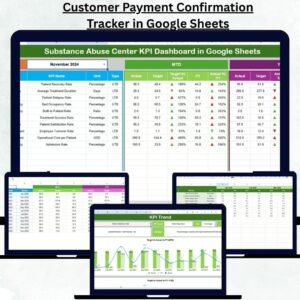
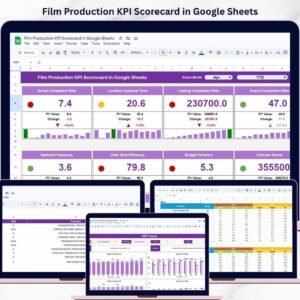
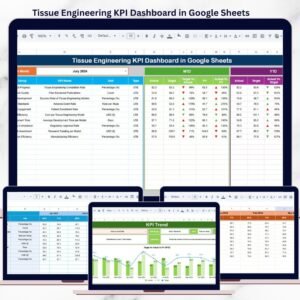
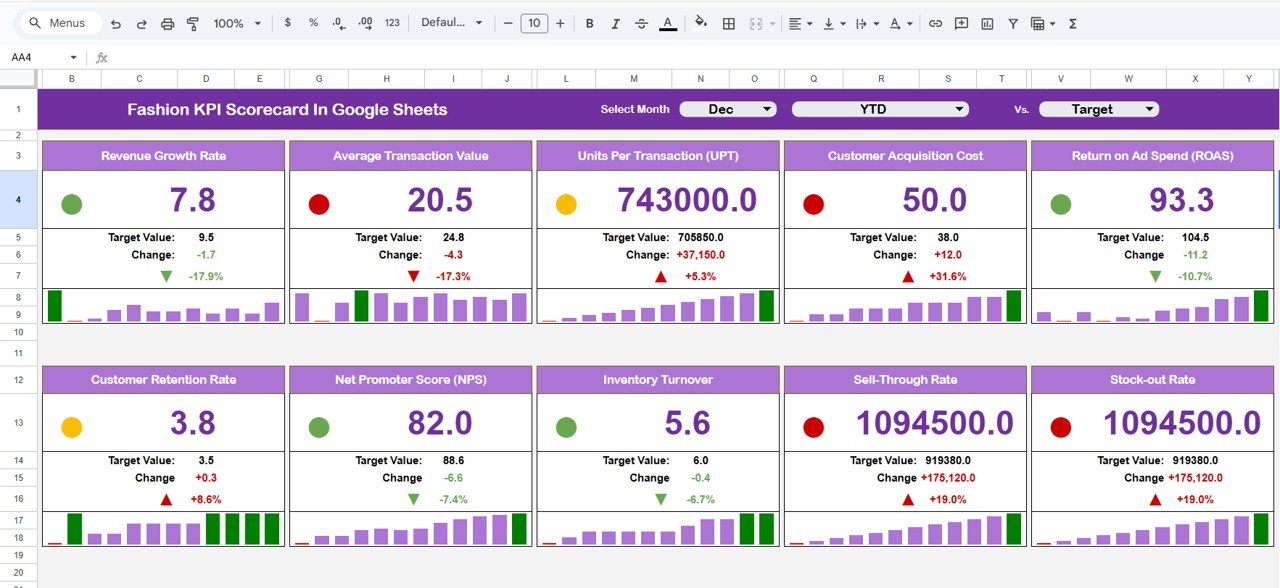
Introducing the Fashion KPI Scorecard in Google Sheets — a ready-to-use, dynamic performance tracking template designed specifically for fashion brands, apparel manufacturers, and retail businesses.
This powerful scorecard tracks 10 carefully selected KPIs covering financial performance, inventory efficiency, and customer trends — all in one interactive Google Sheets system.
No complex setup. No coding required. Just structured clarity.
🚀 Key Feature of Fashion KPI Scorecard in Google Sheets
📊 Dynamic Main Dashboard Page – Instantly view MTD & YTD performance.
🎯 MTD & YTD Toggle Buttons – Switch between monthly and yearly insights.
🟢🔴 Traffic Light Indicators – Instantly identify target achieved or missed.
📈 Up/Down Arrow Indicators – Track growth vs previous year clearly.
📆 Month Selection Dropdown – Analyze any month with one click.
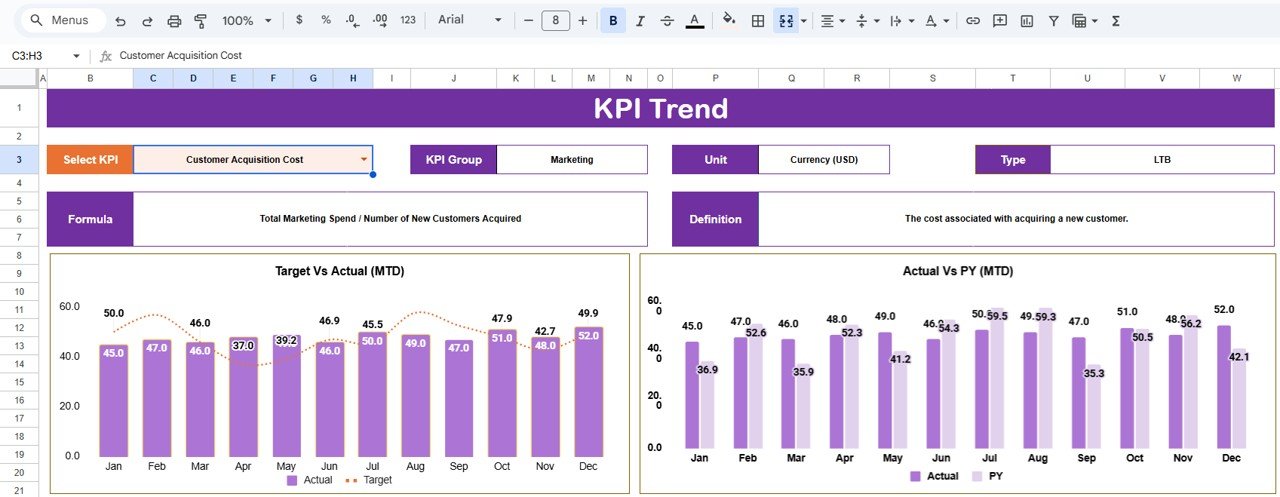
📊 KPI Trend Analysis Page – Visual monthly performance charts.
📑 Centralized KPI Definition Sheet – Clear KPI formula and logic documentation.
🎨 Color Settings Control Sheet – Manage traffic light and arrow logic professionally.
📦 What’s Inside the Fashion KPI Scorecard in Google Sheets
This ready-to-use Google Sheets file includes the following structured worksheets:
1️⃣ Dashboard Sheet Tab (Main Scorecard Page)
This is the primary performance view.
You can:
-
Select month from dropdown.
-
Switch between MTD and YTD.
-
View:
-
MTD Actual
-
MTD Target
-
Previous Year MTD
-
Target vs Actual %
-
Previous Year vs Actual %
-
YTD Actual
-
YTD Target
-
Previous Year YTD
-
Traffic lights and arrows update automatically for instant clarity.
2️⃣ Trend Sheet Tab
Select a KPI from Cell C3 and analyze:
-
KPI Group
-
KPI Unit
-
KPI Type (Lower the Better / Upper the Better)
-
KPI Formula
-
KPI Definition
-
Monthly Trend Chart
This sheet helps managers understand performance direction across the year.
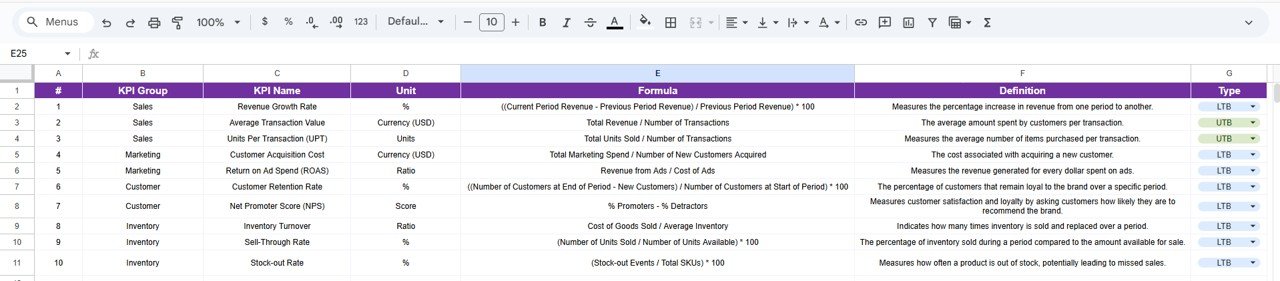
3️⃣ KPI Definition Sheet Tab
Includes:
-
KPI Name
-
KPI Group
-
Unit
-
Formula
-
KPI Definition
-
KPI Type (LTB / UTB)
This sheet ensures KPI consistency and avoids misinterpretation.
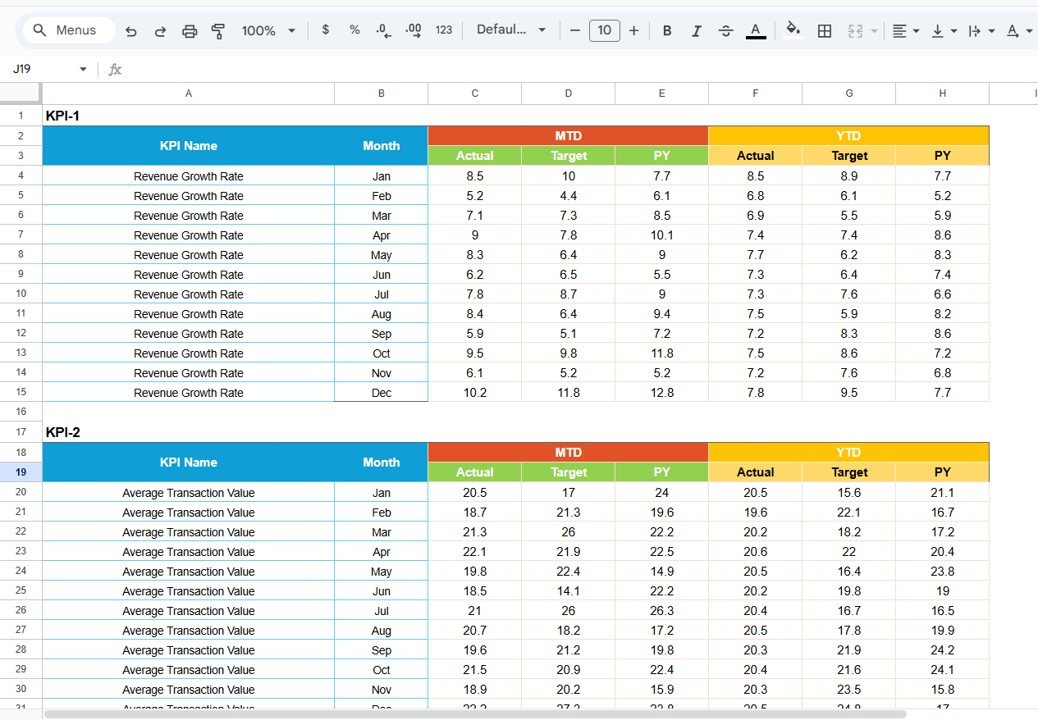
4️⃣ Data Input Sheet Tab
Enter:
-
Monthly Actual Data
-
Monthly Target Data
-
Previous Year Data
Once entered:
-
Dashboard updates automatically
-
Trend charts refresh
-
Visual indicators adjust
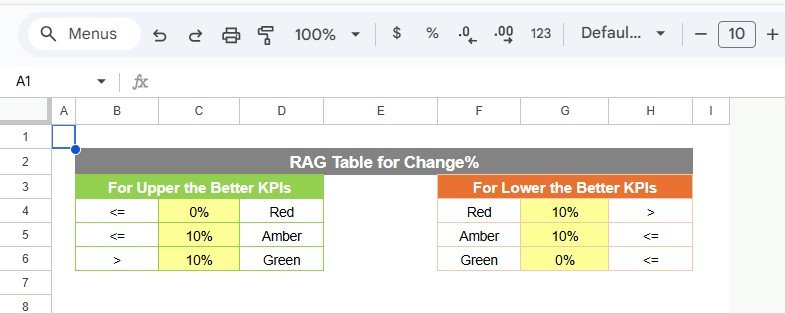
5️⃣ Colour Settings Sheet Tab
Controls:
🟢 Green → Target Achieved
🟡 Yellow → Slight Deviation
🔴 Red → Target Missed
⬆ Up Arrow → Positive Growth
⬇ Down Arrow → Negative Growth
This ensures a professional and executive-friendly layout.
🛠 How to Use the Fashion KPI Scorecard in Google Sheets
1️⃣ Enter monthly actual and target data in the Data Input sheet.
2️⃣ Update previous year values for comparison.
3️⃣ Select the desired month on the Dashboard.
4️⃣ Toggle between MTD and YTD views.
5️⃣ Review traffic lights and trend charts.
6️⃣ Use the Trend Sheet for detailed KPI-level analysis.
Because the template is pre-built, you only focus on entering numbers.
👠 Who Can Benefit from This Fashion KPI Scorecard in Google Sheets
✔ Fashion Retail Brands
✔ Apparel Manufacturers
✔ Boutique Owners
✔ E-commerce Fashion Stores
✔ Fashion Startup Founders
✔ Chain Store Managers
✔ Fashion Business Analysts
Whether you run a single boutique or a multi-location fashion brand, this scorecard supports structured decision-making.
Why This Scorecard Is a Must-Have for Fashion Businesses
Instead of guessing which month performed better, you compare data instantly.
Instead of manually calculating margins, you track financial KPIs automatically.
Instead of reacting to slow inventory turnover, you detect trends early.
From revenue and profit margin to sell-through rate and stock-out rate — every critical metric becomes measurable and actionable.
If you want clearer financial visibility, smarter inventory control, and better growth tracking, this scorecard gives you the competitive advantage.
Click here to read the Detailed blog post
Watch the step-by-step video tutorial:
Visit our YouTube channel to learn step-by-step video tutorials
👉 YouTube Channel – NeotechNavigators