Managing facilities without clear visibility is like driving blind. Every day, facilities teams deal with maintenance costs, energy usage, safety compliance, service quality, and asset performance. However, when data is scattered across spreadsheets and reports, decision-making becomes slow and reactive.
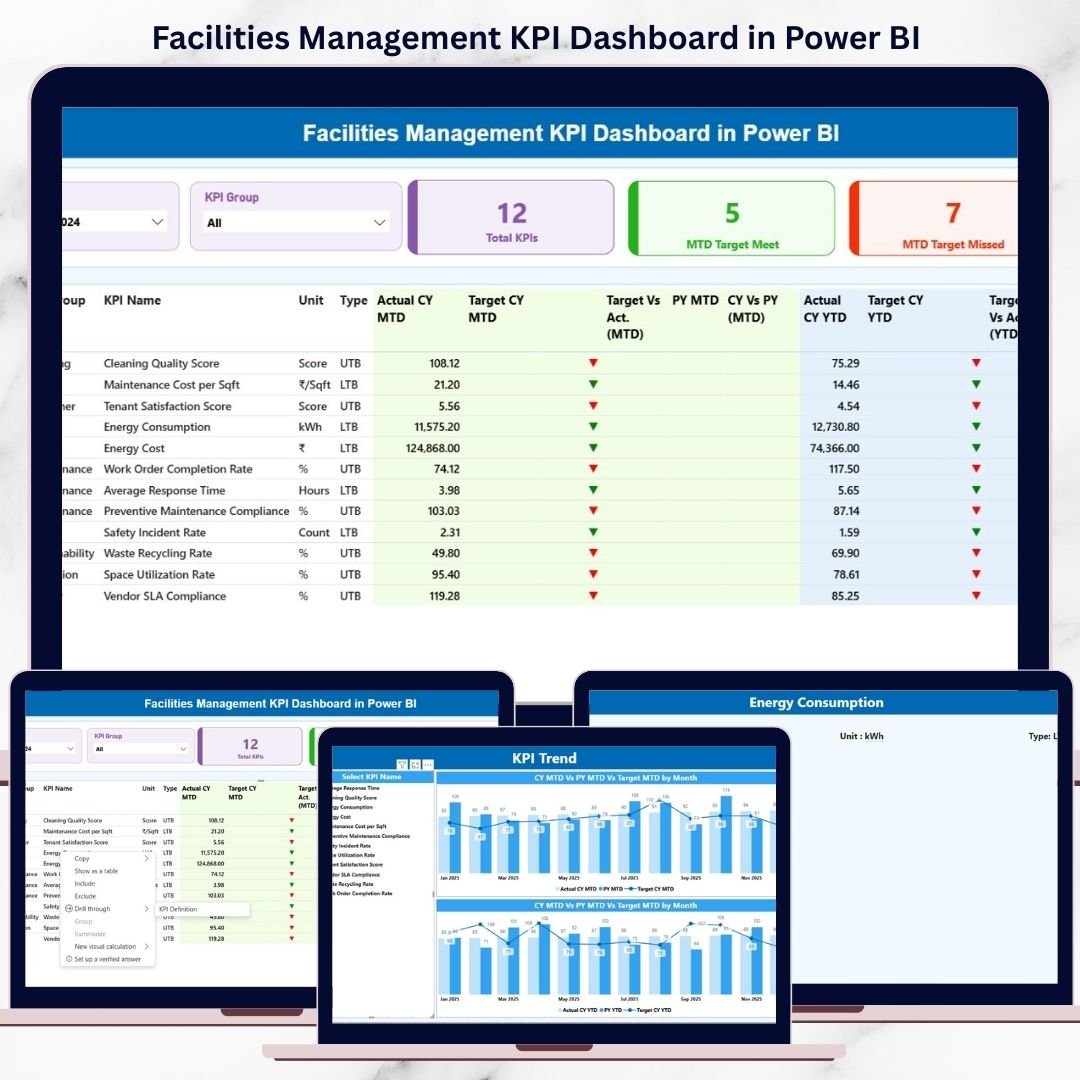
That is exactly why the Facilities Management KPI Dashboard in Power BI is a must-have analytics solution for modern organizations. This ready-to-use dashboard converts raw facilities data into clear, visual, and actionable insights—helping you monitor performance, control costs, and improve operational efficiency with confidence 🚀.
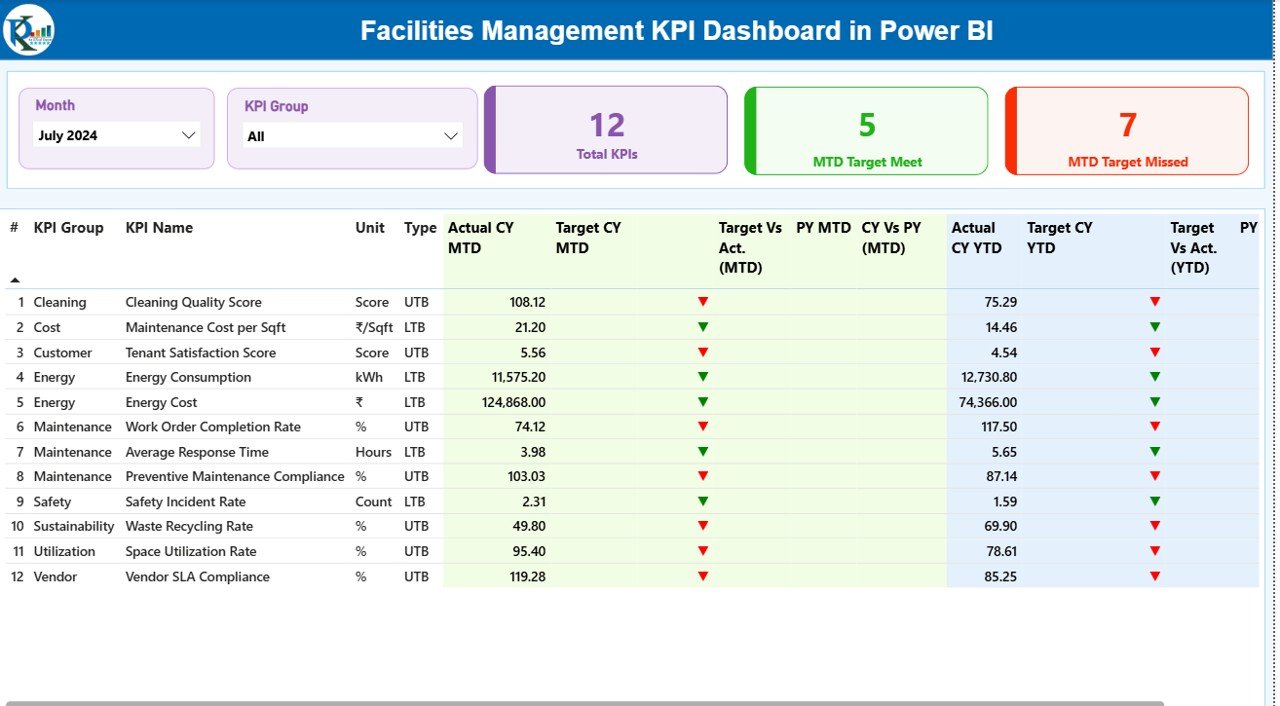
Built using Excel as the data source and Power BI for visualization, this dashboard is designed for real-world facilities operations, not theory. You simply update your data, refresh the report, and instantly see how your facilities are performing—month-to-date and year-to-date.
Key Features of the Facilities Management KPI Dashboard in Power BI ⚙️📊
This dashboard is designed to deliver clarity, speed, and control.
🔹 Interactive Month & KPI Group slicers to analyze performance instantly
🔹 MTD and YTD tracking with Actual, Target, and Previous Year comparisons
🔹 Automatic performance indicators using green/red up-down icons
🔹 LTB & UTB logic to correctly evaluate KPI performance
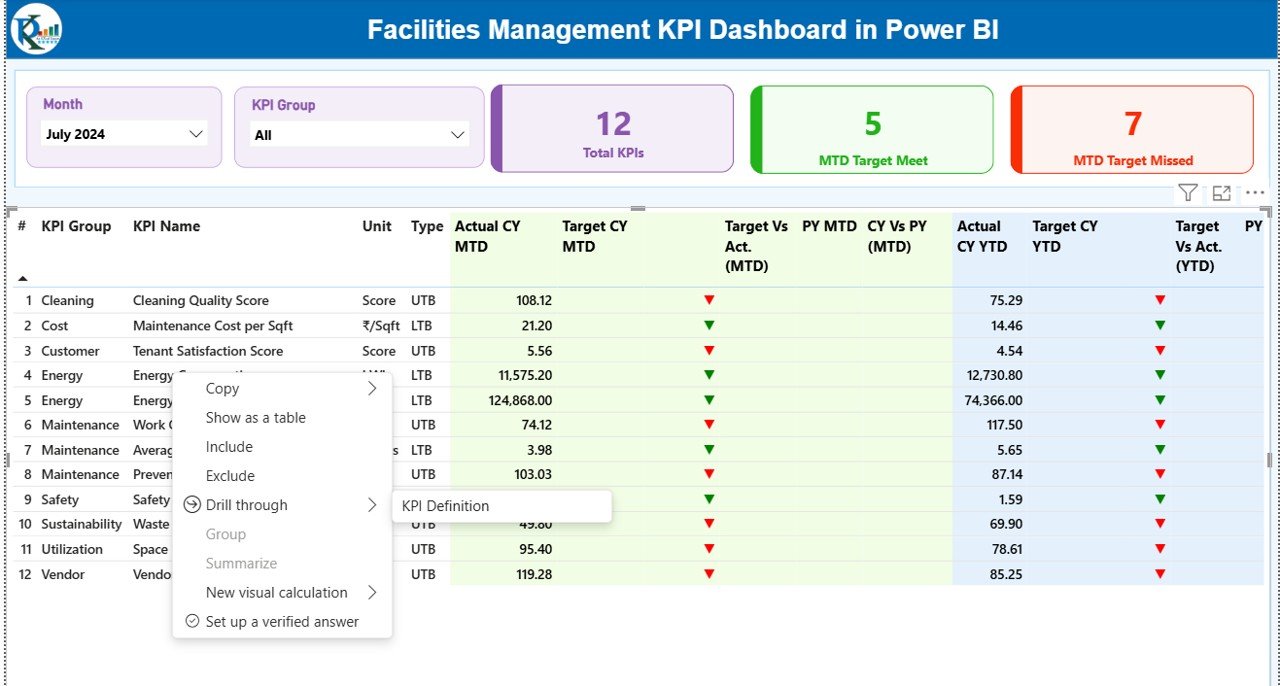
🔹 High-level KPI cards showing Total KPIs, Target Met, and Target Missed
🔹 Detailed KPI performance table for operational and strategic review
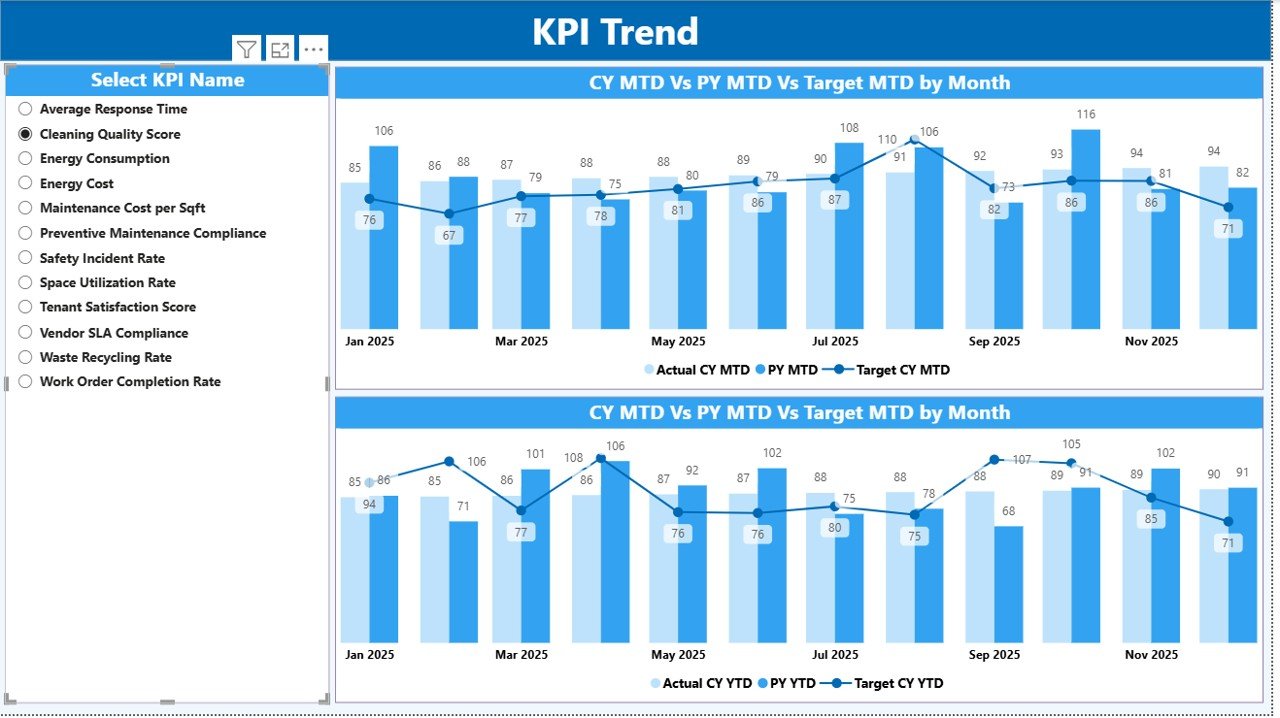
🔹 Dedicated KPI Trend analysis page for monthly performance tracking
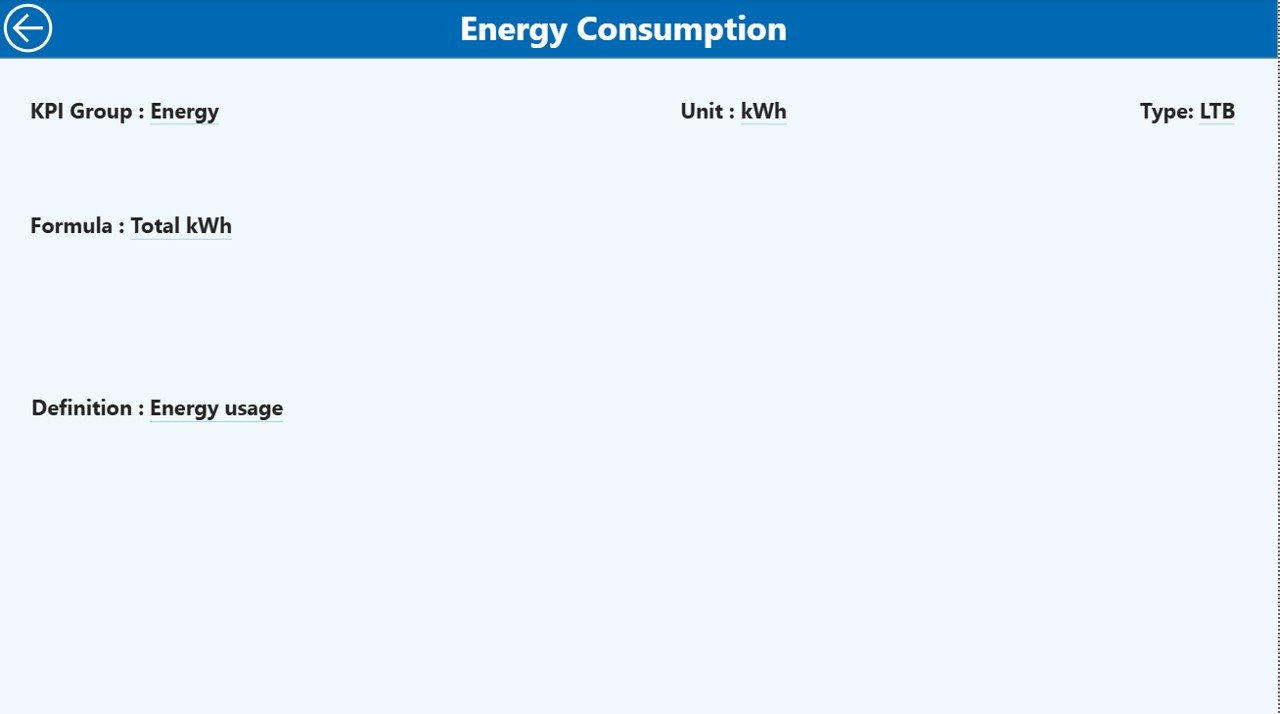
🔹 Drill-through KPI Definition page for complete clarity and transparency
As a result, teams move from manual reporting to data-driven facilities management.
What’s Inside the Facilities Management KPI Dashboard in Power BI 📂✨
This digital product includes a fully structured Power BI Desktop file with three powerful analytical pages:
📌 Summary Page
The command center of the dashboard. It provides KPI cards, interactive slicers, and a detailed performance table covering MTD and YTD results with comparisons.
📌 KPI Trend Page
Analyze how individual KPIs perform over time using combo charts for Actual vs Target vs Previous Year—both MTD and YTD.
📌 KPI Definition Page
A drill-through page that explains every KPI clearly, including formula, definition, unit, and KPI type. This ensures transparency and consistency across teams.
📌 Excel Data Source (3 Sheets)
✔ Input_Actual – Actual MTD & YTD values
✔ Input_Target – Target MTD & YTD values
✔ KPI Definition – KPI structure, logic, and classification
Everything is ready—no complex modeling required.
How to Use the Facilities Management KPI Dashboard in Power BI 🧠⚡
Using this dashboard is simple, even for beginners.
1️⃣ Enter actual KPI values in the Input_Actual Excel sheet
2️⃣ Enter target values in the Input_Target Excel sheet
3️⃣ Define KPIs clearly in the KPI Definition sheet
4️⃣ Open the Power BI file and refresh the data
5️⃣ Use slicers, tables, and charts to analyze performance
Within minutes, you will have a professional, decision-ready facilities dashboard.
Who Can Benefit from This Facilities Management KPI Dashboard 🏢👥
This dashboard is ideal for:
✔ Facility Managers
✔ Operations & Maintenance Teams
✔ Energy & Utilities Managers
✔ Corporate Real Estate Teams
✔ Hospitals, Campuses, Malls, and Factories
✔ Organizations managing multiple facilities or assets
If your organization manages physical spaces, this dashboard gives you a competitive operational advantage.
Click here to read the Detailed blog post
Watch the step-by-step video tutorial:
(Add your blog post link here)
👉 Visit our YouTube channel to learn step-by-step video tutorials:
YouTube.com/@PKAnExcelExpert


Reviews
There are no reviews yet.