Event production is fast, dynamic, and detail heavy. Every event—whether it’s a conference, concert, exhibition, or corporate show—demands tight coordination, accurate timelines, and flawless execution. Event Production KPI Dashboard in Power BI But when everything is managed through scattered spreadsheets, errors and delays become unavoidable. That’s why professionals now rely on the Event Production KPI Dashboard in Power BI — a complete, real-time performance monitoring system designed specifically for event teams.
Event Production KPI Dashboard in Power BI This ready-to-use Power BI dashboard transforms your operational data into clean visuals, trend charts, KPI indicators, and actionable insights. It helps event managers, coordinators, producers, and leadership teams understand their Month-to-Date (MTD) and Year-to-Date (YTD) performance instantly. Event Production KPI Dashboard in Power BI Whether you’re tracking vendor performance, budget progress, production timings, safety compliance, or overall team efficiency — this dashboard gives you complete clarity in seconds.
Let’s explore everything inside this powerful dashboard 👇
✨ Key Features of the Event Production KPI Dashboard in Power BI
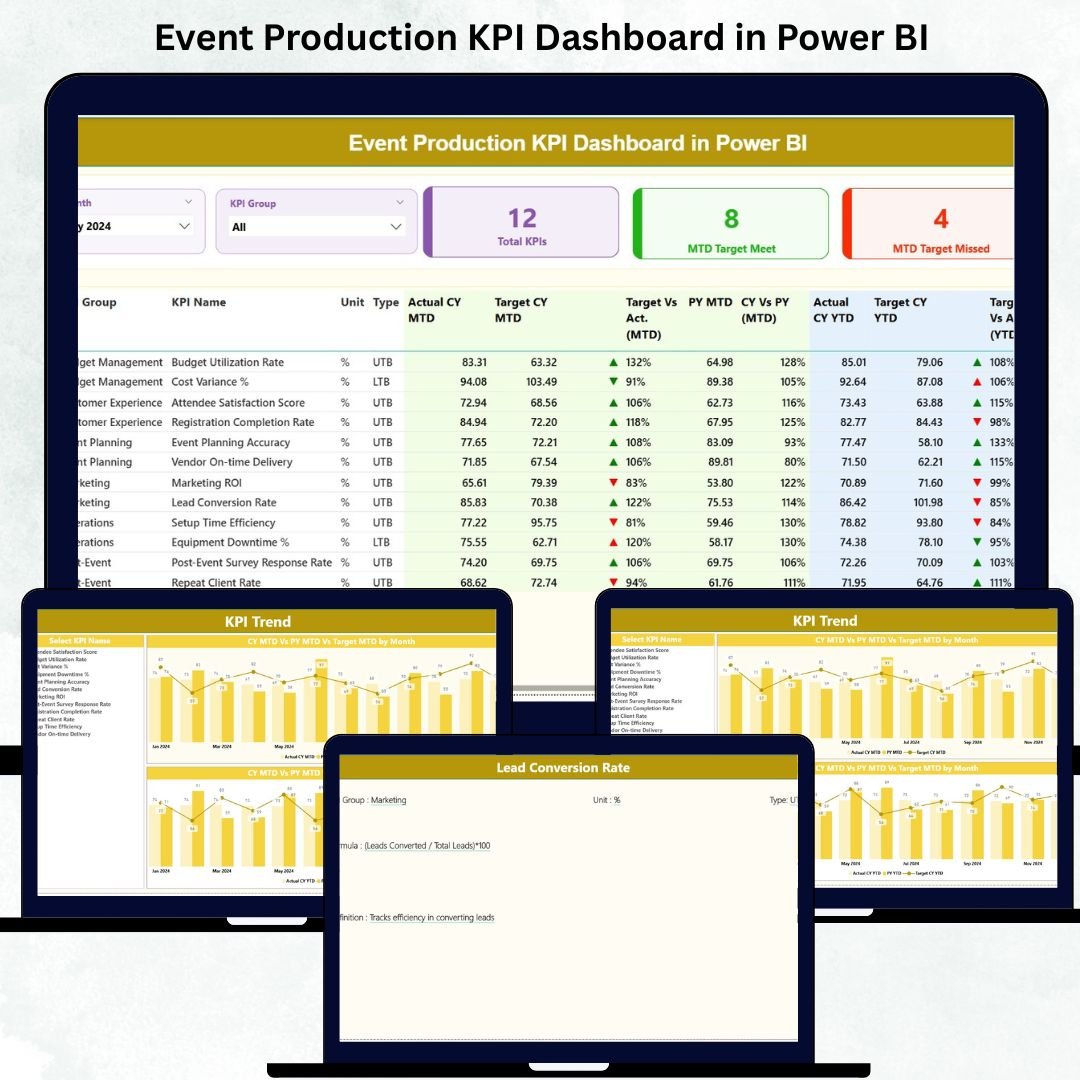
🎯 1. Three Professionally Designed Pages
Includes Summary Page, KPI Trend Page, and KPI Definition Page — each built to simplify event operations.
📊 2. Instant MTD & YTD Performance Insights
Track Actual vs Target performance and compare with Previous Year values for all KPIs.
🔄 3. Automated Refresh with Excel Source File
Simply update the Excel sheets — Power BI updates every visual automatically.
📘 4. Drill-Through KPI Details
Right-click any KPI to open a dedicated page showing formula, definition, KPI type, and units.
🚦 5. Smart Visual Indicators
Green ▲ shows improvement, red ▼ shows underperformance — making the dashboard effortless to read.
📦 What’s Inside the Event Production KPI Dashboard in Power BI
🏆 1. Summary Page — The Control Center of Your Event
Operations
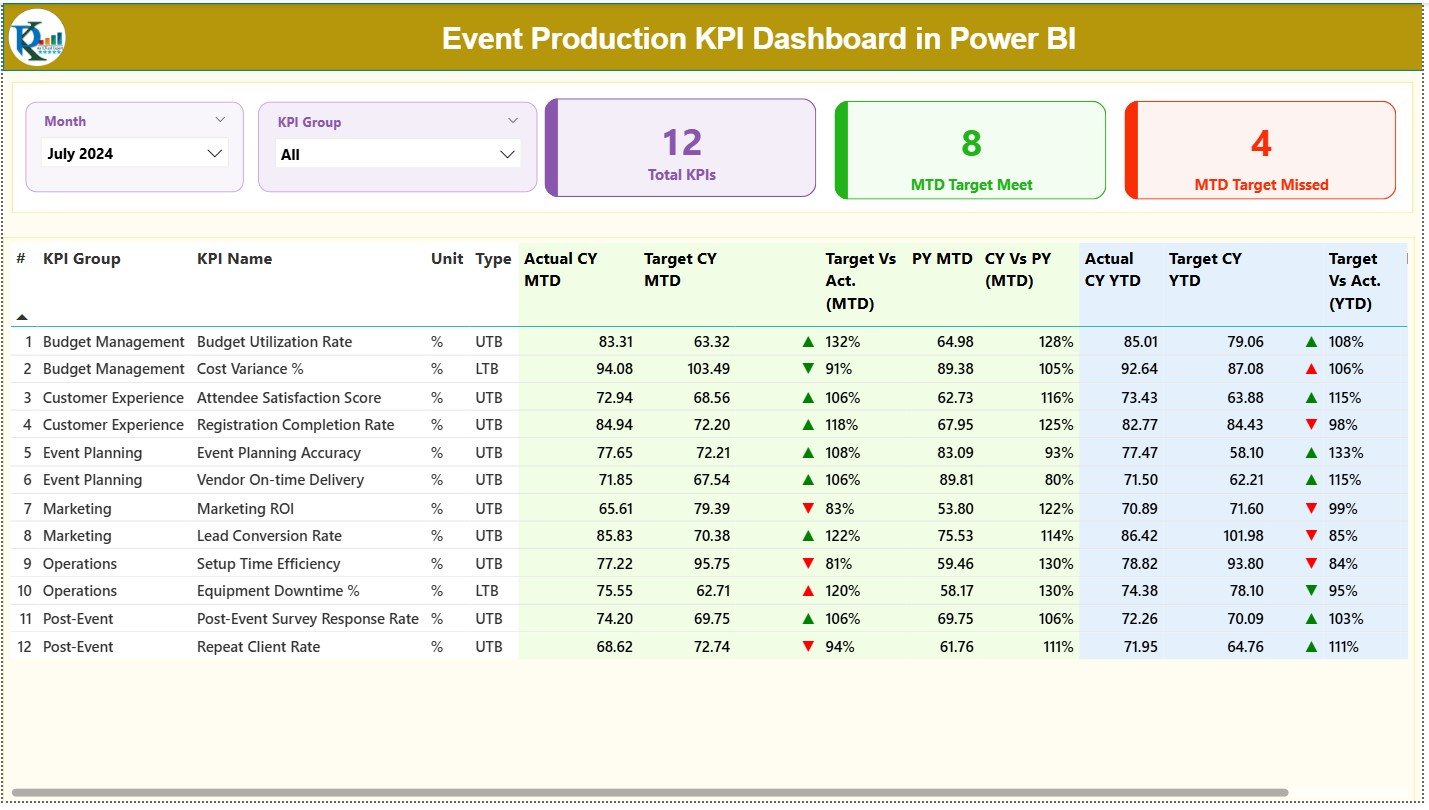
This page provides a complete overview of everything your team does.
⭐ Top Slicers
-
Month Selector
-
KPI Group Selector
These help you quickly filter the exact metrics you want to analyze.
⭐ KPI Cards
-
Total KPIs Count
-
MTD Target Met Count
-
MTD Target Missed Count
You instantly see whether your event production team is performing on target.
⭐ Detailed KPI Table
This section gives a full breakdown of MTD & YTD KPIs, including:
-
KPI Number
-
KPI Group
-
KPI Name
-
Unit
-
Type (LTB/UTB)
-
CY MTD Actual
-
CY MTD Target
-
MTD Performance Icon
-
MTD Target vs Actual %
-
Previous Year MTD
-
CY vs PY (MTD) %
-
CY YTD Actual
-
CY YTD Target
-
YTD Performance Icon
-
YTD Target vs Actual %
-
Previous Year YTD
-
CY vs PY (YTD) %
With all values updating instantly, event teams get real-time clarity on timelines, operations, and resource performance.
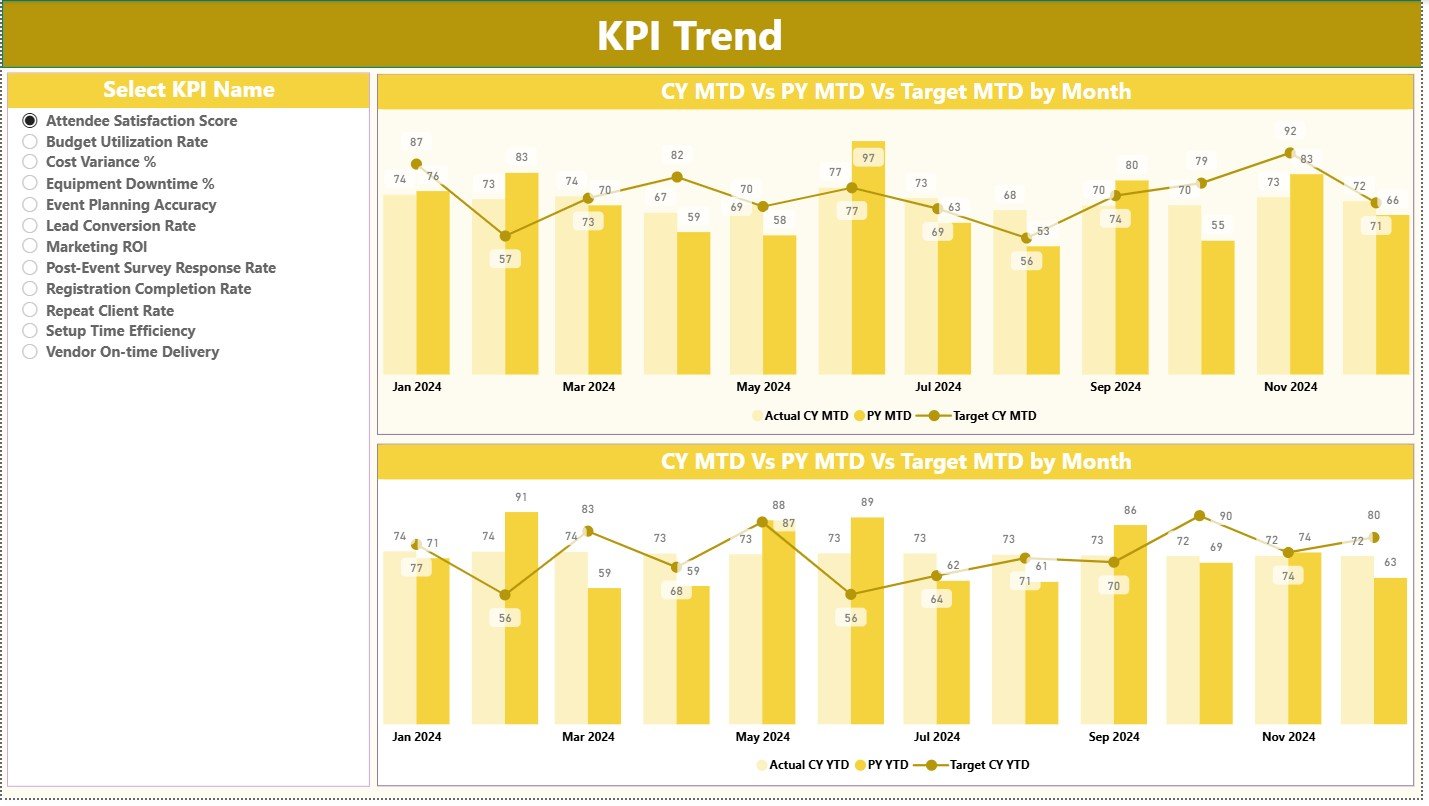
📈 2. KPI Trend Page — Month-by-Month Insights That Improve Planning
This page shows two dynamic combo charts:
-
MTD Trend: Actual vs Target vs Previous Year
-
YTD Trend: Cumulative performance across the year
A KPI slicer lets you choose any metric, such as:
-
Budget variance
-
Vendor delivery accuracy
-
Stage setup duration
-
Safety compliance
-
Production turnaround time
By tracking KPI movement across months, event managers can easily identify performance patterns, delays, and improvement opportunities.
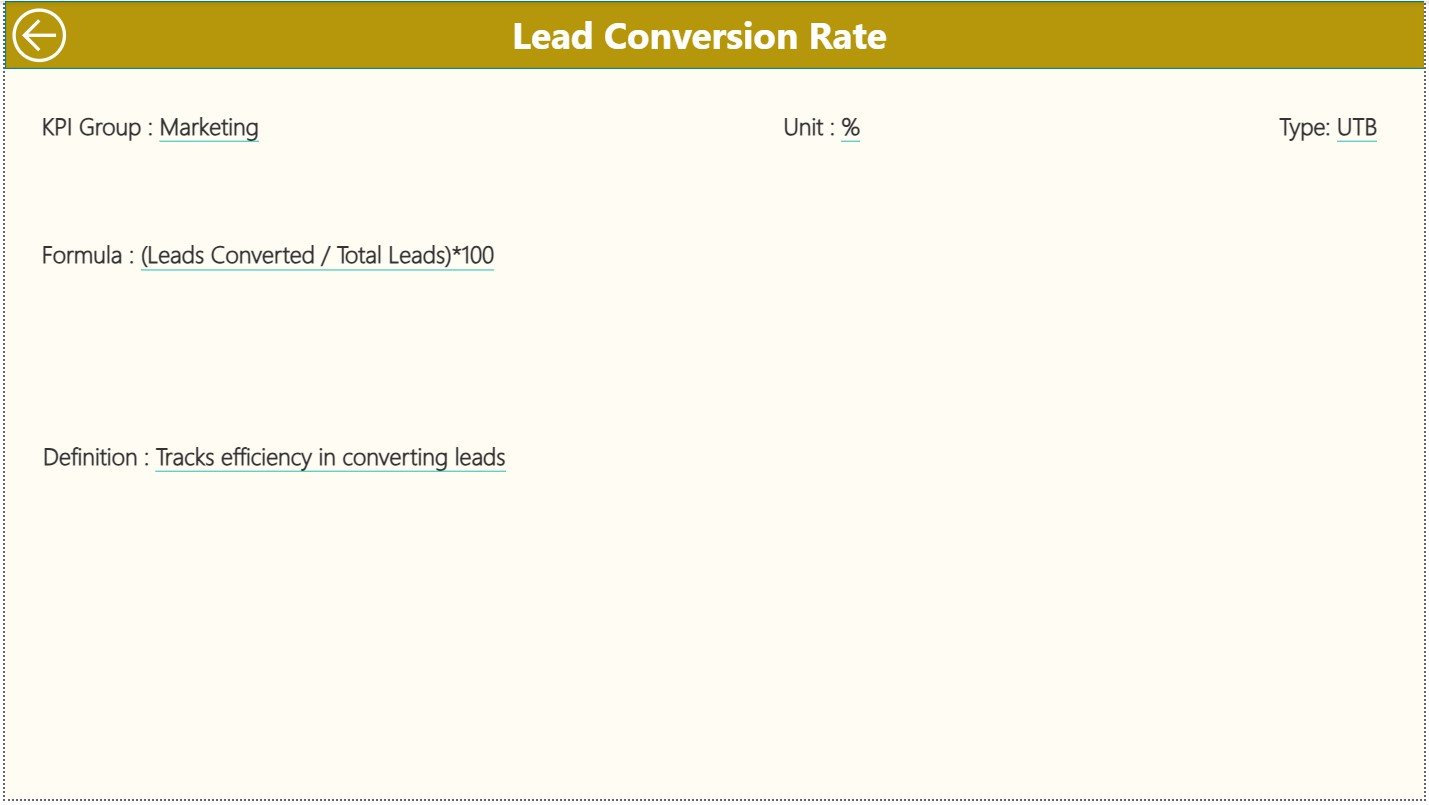
📘 3. KPI Definition Page — Your Complete KPI Reference Library
This drill-through page displays important KPI details:
-
KPI Number
-
KPI Group
-
KPI Name
-
Unit
-
Formula
-
Definition
-
Type (UTB or LTB)
This ensures every team member understands how metrics are calculated, making collaboration smoother.
📁 How the Excel Data Source Works
The dashboard uses three simple sheets — easy for any team to maintain.
🟦 1. Input Actual Sheet
Enter:
-
KPI Name
-
Month
-
MTD Actual
-
YTD Actual
🟨 2. Input Target Sheet
Enter:
-
MTD Target
-
YTD Target
🟩 3. KPI Definition Sheet
Enter:
-
KPI details
-
Formulas
-
Types
This structure ensures zero confusion and smooth automatic updates.
👥 Who Can Benefit from This Dashboard?
🎤 Event Planners & Coordinators
Track deadlines, vendor performance, and production activities.
🏢 Event Management Companies
Monitor operational efficiency across teams and events.
💼 Marketing & Corporate Teams
Evaluate event quality and execution consistency.
📊 Project Managers
Review timelines, performance gaps, and budgets.


Reviews
There are no reviews yet.