
In today’s transparency-driven world, fashion brands can’t afford to overlook ethics and sustainability. From ensuring fair wages to reducing waste, ethical performance metrics are no longer optional—they’re expected. That’s why we’ve created the Ethical Fashion KPI Dashboard in Power BI, a ready-to-use, visually stunning dashboard that turns your Excel data into actionable ethical insights.
Whether you’re a sustainable startup or a global apparel leader, this dashboard helps you monitor compliance, report performance, and stay accountable—with zero technical hassle.
🔑 Key Features of Ethical Fashion KPI Dashboard
🟢 3 Insightful Pages for Complete Visibility
Track your ethical progress across Summary, Trend, and Definition pages—all seamlessly integrated.
📅 MTD & YTD Tracking
Visualize Month-to-Date and Year-to-Date performance for every KPI using intuitive graphs, icons, and ratios.
📌 Target vs. Actual View
See which KPIs are on track or lagging behind—instantly highlighted with arrows and color-coded cues.
📈 PY Comparison (Previous Year)
Compare current performance to the previous year with built-in improvement metrics.
💡 Slicer Filters
Easily filter by Month, KPI Group, or individual KPIs to drill into what really matters.
🔁 Interactive Drill-Through
Click into any KPI to view definitions and metadata with just one drill action.
🧩 What’s Inside the Dashboard?
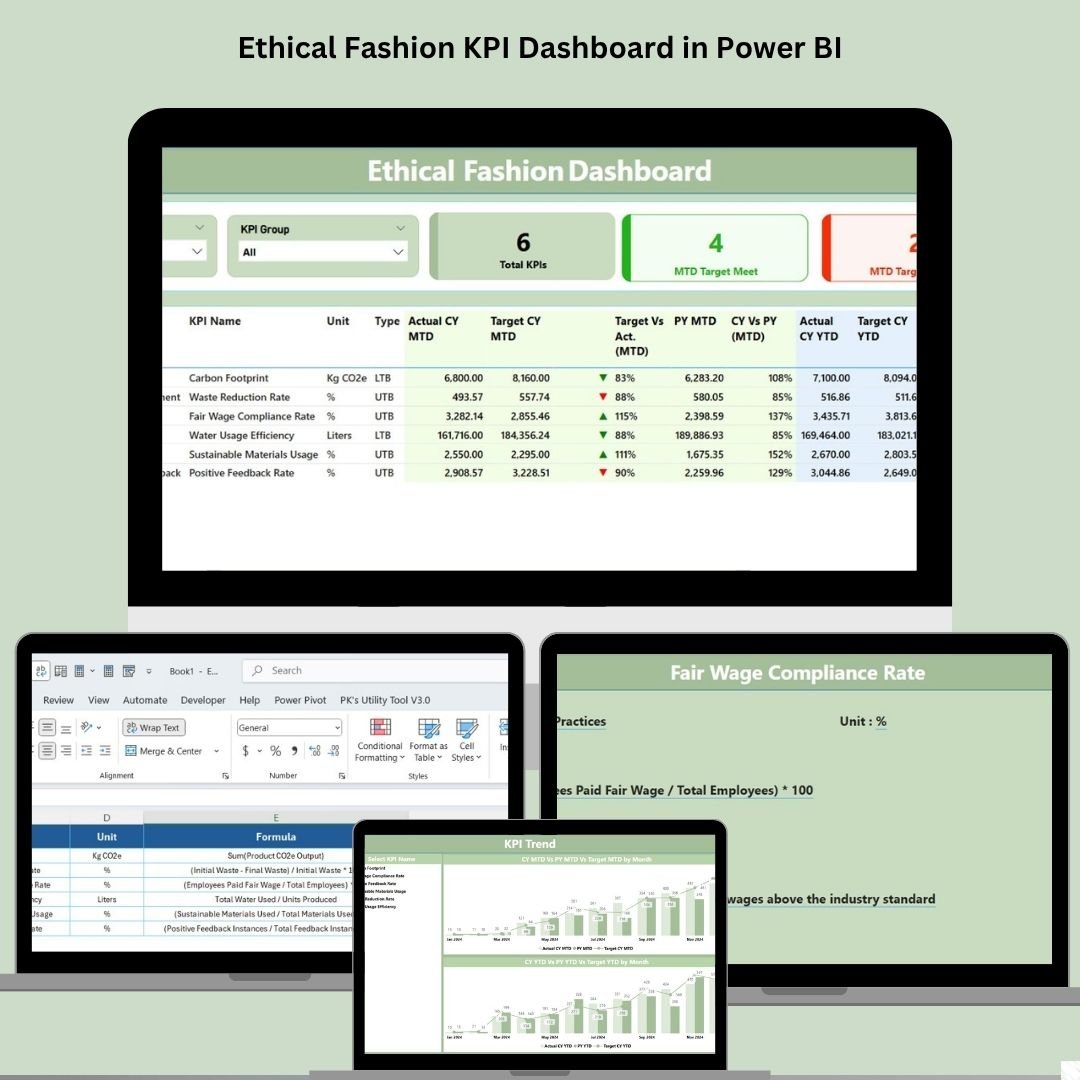
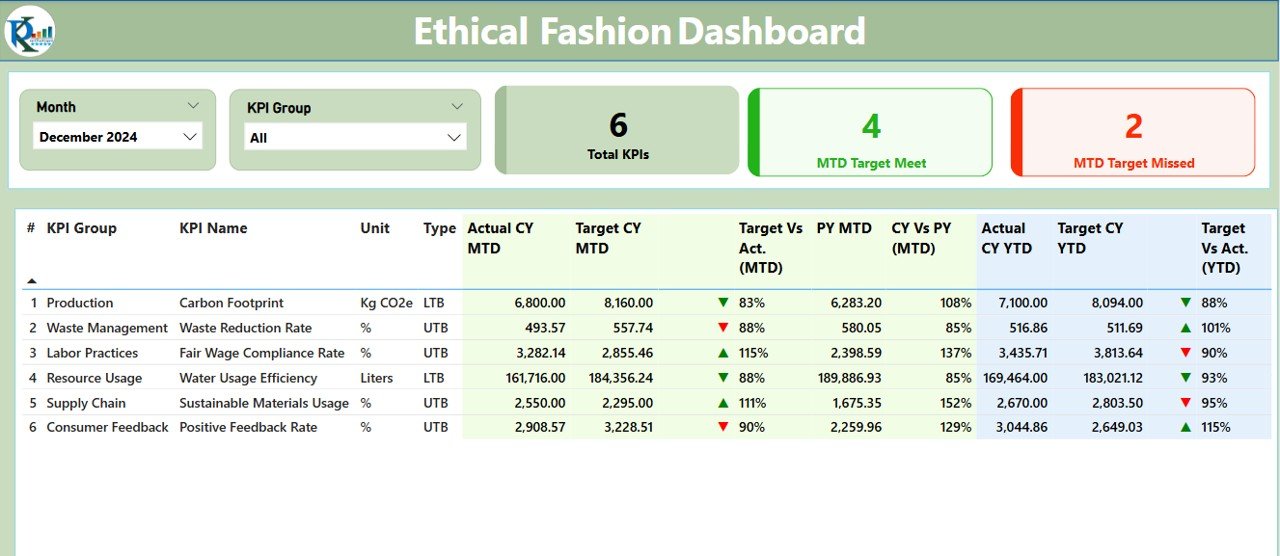
1️⃣ Summary Page
View total KPI count, MTD performance, targets missed/met, and detailed tables with instant visuals.
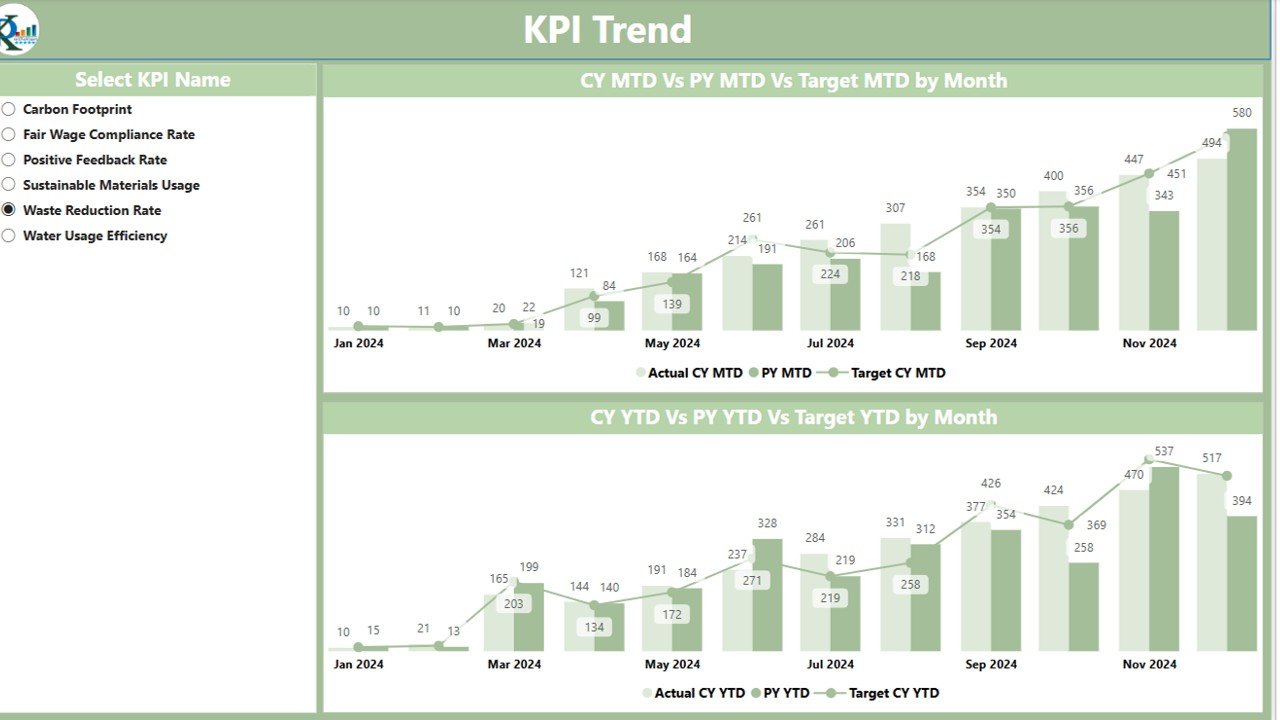
2️⃣ KPI Trend Page
Spot trends using combo charts showing actual vs. target values (both current and past year).
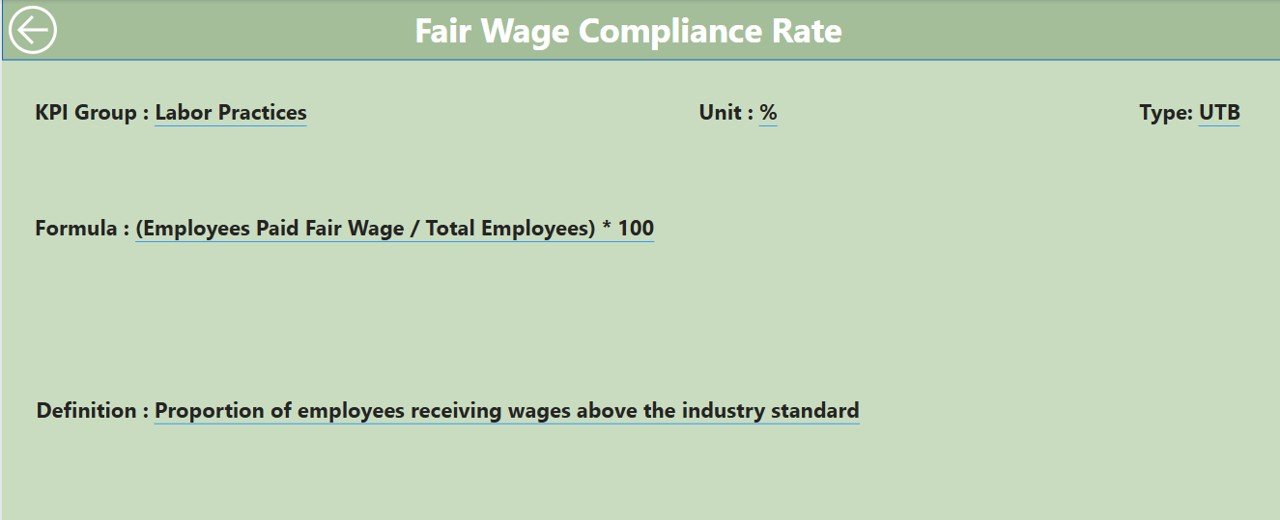
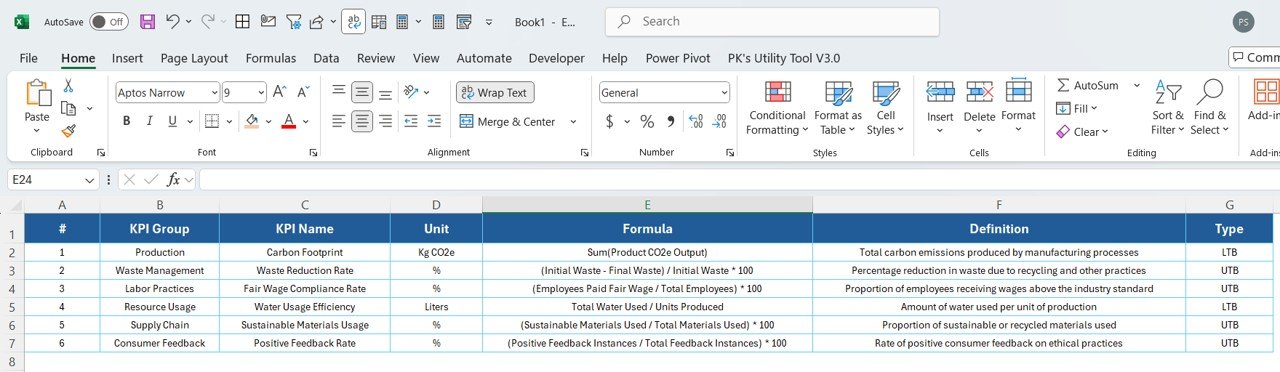
3️⃣ KPI Definition Page
Everything you need to understand each metric—unit, formula, type (LTB/UTB), and its meaning.
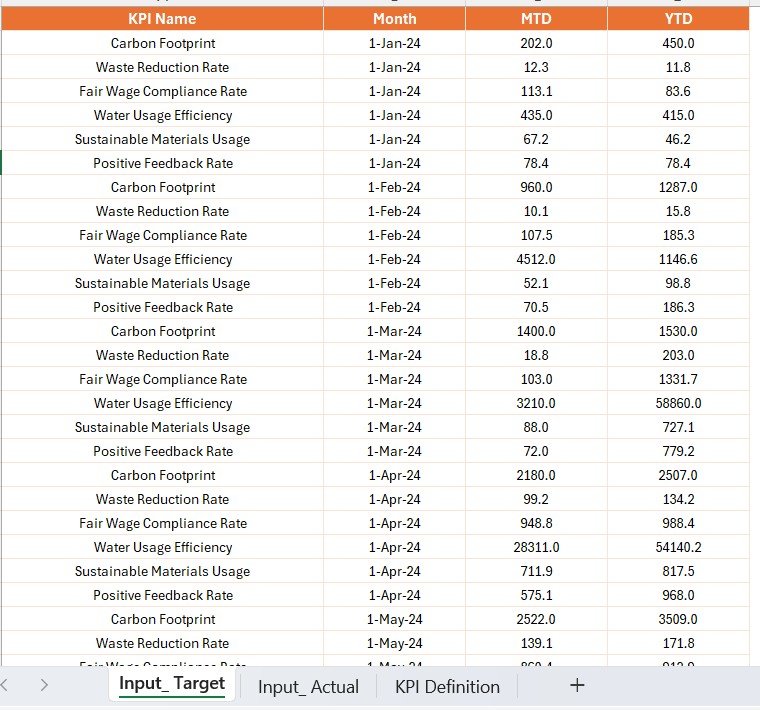
🎯 Excel Backend with 3 Simple Input Sheets
-
Input_Actual – Enter MTD and YTD data by month
-
Input_Target – Fill in your target values
-
KPI Definition – Define your custom metrics, formulas, and KPI groups
You control everything from a simple Excel file—no Power BI knowledge required!
🧑💼 Who Can Benefit from This Dashboard?
🌍 Ethical Fashion Brands – Monitor transparency goals, fair wages, and sustainable sourcing.
🏭 Apparel Manufacturers – Track ethical compliance across supply chains.
🛒 Retailers – Align internal KPIs with sustainability and brand image.
💼 CSR Teams – Report on ESG, GOTS, and Fair Trade progress.
📊 Sustainability Consultants – Help clients visualize and improve their ethical metrics.
🚀 How to Use the Ethical Fashion KPI Dashboard
-
Open the Excel File – Update the Actual, Target, and Definition sheets.
-
Open Power BI File – Connect or refresh to the Excel file.
-
Filter by Month or KPI Group – Use slicers to focus your view.
-
Analyze Visuals – View status cards, icons, and performance tables.
-
Drill Through – Click any KPI to understand its definition and calculation.
That’s it—no coding, no mess, just clarity!
🌟 Top Benefits at a Glance
✅ Real-Time Ethical Performance – Track current data, spot issues instantly
📈 Visual Progress Tracking – Graphs, arrows, and ratios make KPIs come alive
📅 MTD/YTD & PY Comparisons – Stay consistent with monthly and yearly reviews
📥 Excel-Powered Simplicity – Familiar interface, no complex databases
🧩 Custom KPIs Supported – Tailor everything to your goals and standards
🧠 Team-Friendly Design – Anyone can read and use the dashboard


Reviews
There are no reviews yet.