In today’s asset-intensive business environment, organizations must closely monitor equipment lease costs, vendor performance, and departmental usage. However, many companies still depend on scattered spreadsheets and manual reports. As a result, leaders struggle to track escalation trends, maintenance expenses, and lease exposure in one centralized view.
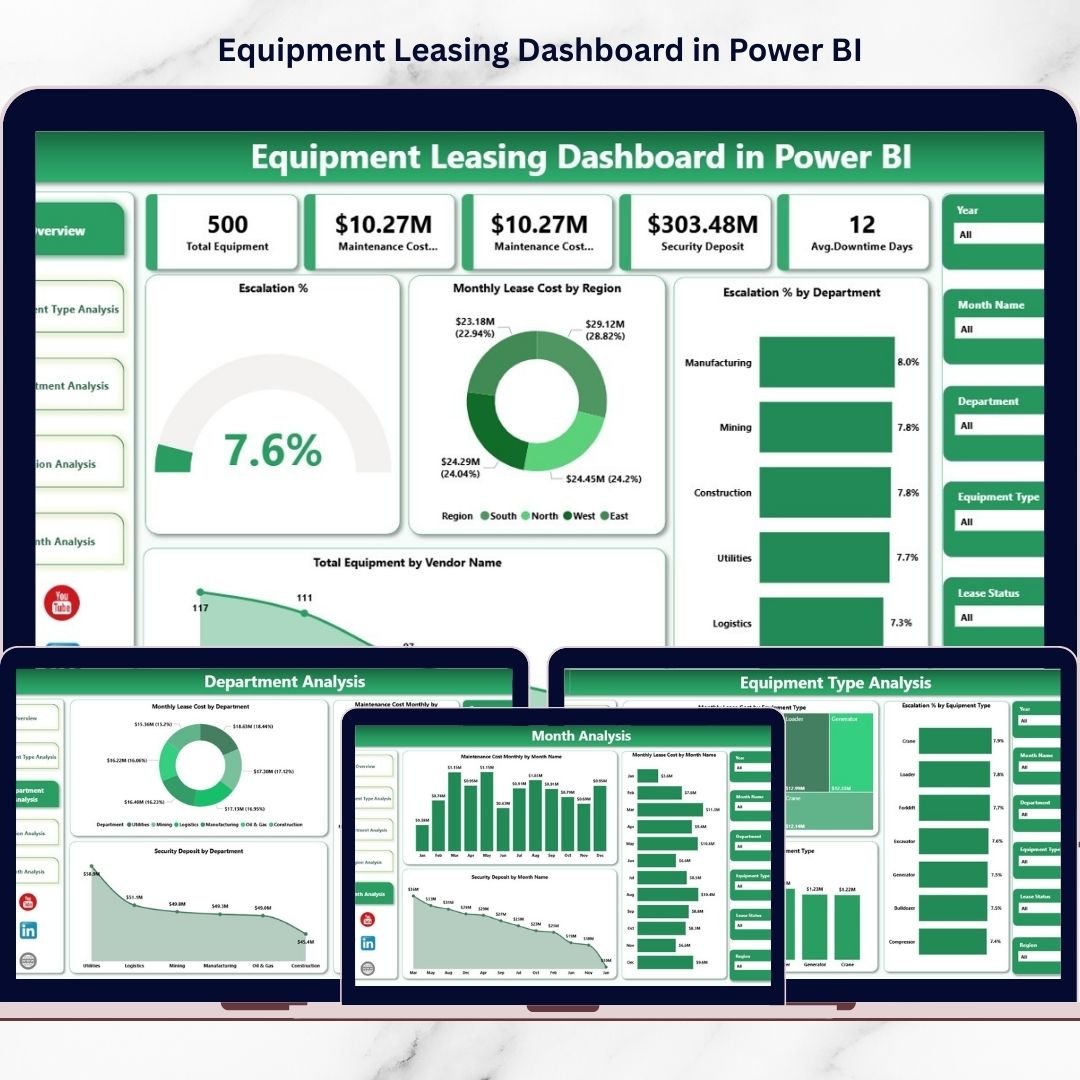
That’s exactly why we built the Equipment Leasing Dashboard in Power BI — a powerful, ready-to-use business intelligence solution designed to bring complete clarity to your leasing operations.
This interactive dashboard transforms raw lease data into dynamic visual insights. With real-time filtering, executive KPI cards, and multi-dimensional analysis, your finance, procurement, and operations teams can instantly detect cost drivers and optimization opportunities. Consequently, your organization moves from reactive reporting to proactive asset control.
Whether you manage a growing equipment fleet or a complex multi-region portfolio, this dashboard gives you the visibility and confidence to make smarter decisions.
🔑 Key Feature of Equipment Leasing Dashboard in Power BI
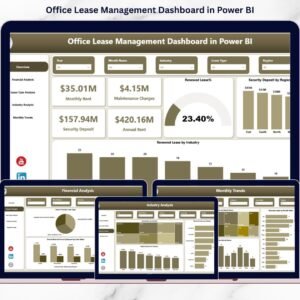
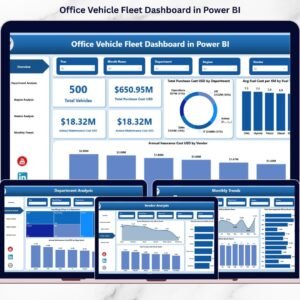
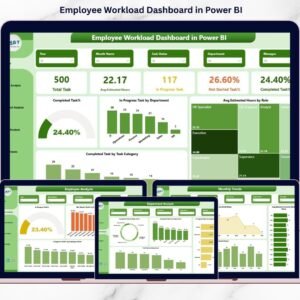
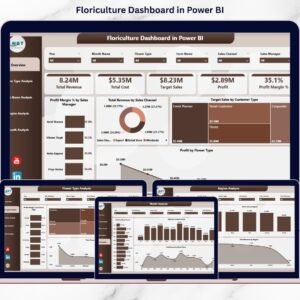
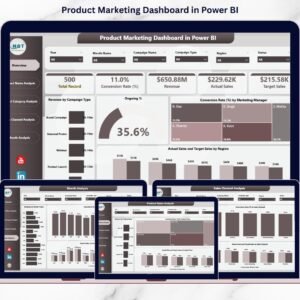
✨ Executive Overview Command Center
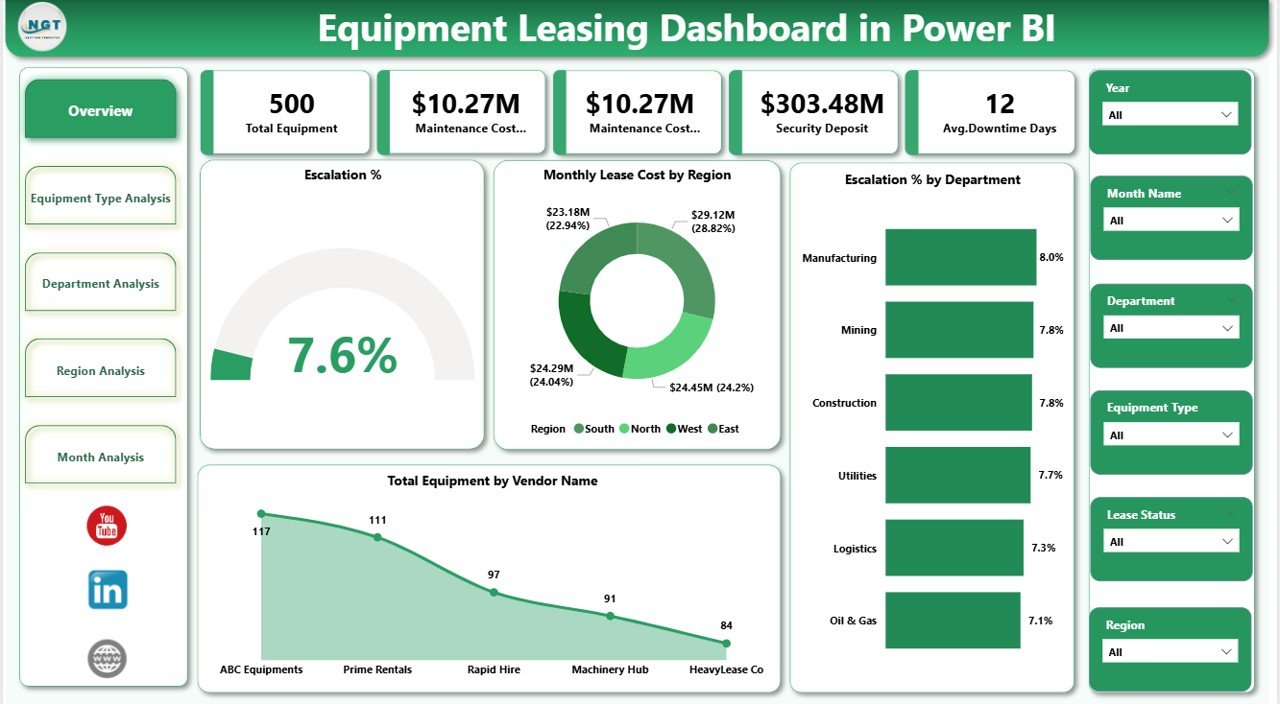
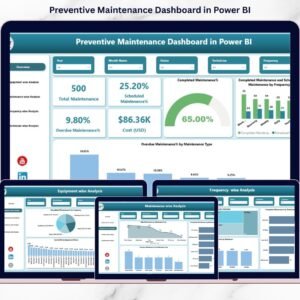
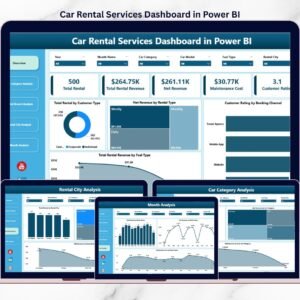
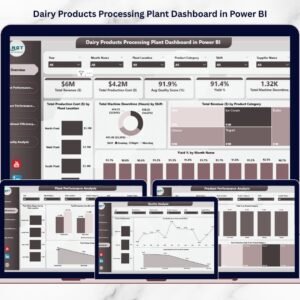
Get a high-level snapshot of lease performance with powerful KPI cards and visuals.
📊 Interactive Smart Slicers
Filter by department, region, equipment type, and time for instant insights.
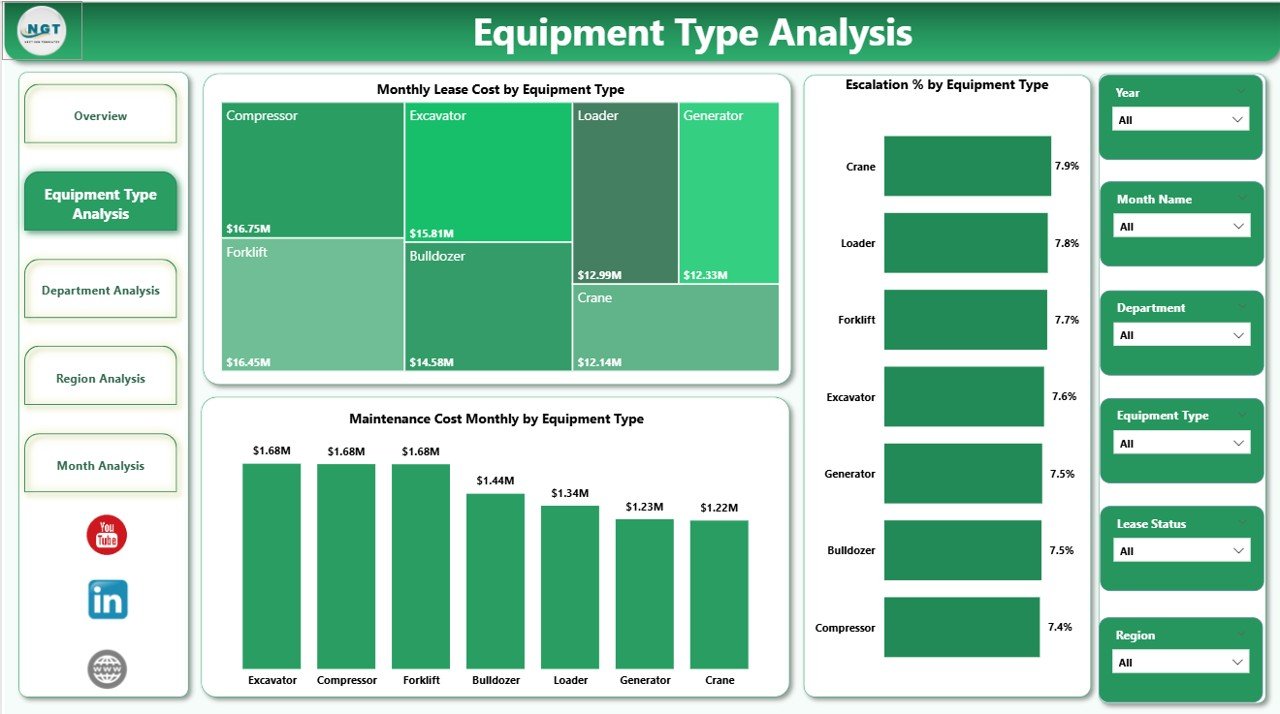
🏭 Equipment Type Intelligence
Identify high-cost equipment categories and monitor escalation patterns.
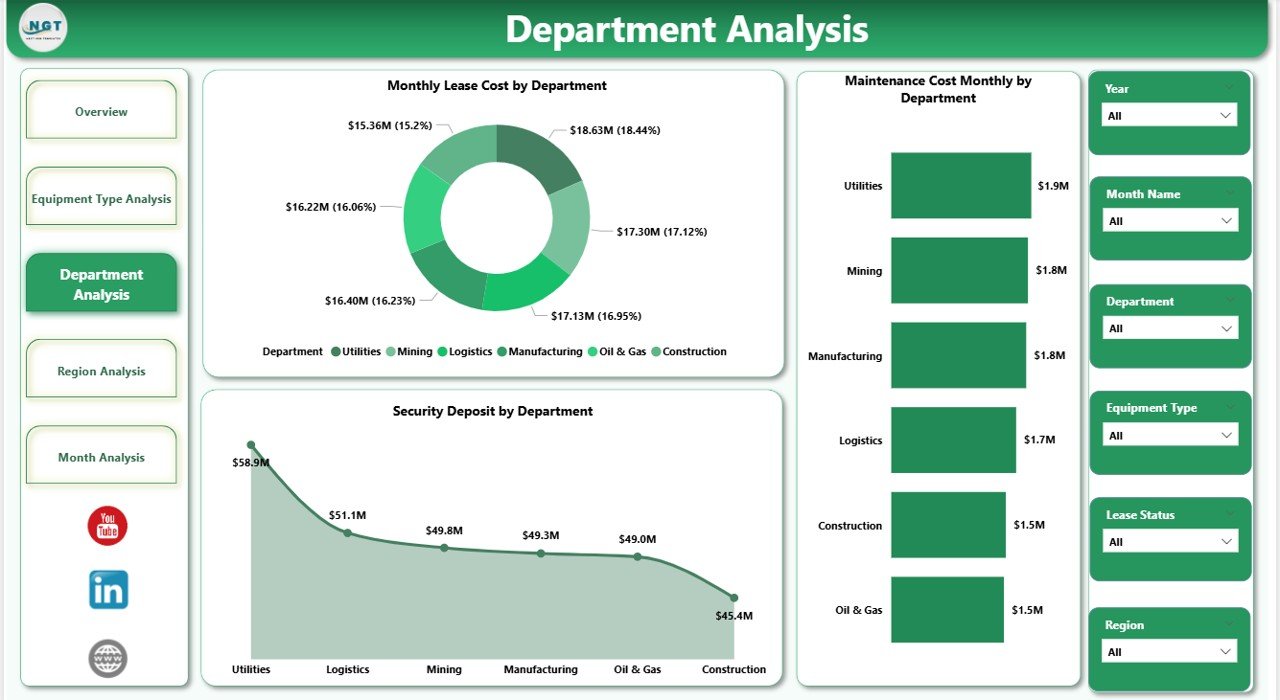
💰 Department Cost Monitoring
Track internal cost centers and improve budget accountability.
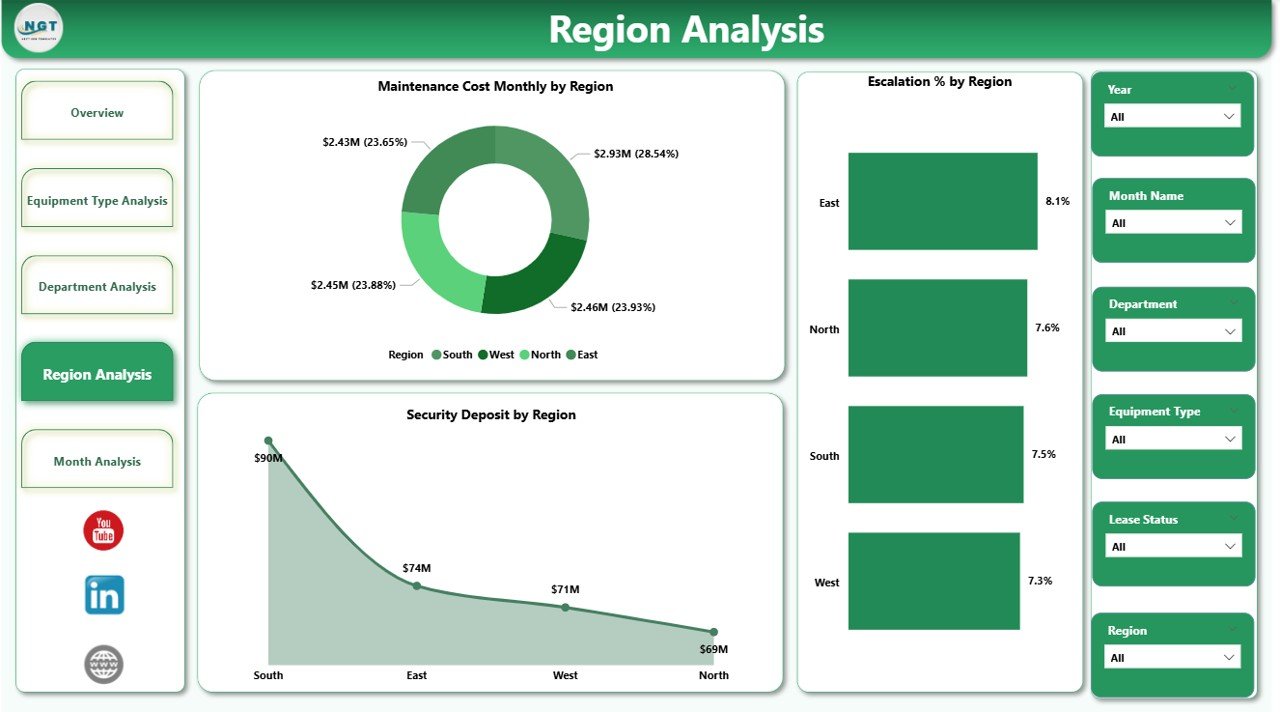
🌍 Regional Performance Visibility
Compare geographic trends to detect high-expense locations quickly.
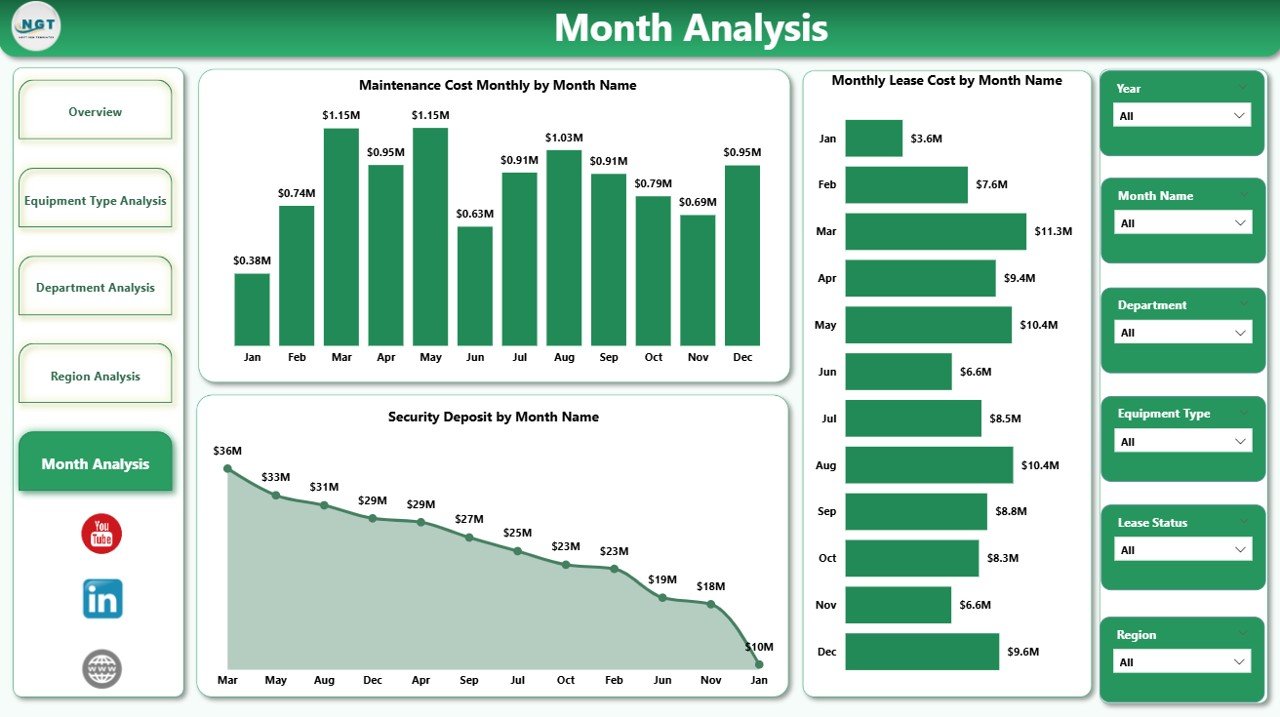
📅 Monthly Trend Analysis
Monitor lease cost movement and maintenance spikes over time.
⚡ High-Performance Power BI Model
Optimized for smooth performance even with large datasets.
🎯 Executive-Ready Visual Design
Professional dashboards perfect for leadership reviews and board meetings.
📦 What’s Inside the Equipment Leasing Dashboard in Power BI
This product delivers a complete, ready-to-use analytics framework.
✔️ Power BI Desktop File (.pbix)
✔️ 5 Interactive Analytical Pages
✔️ Dynamic KPI Cards
✔️ Advanced Slicers for Filtering
✔️ Structured Data Model
✔️ Interactive Visual Reports
✔️ Easy Data Refresh Setup
Everything is pre-configured so you can start analyzing immediately.
🛠️ How to Use the Equipment Leasing Dashboard in Power BI
Getting started is fast and beginner-friendly.
Step 1: Download and open the PBIX file
Step 2: Connect or replace with your lease data
Step 3: Refresh the dataset
Step 4: Use slicers to filter insights
Step 5: Review dashboards for decision-making
Within minutes, your organization will have a powerful equipment leasing command center.
🎯 Who Can Benefit from This Equipment Leasing Dashboard in Power BI
This dashboard is ideal for organizations managing leased equipment at scale.
✅ CFOs and Finance Managers
✅ Procurement Heads
✅ Operations Managers
✅ Asset Management Teams
✅ Facility Managers
✅ Business Analysts
✅ Multi-location Enterprises
If your organization wants tighter cost control and better asset visibility, this tool is essential.
Why This Dashboard Is a Game-Changer
Unlike manual reporting methods, this dashboard provides:
✔️ Real-time lease visibility
✔️ Automated cost monitoring
✔️ Vendor concentration insights
✔️ Maintenance expense tracking
✔️ Department accountability
✔️ Faster executive reporting
As a result, your team shifts from reactive firefighting to proactive lease optimization.
### Click hare to read the Detailed blog post
📺 Visit our YouTube channel to learn step-by-step video tutorials
👉 Youtube.com/@PKAnExcelExpert