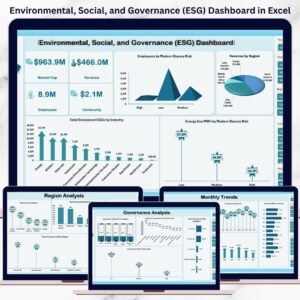
Environmental, Social, and Governance (ESG) reporting is no longer optional. Investors, regulators, and stakeholders now demand transparency, accountability, and measurable sustainability impact. However, managing ESG data across multiple spreadsheets quickly becomes complex and time-consuming.Environmental, Social, and Governance (ESG) Dashboard in Excel
That is exactly why the Environmental, Social, and Governance (ESG) Dashboard in Excel is the perfect solution. This ready-to-use Excel dashboard converts complex ESG data into clear, visual, and decision-ready insights—without expensive software or steep learning curves.
Designed for professionals who want clarity and control, this dashboard helps you monitor ESG performance, track risks, and communicate sustainability progress with confidence.
✅ Key Features of the Environmental, Social, and Governance (ESG) Dashboard in Excel
📊 All-in-One ESG Reporting
Track Environmental, Social, and Governance metrics in a single, structured Excel dashboard.
🌍 Environmental Performance Tracking
Monitor Scope 1 & Scope 2 emissions, total CO₂e, energy use (MWh), and water withdrawal with clear visuals.
👥 Social Impact Analysis
Analyze workforce diversity, safety incidents, community investment, and modern slavery risk exposure.
🏛️ Governance Effectiveness Monitoring
Measure board independence, women on board percentage, supplier ESG scores, and data privacy incidents.
📍 Region & Industry Insights
Compare ESG performance across regions, industries, and risk categories to identify high-risk areas.
📈 Monthly Trend Analysis
Track ESG performance changes over time using month-wise trend charts for better forecasting.
⚡ Dynamic & Interactive Design
Pivot tables and charts update automatically when data changes—no manual recalculation required.
💰 Cost-Effective Excel Solution
No expensive ESG software licenses. Built entirely in Excel for maximum accessibility.
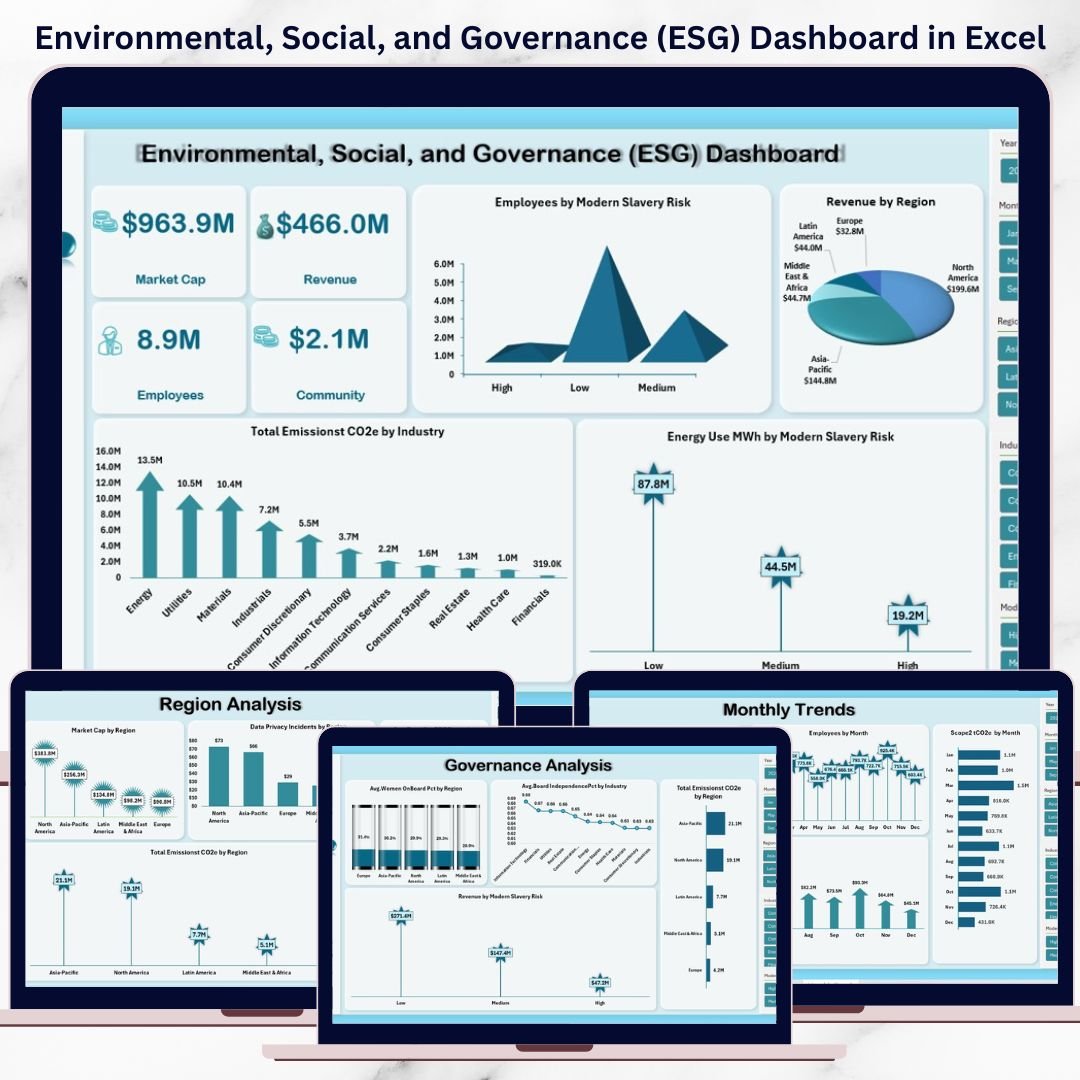
📦 What’s Inside the Environmental, Social, and Governance (ESG) Dashboard in Excel
This professionally designed ESG dashboard includes multiple analytical sheets, each serving a clear purpose:
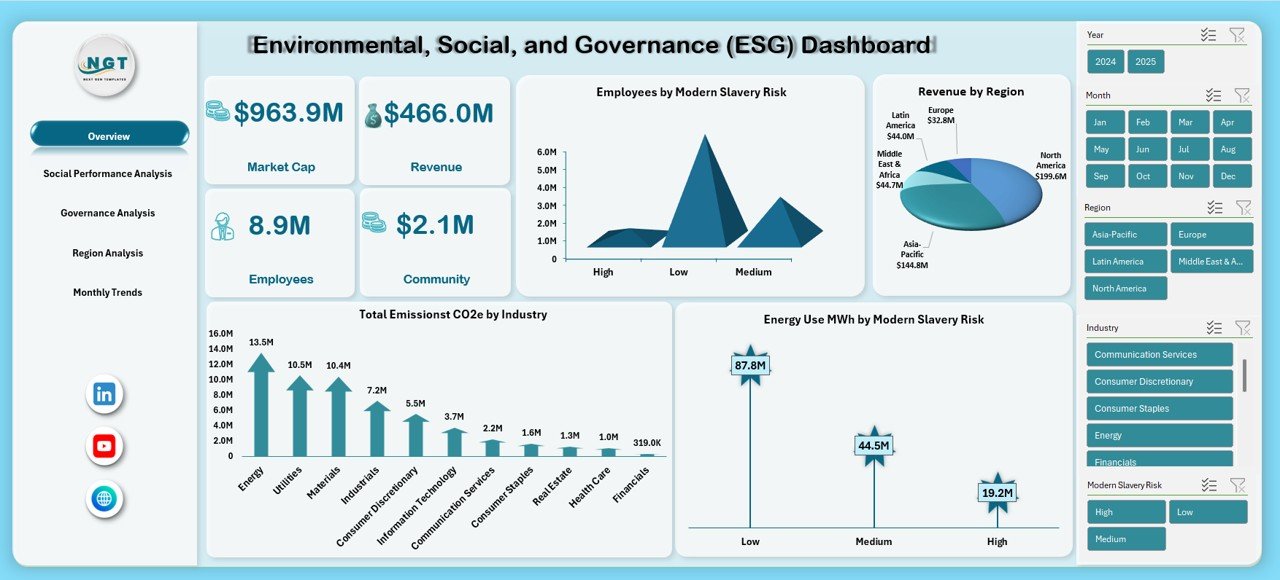
📌 Overview Sheet
Provides a high-level ESG snapshot including Market Cap, Revenue, Employees, Community Investment, Emissions, and Energy Use.
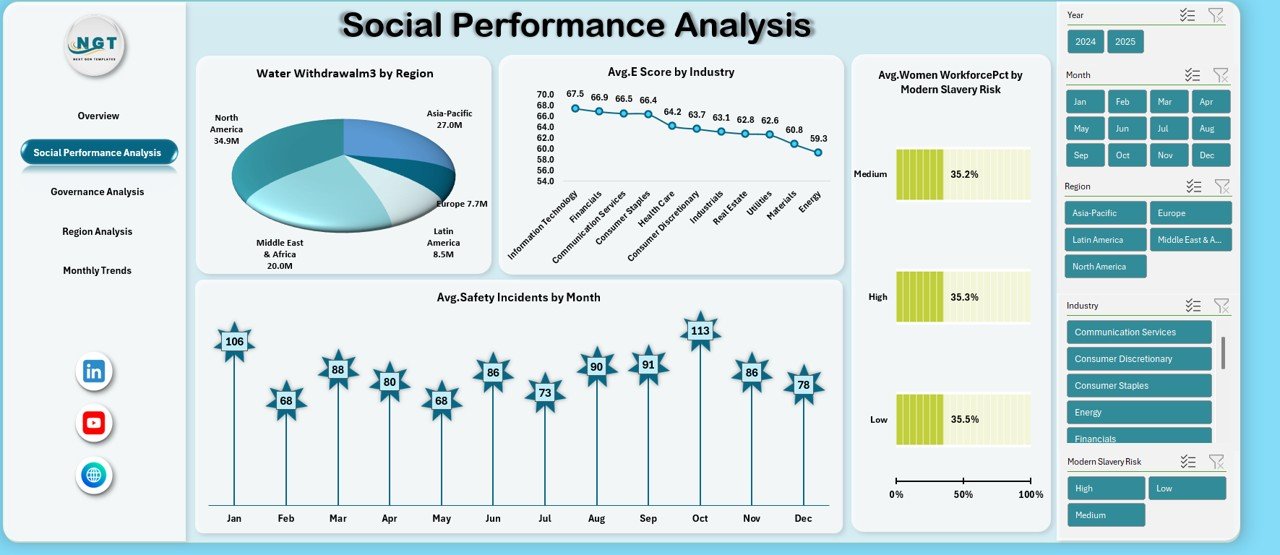
📌 Social Performance Analysis Sheet
Focuses on water withdrawal, safety incidents, women workforce percentage, and social risk indicators.
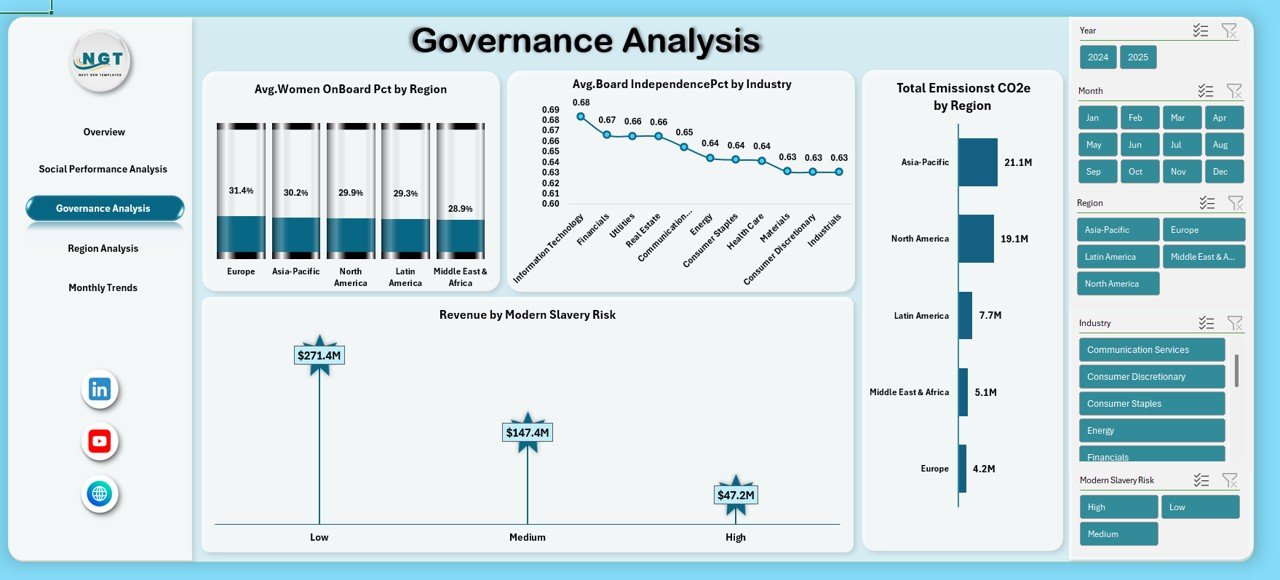
📌 Governance Analysis Sheet
Tracks board diversity, independence, emissions by region, and revenue exposure to modern slavery risk.
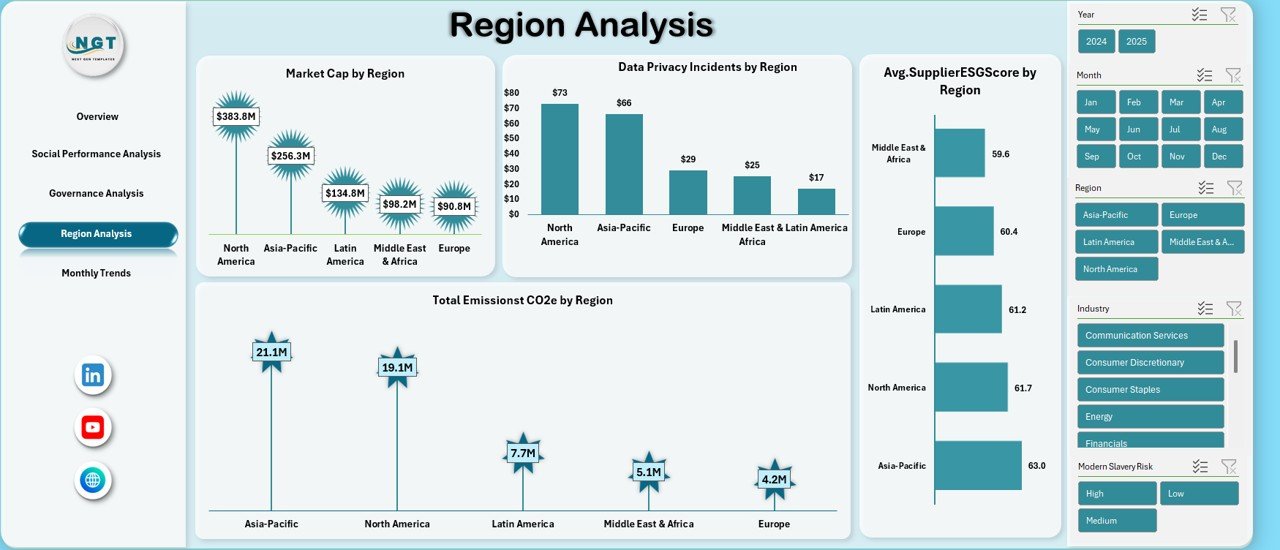
📌 Region Analysis Sheet
Highlights regional ESG performance, supplier ESG scores, emissions, and data privacy incidents.
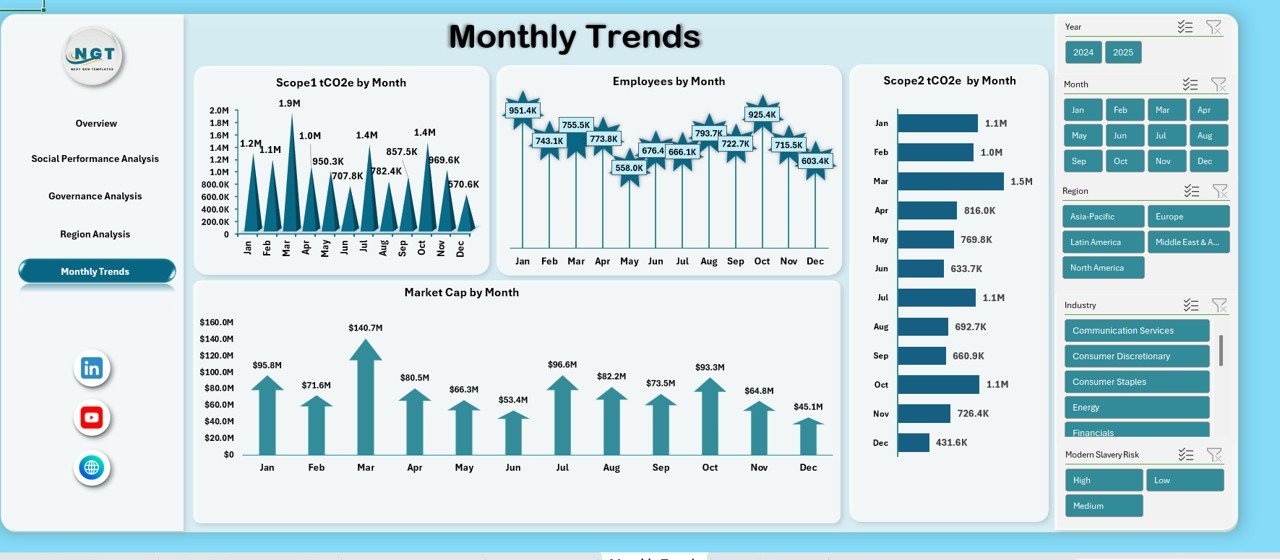
📌 Monthly Trends Sheet
Shows Scope 1 & Scope 2 emissions and Market Cap trends over time for progress tracking.
Each sheet is cleanly structured, visually clear, and ready for executive reporting.
⚙️ How to Use the Environmental, Social, and Governance (ESG) Dashboard in Excel
Using this ESG dashboard is simple and user-friendly:
1️⃣ Enter or import your ESG data into the provided Excel tables
2️⃣ Let built-in formulas calculate totals, averages, and percentages
3️⃣ Refresh Pivot Tables to update charts automatically
4️⃣ Analyze ESG performance by month, region, industry, or risk category
5️⃣ Use insights for compliance reporting, strategy planning, and stakeholder communication
No advanced Excel skills are required.
👥 Who Can Benefit from This Environmental, Social, and Governance (ESG) Dashboard in Excel?
This ESG Dashboard is ideal for:
🌿 Sustainability & ESG Teams
📊 ESG Analysts and Consultants
💼 Finance and Compliance Teams
🏢 Corporate Strategy Teams
📈 Executives and Board Members
🤝 Investors and Auditors
Whether you are a large organization or a growing business, this dashboard helps you manage ESG data efficiently.
Click here to read the Detailed Blog Post
Watch the step-by-step video tutorial:
Watch the step-by-step video tutorial:


Reviews
There are no reviews yet.