In a world focused on sustainability and cost efficiency, energy management is no longer optional — it’s essential. Whether you manage an industrial plant, a commercial building, or a large organization, knowing exactly how energy is consumed can help you cut costs, reduce waste, and reach sustainability goals faster.
That’s where the Energy Report in Excel comes in — a ready-to-use, interactive, and automated reporting tool designed to simplify energy tracking, analysis, and visualization.
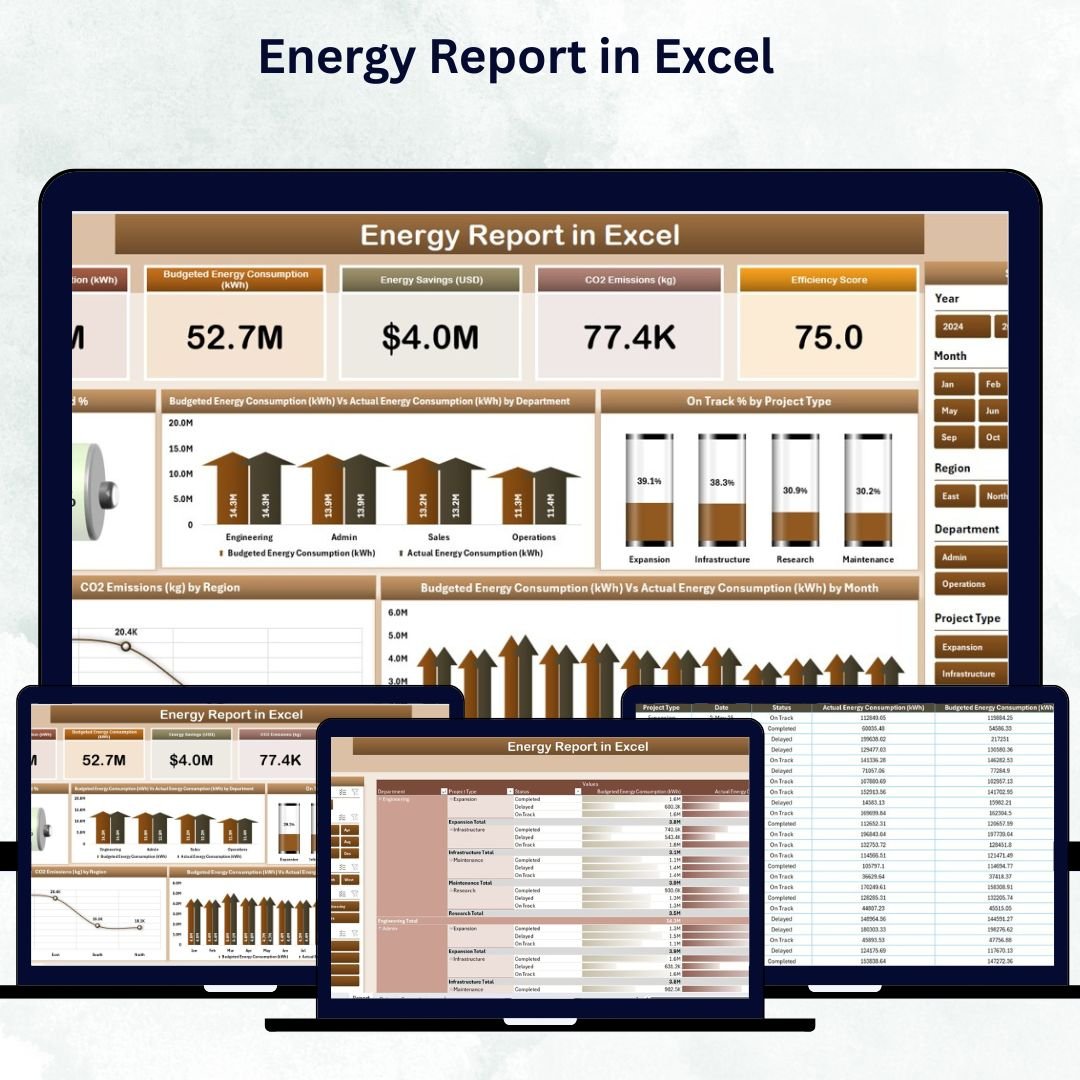
This professional Excel template transforms complex energy data into easy-to-understand charts, KPIs, and summaries, empowering you to make data-driven decisions about energy efficiency and performance.
💡 Key Features of the Energy Report in Excel
✅ 📊 Three Main Pages + Support Sheet – Includes Summary Page, Report Page, Data Sheet, and Support Sheet for structured data flow and analysis.
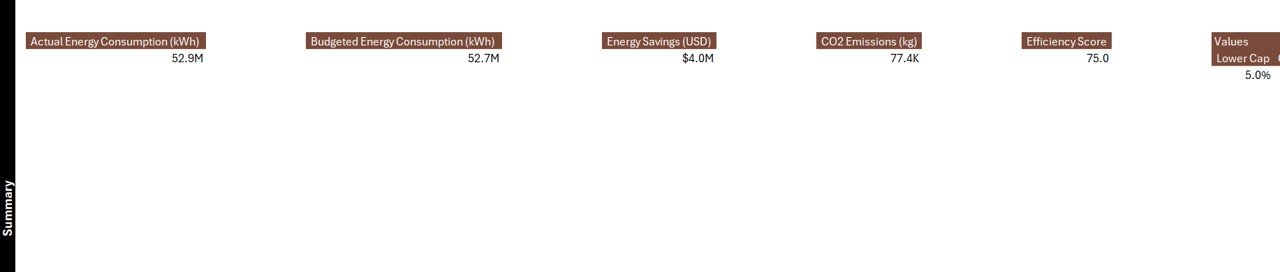
✅ 📈 Interactive Summary Page – The main dashboard where you’ll find five KPI cards showing Total Energy Consumption, Budget Energy, Actual Energy, CO₂ Emissions, and Completion %.
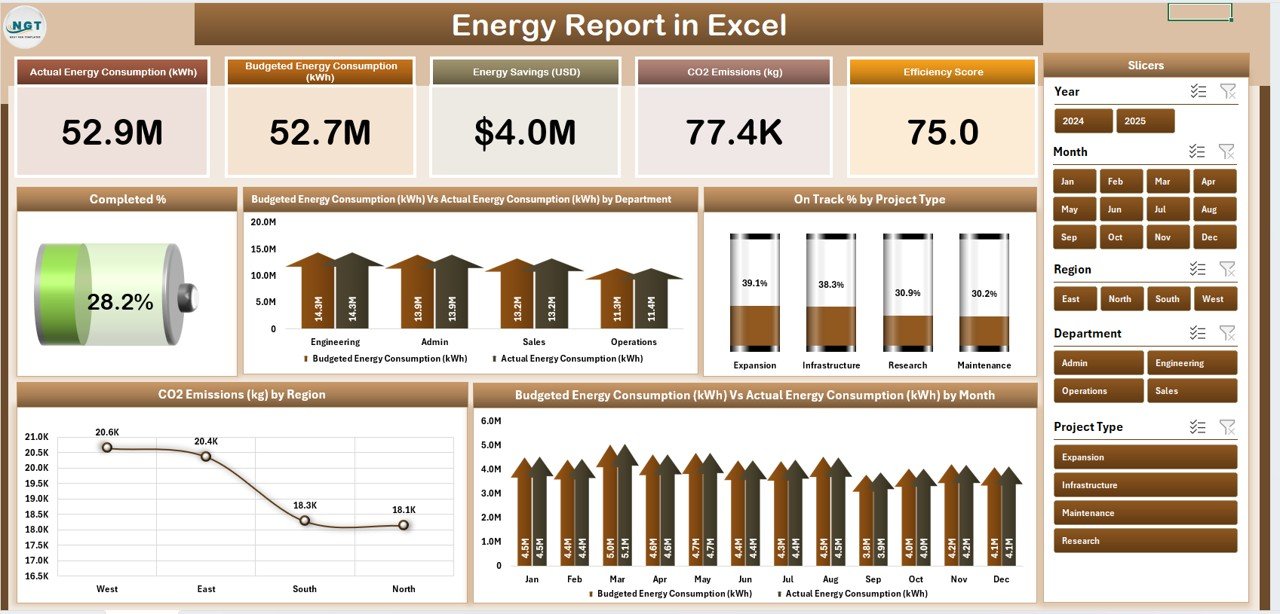
✅ 🎯 Advanced Charts – Visualize energy trends and performance with five key charts:
-
Completed % by Department
-
Budget vs Actual Energy (kWh) by Department
-
On-Track % by Project Type
-
CO₂ Emissions (kg) by Region
-
Budget vs Actual Energy (kWh) by Month
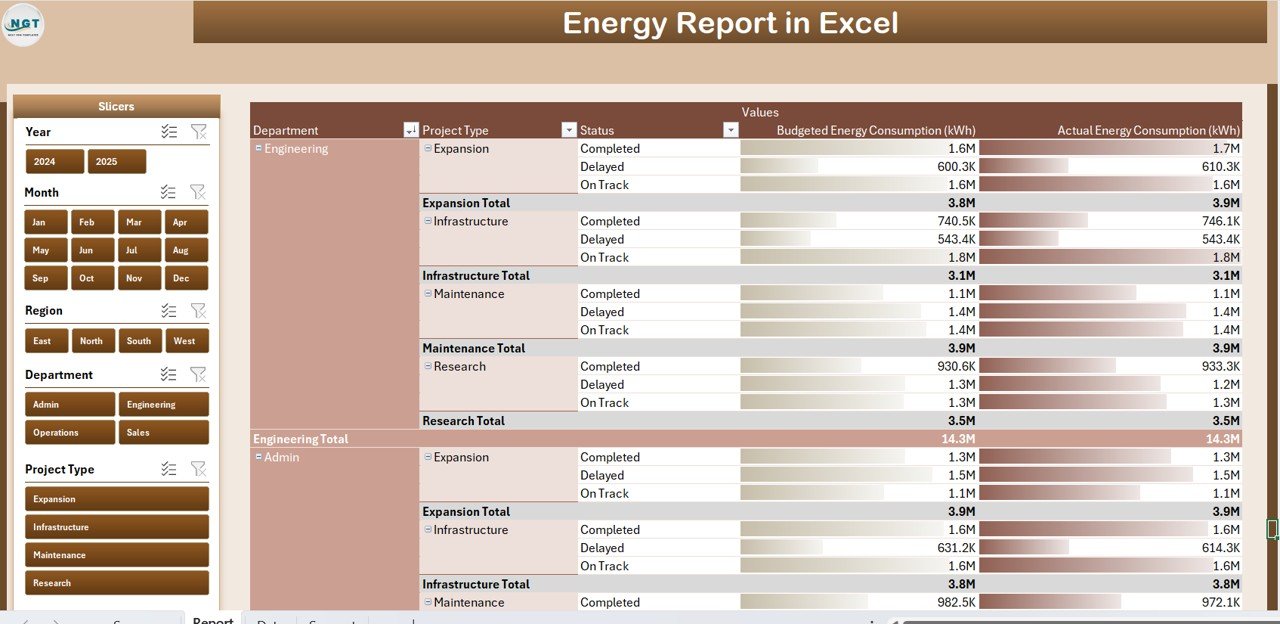
✅ 📋 Detailed Report Page – Analyze department-wise and project-wise energy data with slicers for Month, Region, and Project Type.
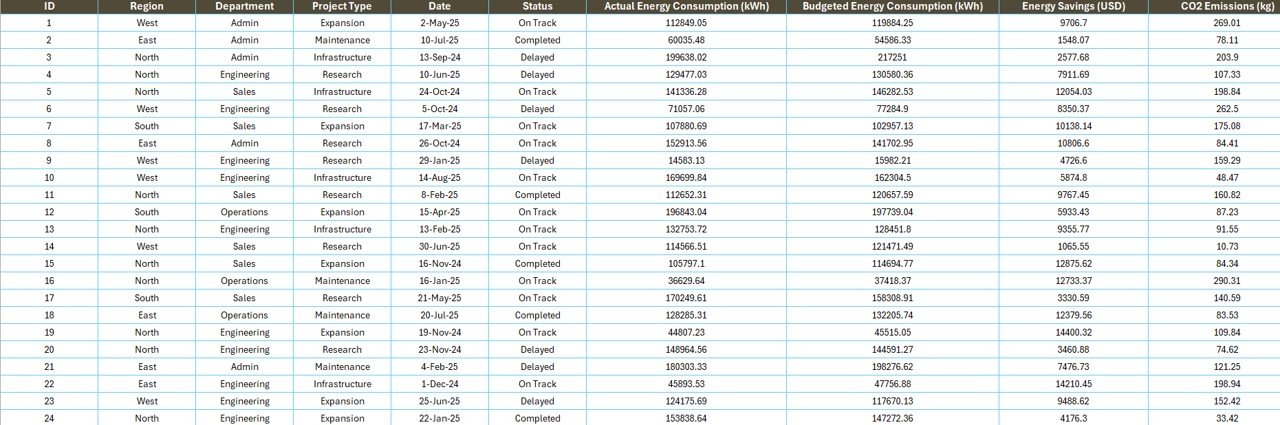
✅ 📂 Data Sheet (Backend) – Holds all your raw data including Department, Region, Energy Source, Budget, Actual, CO₂, Month, and Year. Automatically updates visuals.
✅ 🧭 Support Sheet – Contains reference lists (departments, regions, units) to keep dropdowns and slicers consistent.
✅ ⚙️ Auto-Calculation & Real-Time Updates – Built-in formulas ensure totals, percentages, and trends update automatically as you add or modify data.
✅ 🧩 Fully Customizable – Add your own KPIs, visuals, and metrics like Cost per kWh or Renewable Energy %.
✅ 🔍 Easy Filtering – Analyze results by department, region, or project type with just a click.
✅ 💾 100% Excel-Based – No coding, no extra software, and works entirely offline!
🔍 What’s Inside the Energy Report Template
📁 Summary Page – The high-level dashboard showcasing performance KPIs, CO₂ emissions, and efficiency metrics.
📁 Report Page – Drill down into details, compare performance, and identify departments or projects that exceed or fall short of goals.
📁 Data Sheet – The single source of truth where all energy data resides.
📁 Support Sheet – Preloaded with dropdown lists, reference data, and units for smooth functionality.
Every page is interconnected — update the Data Sheet once, and your dashboard refreshes automatically!
⚡ How to Use the Energy Report in Excel
1️⃣ Open the Template in Microsoft Excel (desktop recommended).
2️⃣ Enter or Import Data into the Data Sheet (e.g., energy usage, budgets, CO₂, regions).
3️⃣ Set Your Targets – Fill in your budgeted or planned energy values.
4️⃣ Use Slicers – Filter data by month, department, or region on the Summary Page.
5️⃣ Review KPIs & Charts – Instantly see which areas are overconsuming or performing efficiently.
6️⃣ Update Monthly – Keep your report current for accurate decision-making.
No complex setup — just enter your data and watch the visuals come to life!
🌱 Who Can Benefit from This Template
🏭 Facility Managers – Monitor consumption across departments and plants.
🏢 Energy Auditors – Track performance and spot inefficiencies quickly.
📊 Sustainability Teams – Measure environmental KPIs like CO₂ emissions.
💼 Operations Managers – Analyze cost vs. efficiency trends by project.
📈 Corporate Executives – Access high-level insights in one visual dashboard.
Whether you’re reporting internally or presenting to clients, this dashboard makes energy management clear, visual, and professional.
✅ Advantages of the Energy Report in Excel
-
💰 Cut Costs – Identify high-consumption areas and reduce wastage.
-
🌿 Boost Sustainability – Track CO₂ and align with eco-goals.
-
🕒 Save Time – Automated calculations and charts — no manual work.
-
🧠 Smart Insights – Compare Actual vs Budget to guide decisions.
-
⚙️ Easy Customization – Add your own visuals or KPIs anytime.
-
🔄 Real-Time Accuracy – Data updates instantly with each entry.
🔗 Click here to read the Detailed blog post
📺 Visit our YouTube channel to learn step-by-step video tutorials
👉 YouTube.com/@PKAnExcelExpert


Reviews
There are no reviews yet.