


Energy efficiency has moved from being an option to a business necessity. Organizations today must manage their energy usage not only to cut costs but also to meet sustainability targets and comply with regulations. Yet, manual tracking through traditional spreadsheets often results in messy data, missed insights, and wasted time.
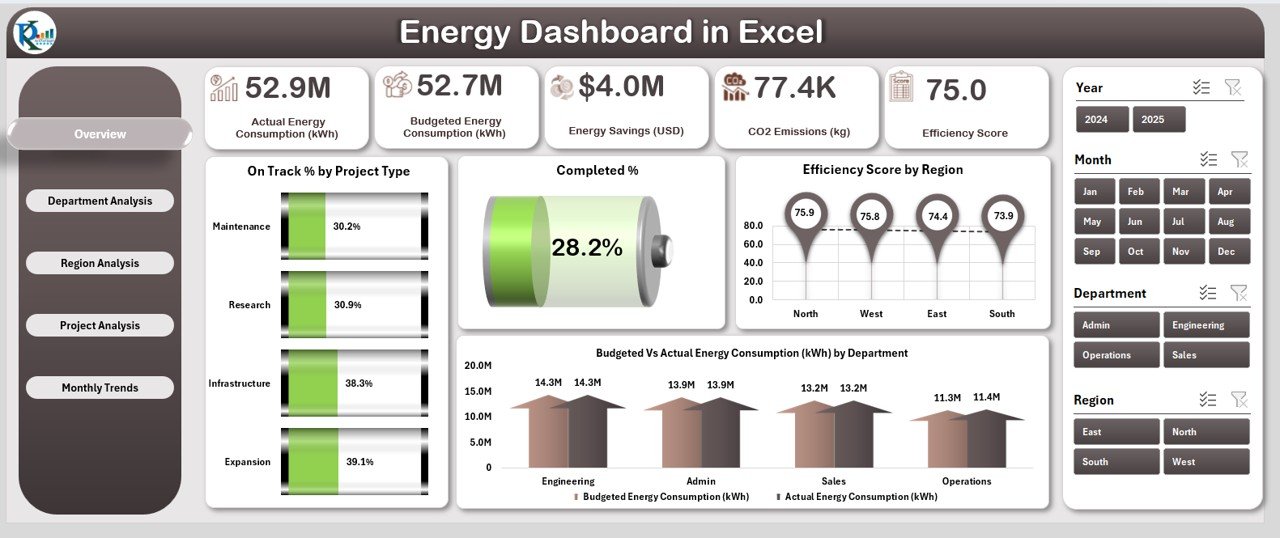
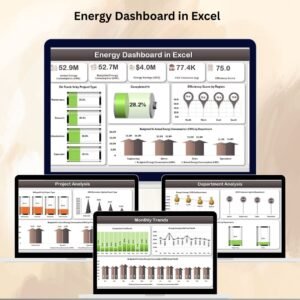
The Energy Dashboard in Excel is the solution. This ready-to-use, interactive tool transforms raw energy data into visual insights. Built with Excel’s familiar interface, enhanced with slicers, charts, and automated formulas, it helps businesses track consumption, monitor efficiency, compare budgets vs. actuals, and measure sustainability metrics like CO2 emissions—all in one place.
✨ Key Features of the Energy Dashboard
-
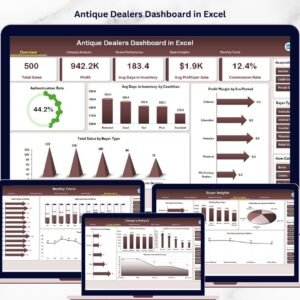
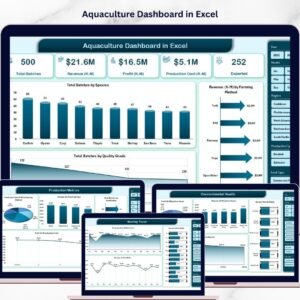
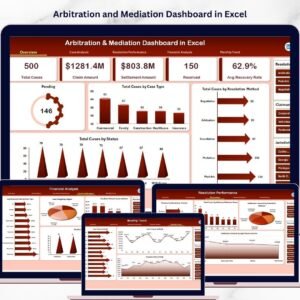
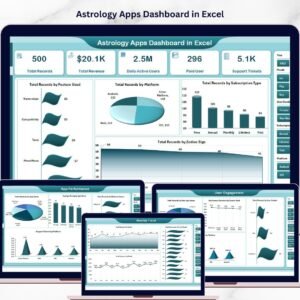
📊 Overview Page – A summary page with 5 performance cards and 4 key visuals, including on-time % by project type, completed %, efficiency score by region, and budget vs. actual energy consumption.
-
🏢 Department Analysis – Tracks performance at a department level with charts for CO2 emissions, energy savings, and completion rates.
-
🌍 Region Analysis – Breaks down energy metrics geographically to identify high or low-performing areas.
-
🏗️ Project Analysis – Evaluates efficiency across project types with delayed %, CO2 emissions, and budget variances.
-
📅 Monthly Trends – Displays time-based metrics including energy savings, completion %, and monthly budget vs. actuals.
-
📂 Data & Support Sheets – Organized backend for raw data, reference values, and formulas to keep the dashboard functioning smoothly.
📊 What’s Inside the Energy Dashboard
-
Interactive Navigation – Move seamlessly between overview, departments, regions, projects, and trends.
-
Dynamic Charts & Slicers – Filter data by time, type, and region for detailed insights.
-
KPIs that Matter – Efficiency scores, energy savings, CO2 emissions, completed %, and more.
-
Data Entry Sheet – Centralized storage of raw energy records.
-
Support Sheet – Pre-built references for drop-downs and formulas.
🛠️ How to Use the Energy Dashboard
1️⃣ Gather Data – Collect monthly or weekly energy usage, CO2 emissions, and cost figures.
2️⃣ Input Data – Add records into the data sheet in a structured format.
3️⃣ Review Overview Page – Get a snapshot of performance with summary cards and visuals.
4️⃣ Drill Down – Use department, region, or project tabs to pinpoint inefficiencies.
5️⃣ Analyze Trends – Check the Monthly Trends tab for seasonality and recurring issues.
6️⃣ Take Action – Use insights to optimize processes, cut costs, or improve sustainability outcomes.
👥 Who Can Benefit from This Dashboard?
-
🏭 Manufacturing Plants – Monitor energy usage by machines, lines, or facilities.
-
🏢 Corporate Offices – Track departmental energy savings and costs.
-
🌍 Government Agencies – Evaluate energy projects against compliance targets.
-
🏫 Educational Institutions – Manage consumption across campuses and departments.
-
♻️ Sustainability Managers – Measure CO2 emissions and efficiency to align with green goals.
💡 Advantages of the Energy Dashboard in Excel
-
⚡ Real-Time Decision Making – Up-to-date charts and KPIs for fast insights.
-
💰 Cost Efficiency – Track budget vs. actuals to reduce overspending.
-
🌱 Sustainability Support – Monitor CO2 metrics and energy savings to meet eco goals.
-
🧑🤝🧑 Accountability – Breakdowns by department, project, and region for clear ownership.
-
📈 Simplified Reporting – Replace manual reports with automated, visual summaries.
🚀 Opportunities for Improvement
-
🔄 Automation – Integrate with IoT energy meters for real-time updates.
-
📊 Advanced Analytics – Add forecasting for future energy needs.
-
☁️ Collaboration – Use cloud platforms for multi-user access.
-
🔗 BI Integration – Scale to Power BI for large organizations.
✅ Best Practices for Using the Energy Dashboard
-
Standardize data entry with drop-downs.
-
Automate updates with linked source files.
-
Focus on core KPIs instead of overloading visuals.
-
Apply conditional formatting for quick red/green insights.
-
Review monthly to keep data relevant and actionable.
Click here to read the Detailed blog post
Visit our YouTube channel to learn step-by-step video tutorials


Reviews
There are no reviews yet.