
Managing employee retention is one of the biggest challenges faced by HR teams today. When employees resign frequently, organizations lose productivity, incur high hiring costs, and struggle to maintain team stability. That’s exactly why the Employee Retention Dashboard in Excel is the perfect solution for HR leaders who want complete clarity, powerful insights, and data-driven decision-making — without using complicated tools. This ready-to-use dashboard transforms your HR data into clear visuals that instantly reveal resignation trends, department performance, engagement levels, and supervisor impact.
With this dashboard, you no longer need multiple spreadsheets or manual reports. Everything is organized, structured, and visualized in one powerful Excel file — helping you understand why employees leave, where the problems exist, and what actions can improve retention immediately.Employee Retention Dashboard in Excel.
✨ Key Features of the Employee Retention Dashboard in Excel
This dashboard is designed to give HR teams a 360-degree understanding of workforce behavior. It includes multiple analytical pages that break down retention trends at every level — department, job role, location, and supervisor.
Here’s what makes this dashboard truly powerful:
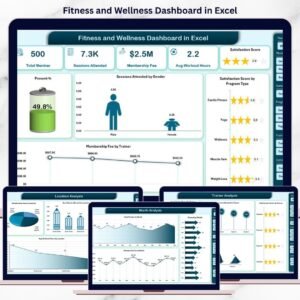
🔹 Real-Time Workforce Insights
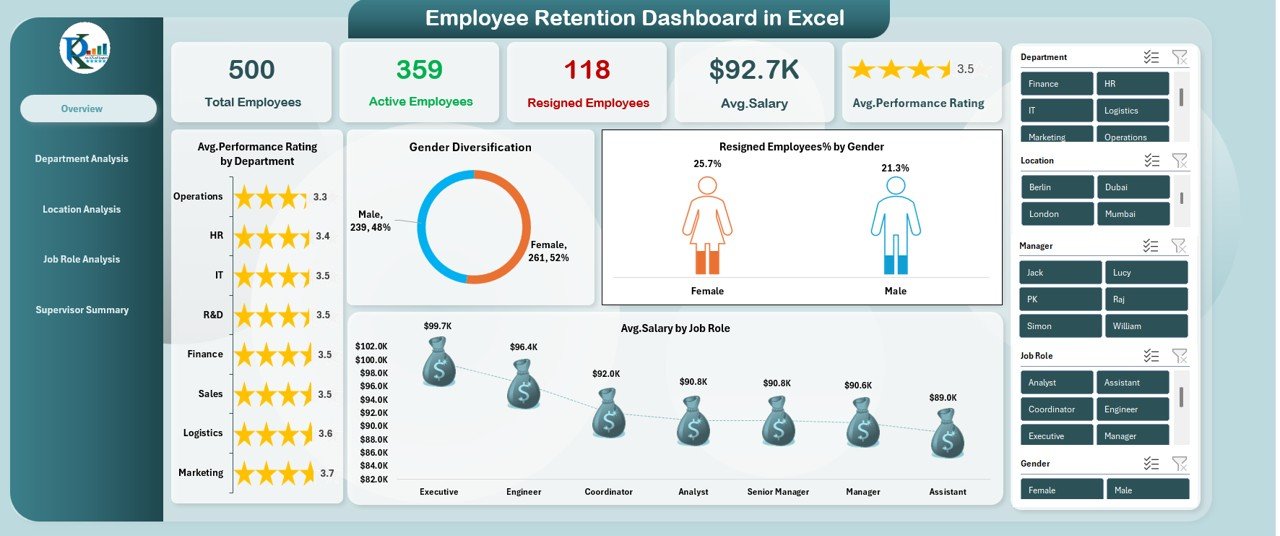
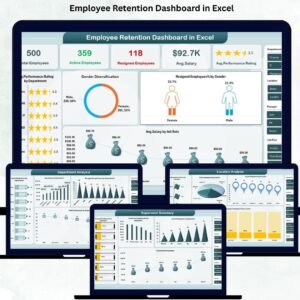
Track total employees, active employees, and resigned employees with accurate and automatically updated metrics.
Employee Retention Dashboard in Excel
🔹 Advanced Attrition Analytics
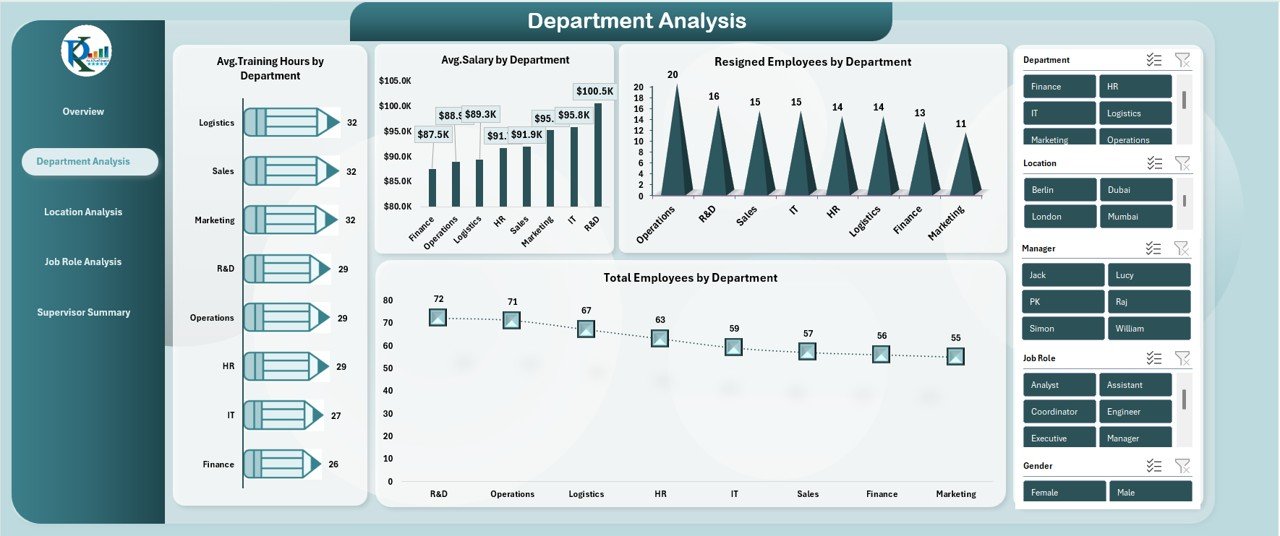
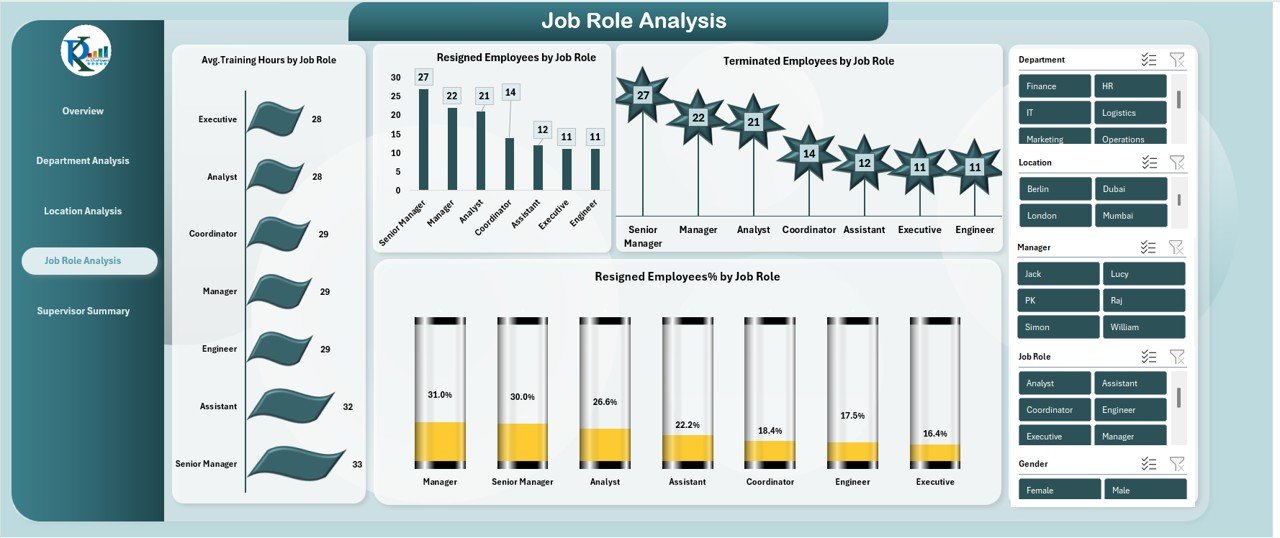
Visuals like Resigned Employees % by Gender, Resigned Employees by Department, and Resigned Employees % by Job Role help you identify the exact causes behind employee exits.
🔹 Department-Ready Insights
Understand departmental training hours, workforce strength, performance scores, and risk areas with clean charts and comparisons.
🔹 Location-Based Analysis
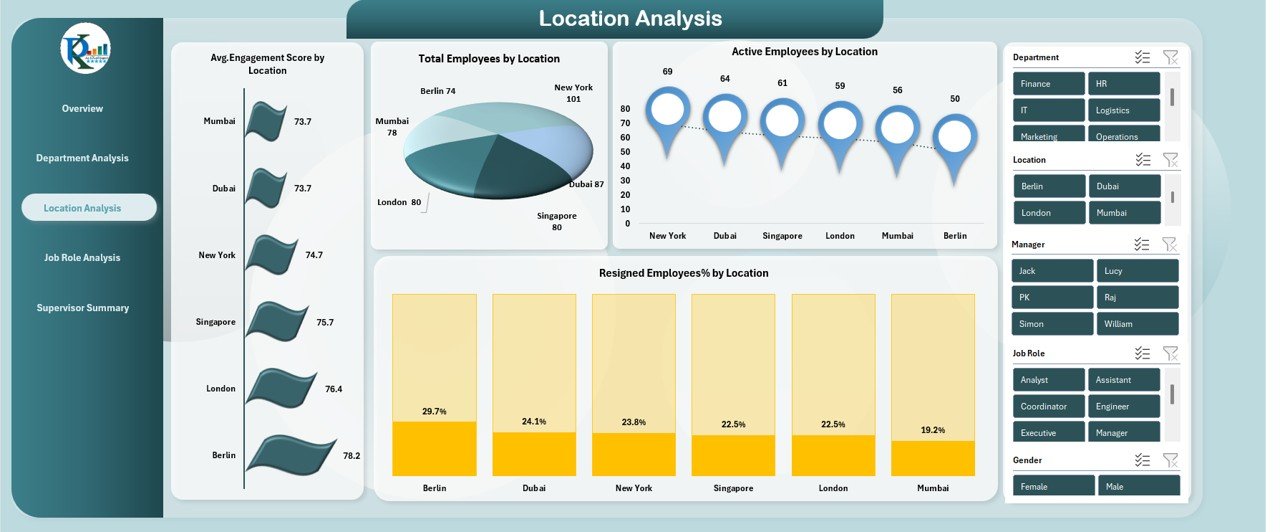
Identify which regions face low engagement, high attrition, or low performance — enabling location-specific improvement plans.
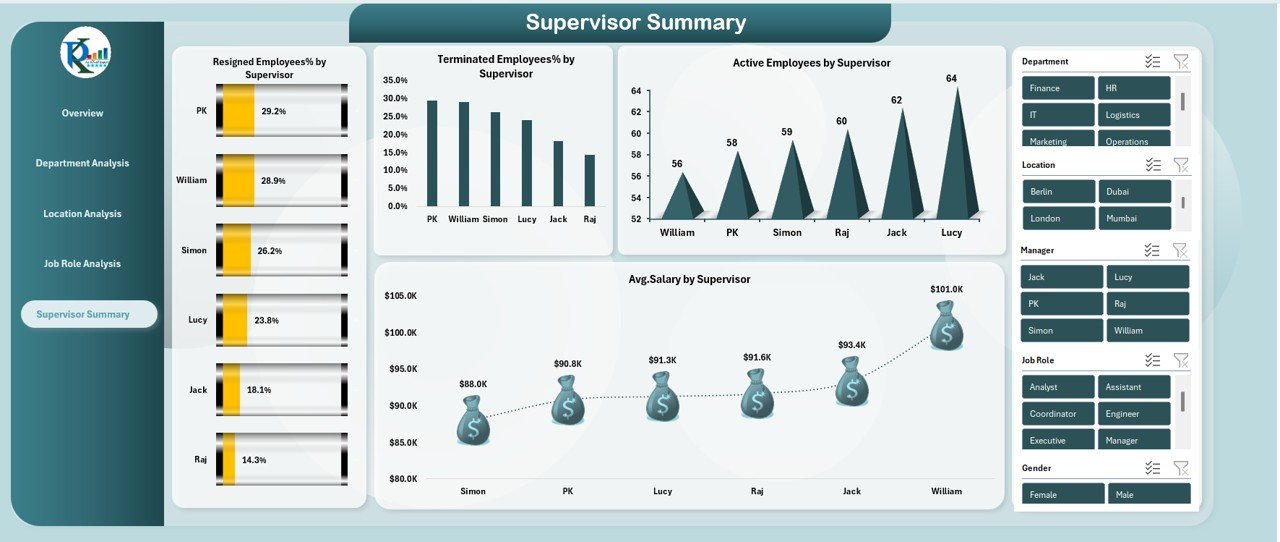
🔹 Supervisor Performance Summary
Track employee movement under each supervisor to understand leadership effectiveness and employee experience quality.
These features help HR leaders take faster actions, make stronger decisions, and improve retention proactively.

📘 What’s Inside the Employee Retention Dashboard
The dashboard consists of structured Excel sheets designed for deep analysis:
🟦 Overview Page
A complete snapshot of company-wide retention performance with cards, charts, slicers, and key metrics.
Employee Retention Dashboard in Excel
🟩 Department Analysis Page
Detailed insights into which departments need training, resources, or leadership improvements.
🟧 Location Analysis Page
Visualize how different office locations impact employee satisfaction, engagement, and retention.
🟪 Job Role Analysis Page
See which roles are high-risk, which departments need upskilling, and where performance gaps exist.
🟫 Supervisor Summary Page
Identify supervisors with high resignation rates and evaluate leadership performance.
Each sheet is interactive, organized, and ready for HR reporting.
🛠️ How to Use the Employee Retention Dashboard
Using this dashboard is extremely simple — even for beginners.
✔️ Step 1: Enter or Paste HR Data
Add employee details such as training hours, performance ratings, gender, job role, salaries, and resignation dates.
✔️ Step 2: Refresh Pivot Tables
Excel instantly updates all charts, cards, and visuals.
Employee Retention Dashboard in Excel
✔️ Step 3: Filter With Slicers
Quickly compare departments, locations, genders, tenure groups, or job roles.
✔️ Step 4: Review High-Risk Areas
Use visuals like Resigned Employees % by Department or Resigned Employees % by Location to identify problem zones.
✔️ Step 5: Take Strategic HR Actions
Create training plans, salary adjustments, supervisor improvement initiatives, or engagement programs based on insights.
👥 Who Can Benefit from This Dashboard
The Employee Retention Dashboard in Excel is designed for: Employee Retention Dashboard in Excel
👨💼 HR Managers
Easily detect attrition patterns and create data-driven HR policies.
🧑🤝🧑 HR Business Partners
Compare departments and support managers with accurate insights.
🏢 Organizational Leaders
Understand workforce stability and build stronger performance cultures.
🧑💻 HR Analysts
Analyze complex data without using advanced BI tools.
🏫 Training & Development Teams
Improve training hours, performance scores, and engagement levels.
Whether you’re a small business or a large enterprise, this dashboard gives you the clarity you need to reduce attrition and build a strong, committed workforce.
🔗 Click here to read the Detailed blog post
▶️ Visit our YouTube channel to learn step-by-step video tutorials – YouTube.com/@PKAnExcelExpert


Reviews
There are no reviews yet.