In today’s data-driven business environment, measuring and improving employee performance is essential for organizational growth. Manual tracking methods are time-consuming, error-prone, and lack actionable insights. The Employee Performance Tracking Report in Excel solves this problem by offering a smart, interactive, and ready-to-use reporting system designed to monitor employee performance effortlessly.
This Excel-based tool provides HR managers, team leaders, and executives with real-time visibility into workforce productivity, efficiency, and promotion readiness. With powerful data visualization, slicers, and automated calculations, this report turns raw data into meaningful insights that empower decision-makers to recognize top performers and improve underperforming areas — all within a single Excel file.
✨ Key Features of the Employee Performance Tracking Report in Excel
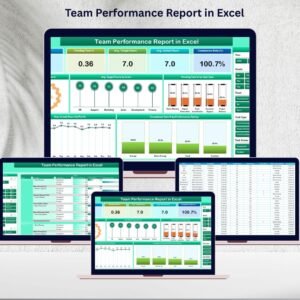
📈 Interactive Summary Dashboard: Visualize overall performance with summary cards, trend charts, and KPI indicators.
🏢 Departmental Analysis: Compare productivity and performance levels across various departments.
👨💼 Job Role-Based Insights: Understand how different roles contribute to overall organizational success.
🚀 Promotion Readiness Tracking: Identify promotion-eligible employees instantly using automated percentage calculations.
📊 Dynamic Slicers & Filters: Filter results by department, role, rating, or month for customized insights.
📅 Monthly Performance Trends: Analyze completed projects and performance patterns over time.
🧮 Automated Calculations: Excel formulas update metrics like averages, percentages, and ratings automatically.
🎨 Professional Dashboard Layout: Clear visuals and color-coded indicators (green, yellow, red) for quick performance assessment.
🧠 Customizable & Scalable: Add new KPIs, departments, or metrics as your organization grows.
📘 What’s Inside the Employee Performance Tracking Report in Excel
This report includes four interconnected worksheets, each serving a distinct purpose:
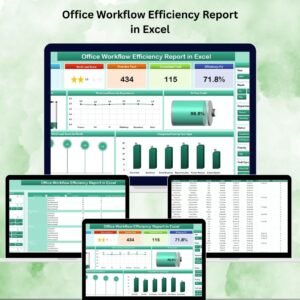
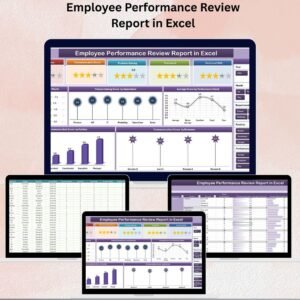
1️⃣ Summary Page: The main dashboard with key performance cards and five visual charts — including Promotion Eligibility %, Performance by Role, and Project Trends.
2️⃣ Report Page: A detailed table displaying employee-level data such as ID, Department, Job Role, Rating, and Promotion Eligibility. Ideal for HR reviews and appraisal meetings.
3️⃣ Data Sheet: The data engine where all employee performance data is stored and calculated automatically through formulas and pivot tables.
4️⃣ Support Sheet: A backend database that maintains dropdown lists for departments, job roles, and rating scales — ensuring error-free data entry and consistency.
Each sheet works together seamlessly, ensuring accurate, real-time updates across the entire report.
⚡ How to Use the Employee Performance Tracking Report in Excel
🚀 Step 1: Input all employee details (ID, Name, Department, Role, Rating, etc.) in the Data Sheet.
📊 Step 2: Refresh pivot tables to update visuals on the Summary and Report pages.
🎯 Step 3: Use slicers to filter performance data by department, role, or time period.
🧩 Step 4: Review promotion readiness and performance scores instantly through automated visuals.
📈 Step 5: Export the dashboard visuals for management reviews or HR presentations.
No coding or advanced Excel knowledge is required — the entire system is plug-and-play!
👥 Who Can Benefit from the Employee Performance Tracking Report in Excel
💼 HR Professionals: Streamline appraisals and performance evaluations with visual dashboards.
🧑💻 Team Leaders: Monitor team performance and identify training needs efficiently.
🏢 Executives: Get a complete view of organizational performance trends in one glance.
📊 Project Managers: Analyze productivity and project completion rates by department or individual.
🧠 Business Owners: Make data-backed decisions to promote top performers and optimize resource allocation.
🎯 Training & Development Teams: Identify skill gaps and plan focused improvement initiatives.
This tool is ideal for organizations of all sizes seeking a transparent, efficient, and automated way to measure and manage employee performance.
🔗 Click here to read the Detailed Blog Post
🎥 Visit our YouTube channel to learn step-by-step video tutorials
🔗 YouTube.com/@PKAnExcelExpert


Reviews
There are no reviews yet.