In the modern workplace, tracking employee benefits isn’t just about maintaining records—it’s about making smart, data-driven decisions. Whether you’re an HR leader, a finance officer, or a department manager, understanding how benefits are used, where money goes, and how employee engagement aligns with perks is essential.
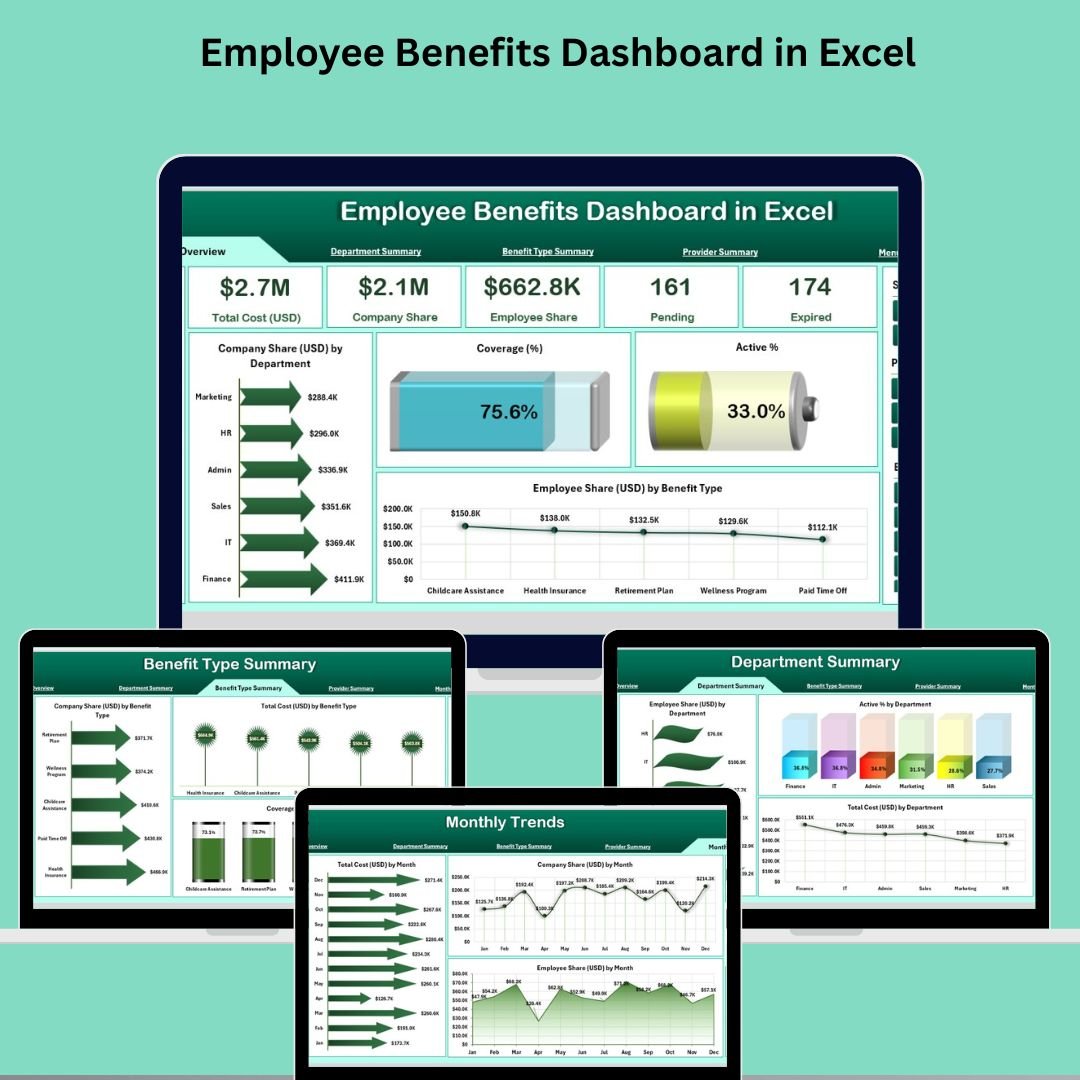
📊 Introducing the Employee Benefits Dashboard in Excel — a powerful, plug-and-play Excel-based solution that gives you total visibility into your benefits program without the need for expensive software or coding skills.
This dashboard is your secret weapon for better budgeting, smarter HR policies, and higher employee satisfaction.
✅ Key Features of Employee Benefits Dashboard in Excel
🧠 Intelligent Dashboard Design
Navigate across pages with ease using the left-side page navigator and interactive slicers to filter by:
-
Department
-
Benefit Type
-
Time Period
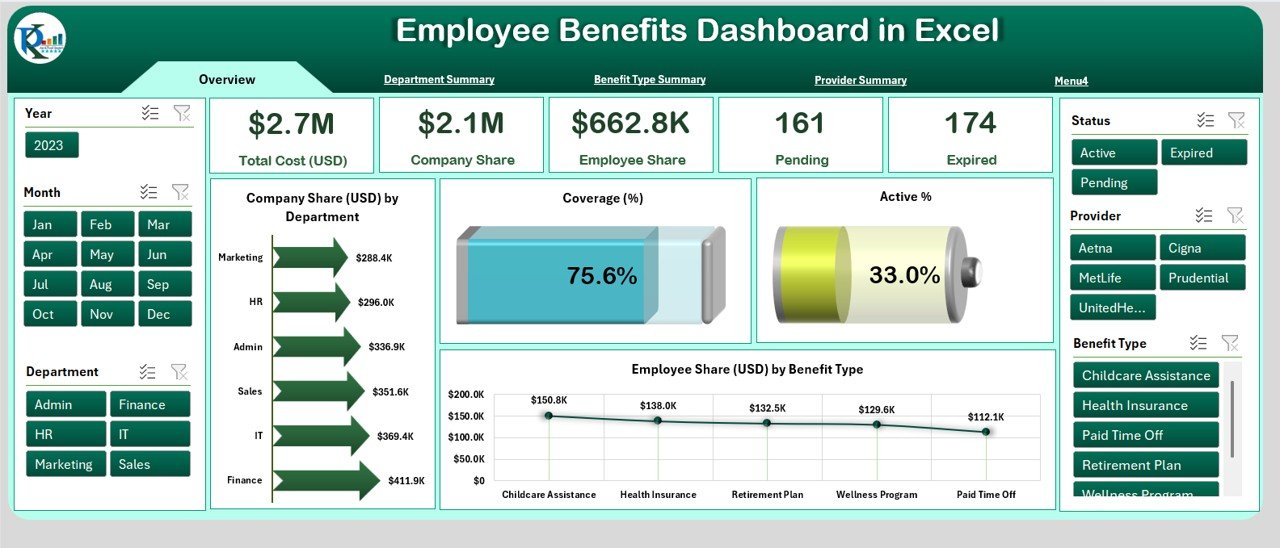
See the top 5 KPI Cards at a glance:
-
✅ Total Cost (USD)
-
🏢 Company Share
-
👥 Employee Share
-
📈 Active %
-
🛡️ Coverage %
📈 Visual charts give you immediate insight into cost distribution, coverage, and employee participation.
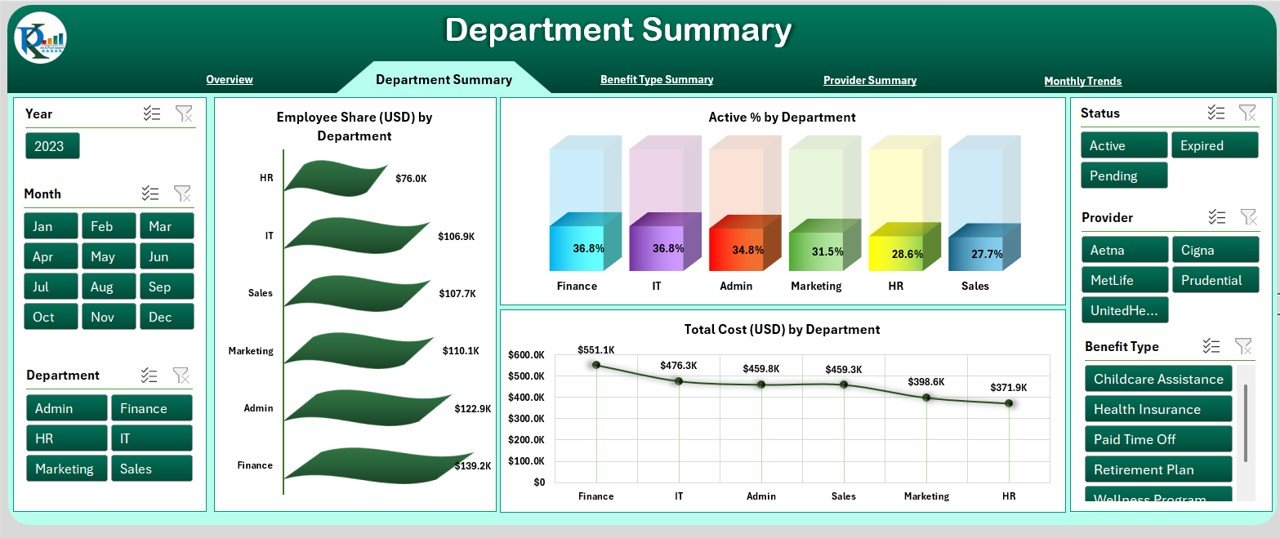
🏢 Department Summary View
Discover how each department engages with the benefits program:
-
🔍 Slicers to filter by department or benefit category
-
📊 Charts showing total cost, employee share, and active percentage per department
Helps you spot trends and plan department-specific strategies.
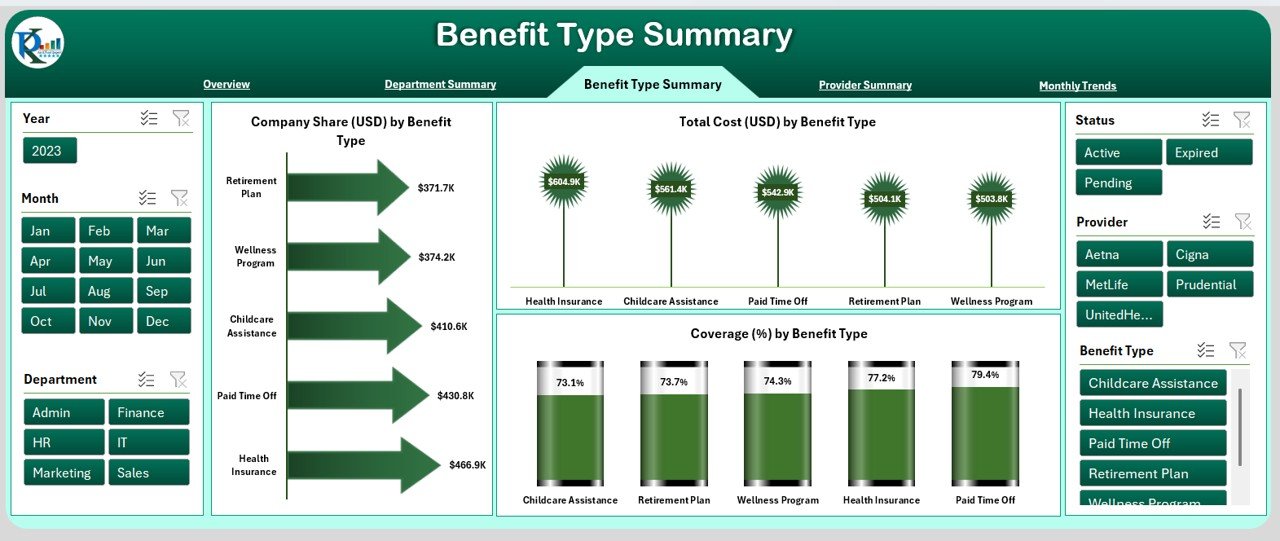
🎯 Benefit Type Summary
Track how different benefits perform:
-
💡 Company vs Employee Share per benefit
-
📊 Total cost by benefit type
-
🛡️ Coverage percentage
Whether it’s health, wellness, education, or retirement—you’ll know what’s valued most.
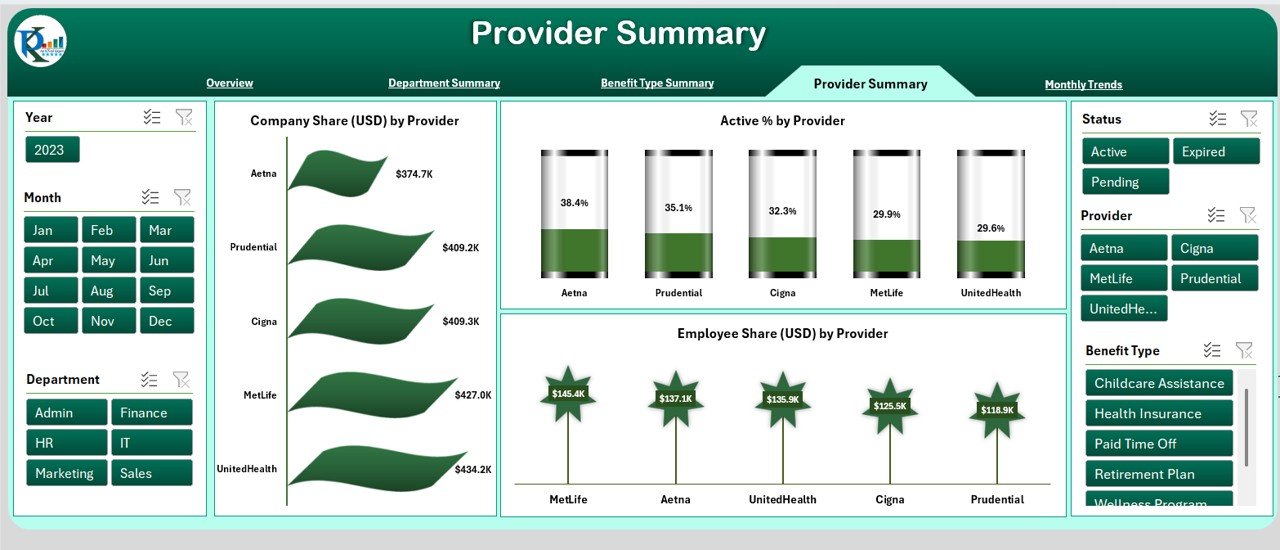
🏦 Provider Summary
Evaluate performance by benefit providers:
-
🏢 Company Share
-
👥 Employee Share
-
📈 Active %
Get the insights you need to renegotiate contracts or explore better vendors.
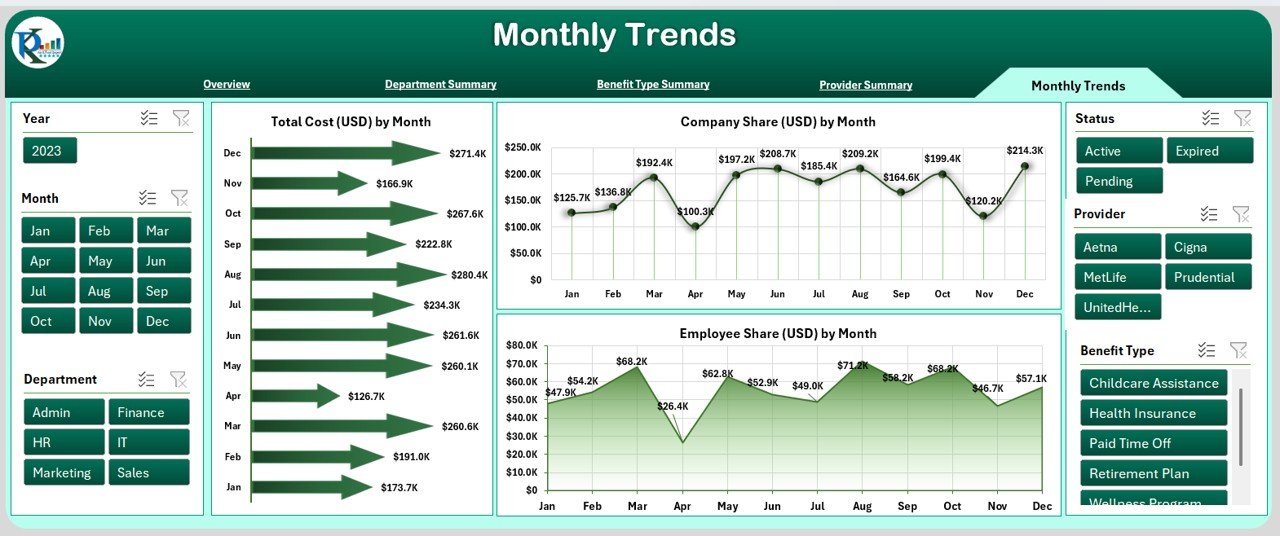
📅 Monthly Trends
Track year-round movements in:
-
💸 Total Cost
-
🏢 Company Share
-
👥 Employee Share
Plan ahead, adjust benefits, and control spending by using these month-wise patterns.
🔧 Data Sheet & Support Sheet
-
Data Sheet: Add or update benefit records here
-
Support Sheet: Manage dropdowns for departments, benefit types, and providers
Built for flexibility. Fully editable. No coding required.
📦 What’s Inside the Employee Benefits Dashboard?
✅ 6 Pages Total:
-
Overview
-
Department Summary
-
Benefit Type Summary
-
Provider Summary
-
Monthly Trends
-
Data & Support Sheets
🎯 Designed using Pivot Tables, Slicers, and Excel formulas for max performance.
🛠️ How to Use the Employee Benefits Dashboard
-
📝 Enter Data in the Data Sheet
-
🧭 Navigate to the desired page
-
🔍 Apply filters using slicers
-
📊 Analyze charts for insights
-
💡 Take action based on trends
-
💾 Update monthly for real-time performance tracking
It’s simple, visual, and scalable.
👥 Who Can Benefit from This Dashboard?
-
👨💼 HR Managers – Align benefits with employee needs
-
💰 Finance Teams – Analyze cost vs value per benefit
-
🧑💼 Department Heads – Monitor team-level participation
-
🧑💻 Small Businesses – Manage HR data without expensive software
-
📋 Auditors & Consultants – Conduct benefits analysis efficiently
This dashboard helps everyone stay aligned, informed, and proactive.
📚 Click here to read the Detailed blog post
📺 Visit our YouTube channel to learn step-by-step video tutorials


Reviews
There are no reviews yet.