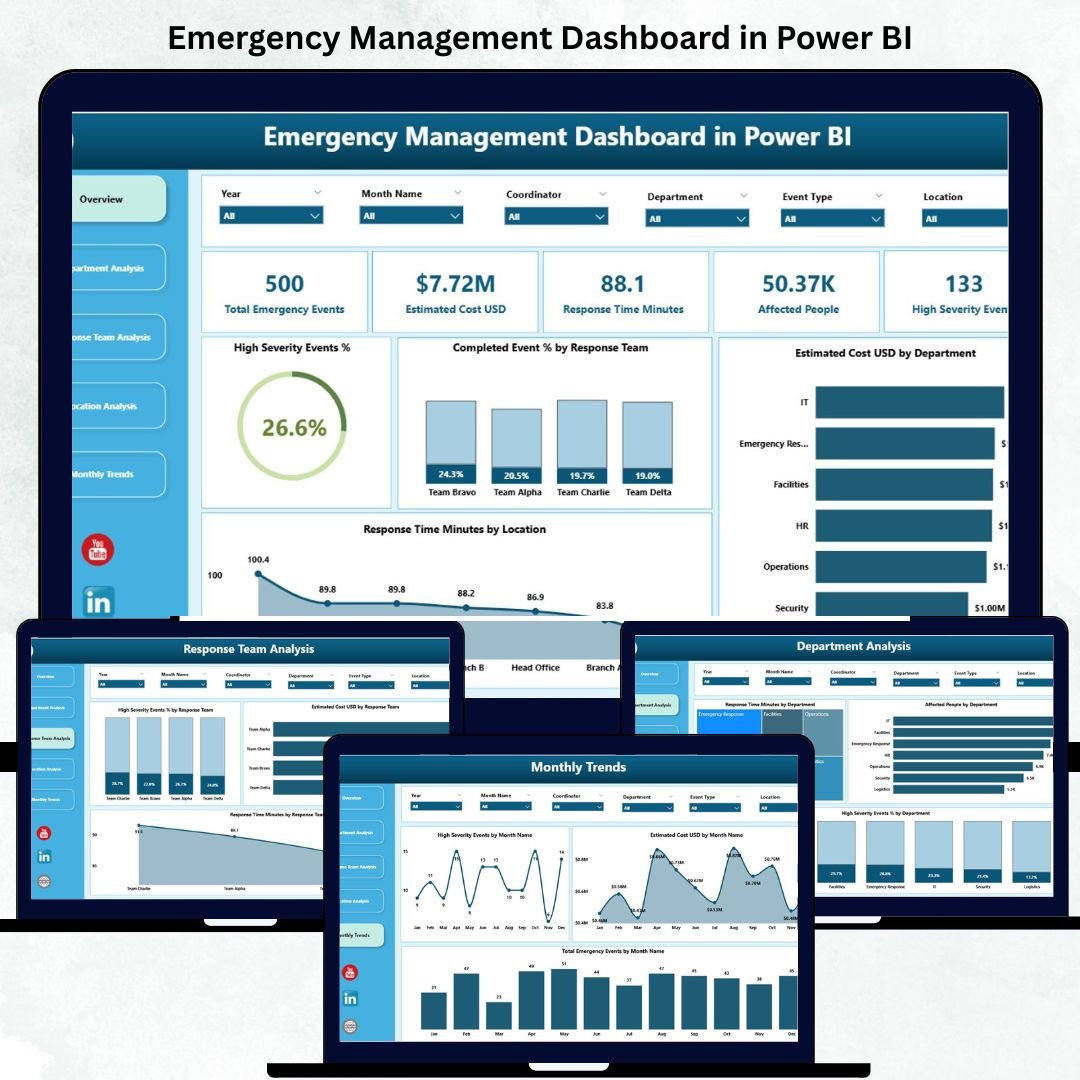
In critical moments, every second counts. The Emergency Management Dashboard in Power BI gives organizations the power to act faster, smarter, and with complete visibility during emergencies. Whether facing natural disasters, workplace accidents, public health crises, or system failures, this dashboard provides real-time insights that enhance coordination, efficiency, and response accuracy.
Built entirely in Microsoft Power BI, this ready-to-use solution transforms raw data into clear, actionable visuals. With interactive dashboards, automated KPIs, and drill-through analytics, it helps teams track emergencies, monitor costs, and improve response performance across departments and locations.
✨ Key Features of the Emergency Management Dashboard in Power BI
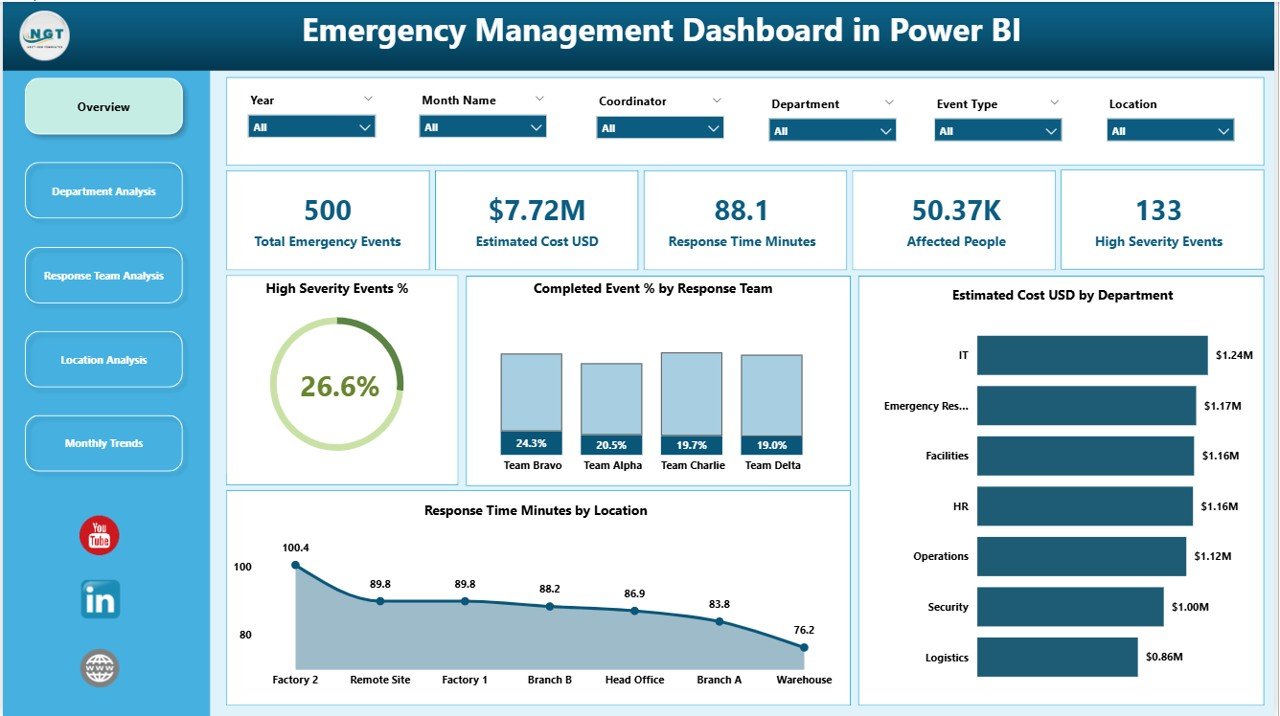
✅ 📊 Comprehensive Overview Page – Your command center for real-time awareness. View total emergency events, completion rates, severity levels, response times, and estimated costs at a glance. Charts like High Severity Event % by Team, Response Time by Location, and Cost by Department deliver instant clarity.
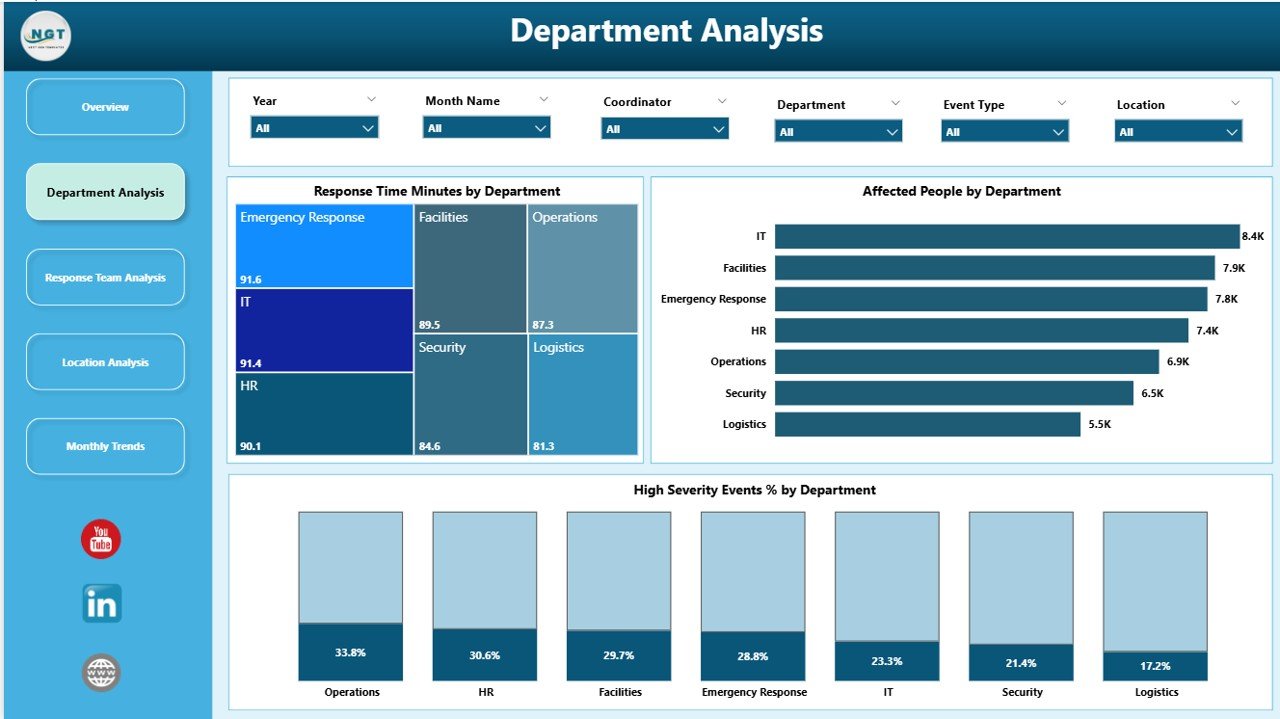
✅ 🏢 Department Analysis Page – Evaluate department-wise performance through visuals such as Response Time (Minutes), Affected People Count, and High Severity Event % by Department. Identify high-risk areas and plan targeted safety training or prevention measures.
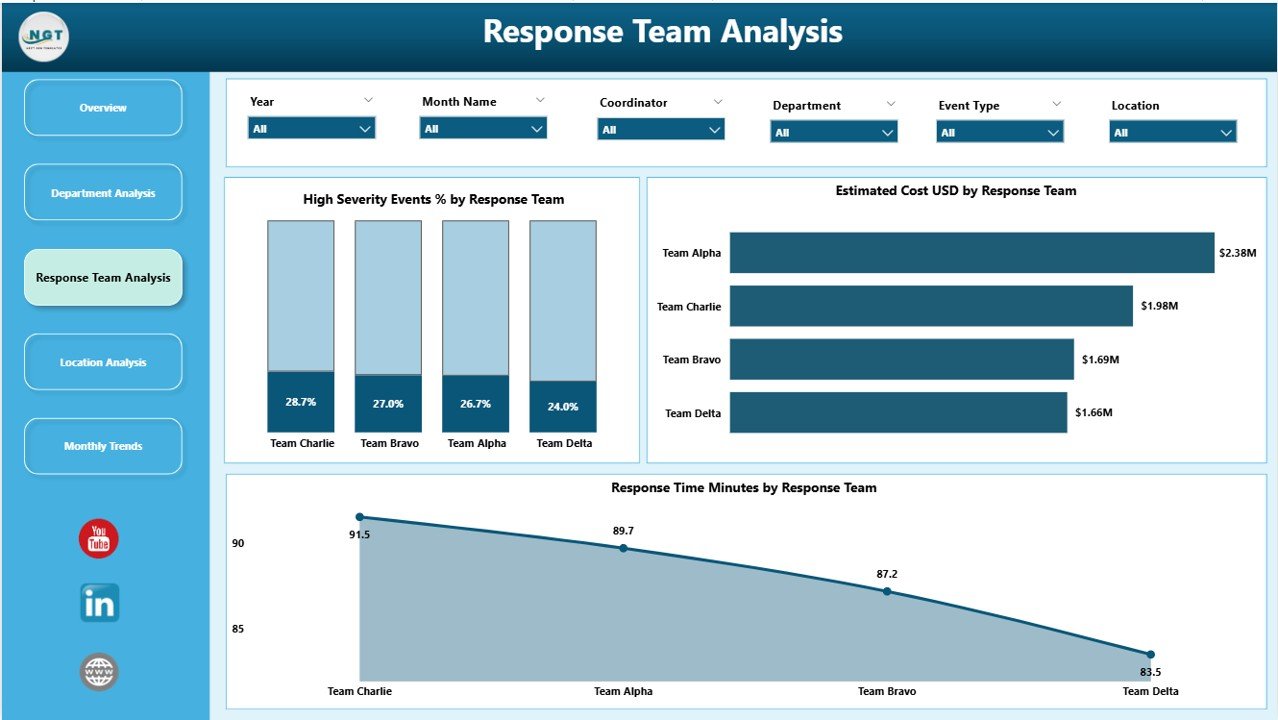
✅ 🚑 Response Team Analysis Page – Analyze how efficiently each response team performs under pressure. Visuals highlight Response Time, Completion %, and Severity %, helping managers balance workloads and improve team efficiency.
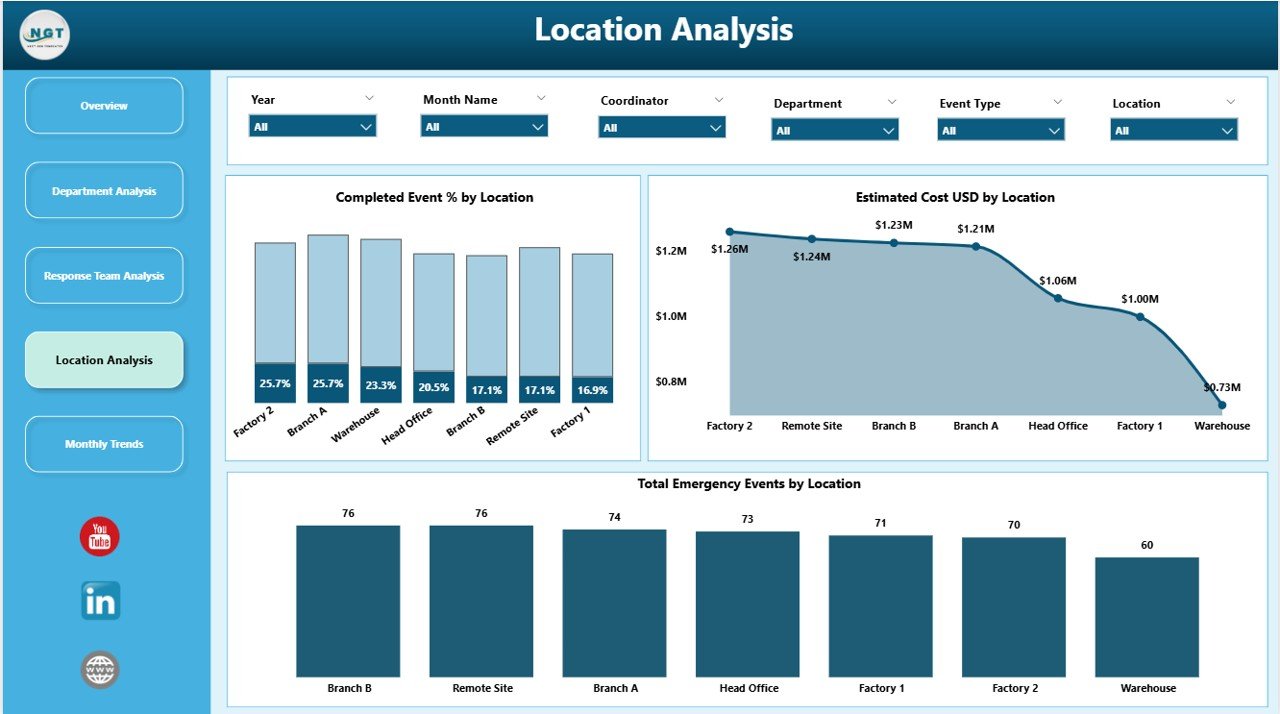
✅ 📍 Location Analysis Page – Compare performance and costs across sites. Visualize Completed Event %, Total Emergencies, and Estimated Cost by Location to prioritize high-risk branches.
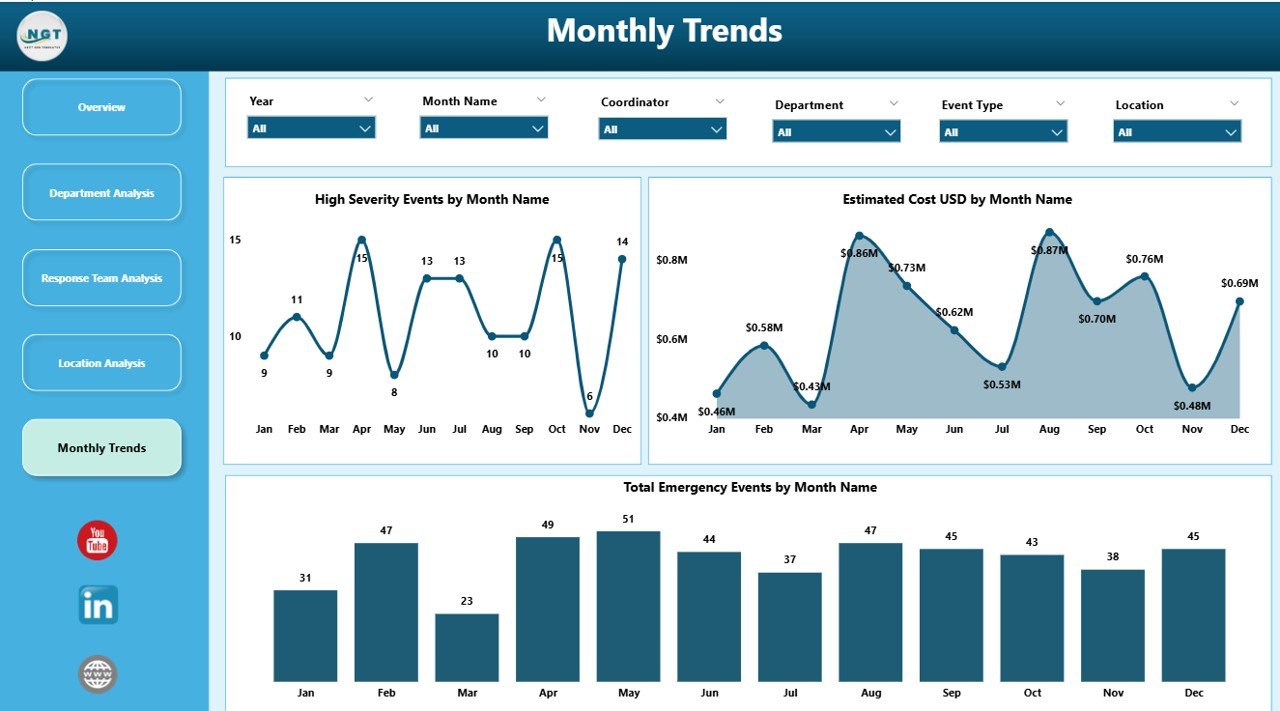
✅ 📅 Monthly Trends Page – Discover trends and seasonal patterns with charts showing High Severity Event % by Month, Cost by Month, and Total Events by Month — essential for proactive risk forecasting.
✅ ⚙️ Real-Time Data Updates – Automatically refresh data from Excel, SQL, or live sources for up-to-date visibility.
✅ 🔒 Secure and Scalable Design – Built with Row-Level Security (RLS) and cloud-based collaboration through Power BI Service.
✅ 📈 Dynamic Filtering and Drill-Down – Filter by department, response team, or location to explore data from every angle.
📦 What’s Inside the Emergency Management Dashboard
📁 5 Professional Analytical Pages:
1️⃣ Overview Page – Centralized summary of all key KPIs.
2️⃣ Department Analysis Page – Breakdown by departments and affected people.
3️⃣ Response Team Analysis Page – Evaluate team efficiency and accountability.
4️⃣ Location Analysis Page – Region-wise cost and performance comparison.
5️⃣ Monthly Trends Page – Historical and seasonal emergency trends.
📊 Built-in KPIs:
-
Total Emergency Events
-
High Severity Event %
-
Completed Event %
-
Average Response Time (Minutes)
-
Total Estimated Cost (USD)
-
Affected People Count
💡 Data Sources Supported:
-
Excel, SQL Server, SharePoint, or any structured dataset.
This professional Power BI template is designed with optimized visuals, conditional formatting, and predefined DAX measures, ensuring you get powerful insights immediately after importing your data.
⚙️ How to Use the Emergency Management Dashboard
1️⃣ Connect Data Sources: Import your emergency data (event date, department, cost, severity, etc.) into Power BI.
2️⃣ Load and Refresh Data: Power BI automatically updates visuals with each data refresh.
3️⃣ Explore Pages: Navigate between Overview, Department, and Location analyses using page tabs.
4️⃣ Apply Filters: Use slicers to filter data by month, department, or response team.
5️⃣ Analyze KPIs: Monitor live metrics for response time, costs, and severity distribution.
6️⃣ Share Insights: Publish to Power BI Service for real-time collaboration with your crisis teams.
💡 Tip: Set up scheduled data refreshes in Power BI Service for continuous real-time updates during emergencies.
👥 Who Can Benefit from This Dashboard
🏥 Hospitals & Healthcare Organizations – Track patient emergencies, response efficiency, and cost per incident.
🏭 Manufacturing Units – Monitor workplace accidents and machinery breakdowns.
🏛️ Government & Public Agencies – Manage disaster response and community safety programs.
✈️ Transportation & Logistics Companies – Handle incidents, accidents, and route disruptions.
⚡ Energy & Utilities Firms – Monitor plant-level emergencies and downtime.
🏫 Educational Institutions – Improve safety compliance and campus emergency tracking.
💼 Corporate Offices – Centralize safety, compliance, and incident management operations.
With this Power BI dashboard, every organization can enhance preparedness, reduce response time, and optimize resources — ensuring quick, informed, and coordinated action.
🔗 Click here to read the Detailed Blog Post
🎥 Visit our YouTube channel to learn step-by-step video tutorials
Watch the step-by-step video tutorial:


Reviews
There are no reviews yet.