


Managing electricity projects without a structured performance system often results in delays, cost overruns, and unclear reporting. That is exactly why the Electricity Project KPI Dashboard in Excel is a must-have solution for modern project teams. This professionally designed Excel dashboard converts complex electricity project data into clear, visual, and actionable insights—all in one centralized file.
Built using standard Excel features, this dashboard helps you track KPIs, compare targets vs actuals, analyze trends, and make faster, data-driven decisions without relying on expensive BI tools. Whether you manage power infrastructure, electrical execution projects, or energy operations, this dashboard gives you complete visibility and control.
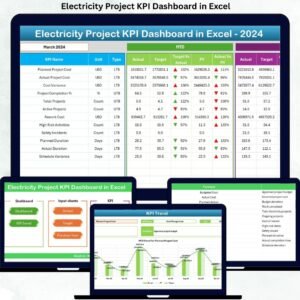
🚀 Key Features of Electricity Project KPI Dashboard in Excel
⚡ Centralized KPI Monitoring – Track all electricity project KPIs in one structured Excel dashboard instead of multiple scattered spreadsheets.
📊 MTD & YTD Performance Tracking – Monitor Month-to-Date and Year-to-Date performance with actuals, targets, and previous-year comparisons.
🎯 Target vs Actual Analysis – Instantly identify performance gaps using automated percentage calculations and visual indicators.
📉 Previous Year Comparison – Compare current performance with historical data to understand growth, decline, and trends.
📈 Trend Analysis with Charts – Analyze KPI movement over time using dynamic MTD and YTD trend charts.
🟢 Visual Performance Indicators – Conditional formatting with arrows and colors highlights over-performance and under-performance instantly.
🧩 Fully Customizable Structure – Easily add new KPIs, modify targets, and adapt the dashboard to different electricity project needs.\

📂 What’s Inside the Electricity Project KPI Dashboard
This Excel dashboard is designed with 7 structured worksheets, each serving a specific purpose:
📌 Summary Page – Acts as the dashboard index with navigation buttons for quick access to all sheets.
📌 Dashboard Sheet – Displays all KPIs in a single view with month selection and automated updates.
📌 Trend Sheet – Shows KPI definitions, formulas, and MTD/YTD trend charts for deeper analysis.
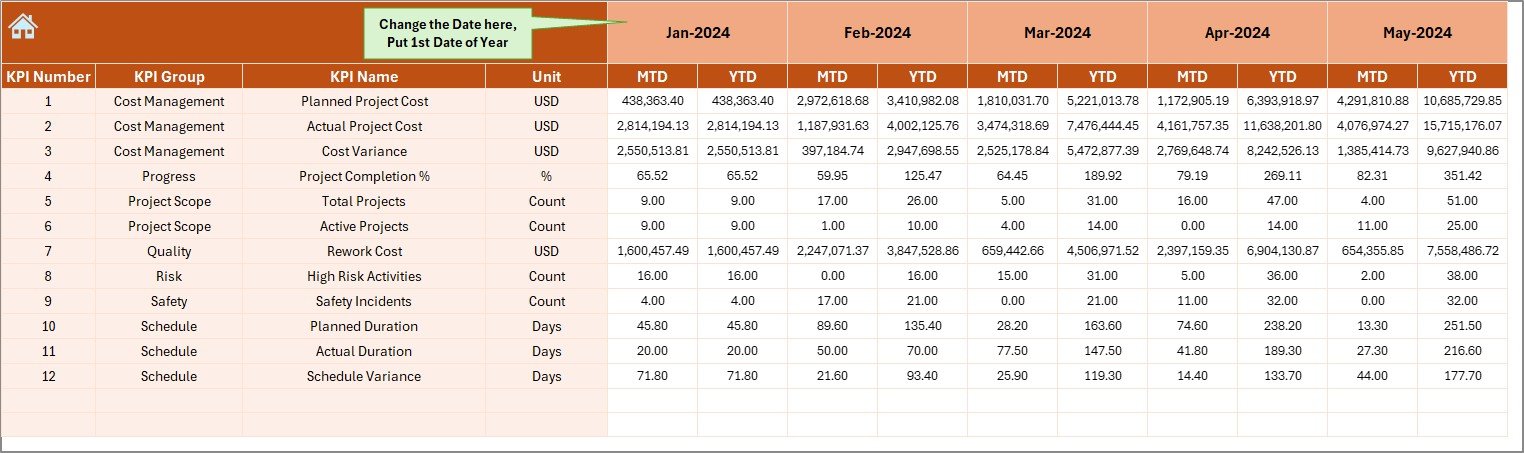
📌 Actual Numbers Input Sheet – Allows controlled entry of actual MTD and YTD performance data.
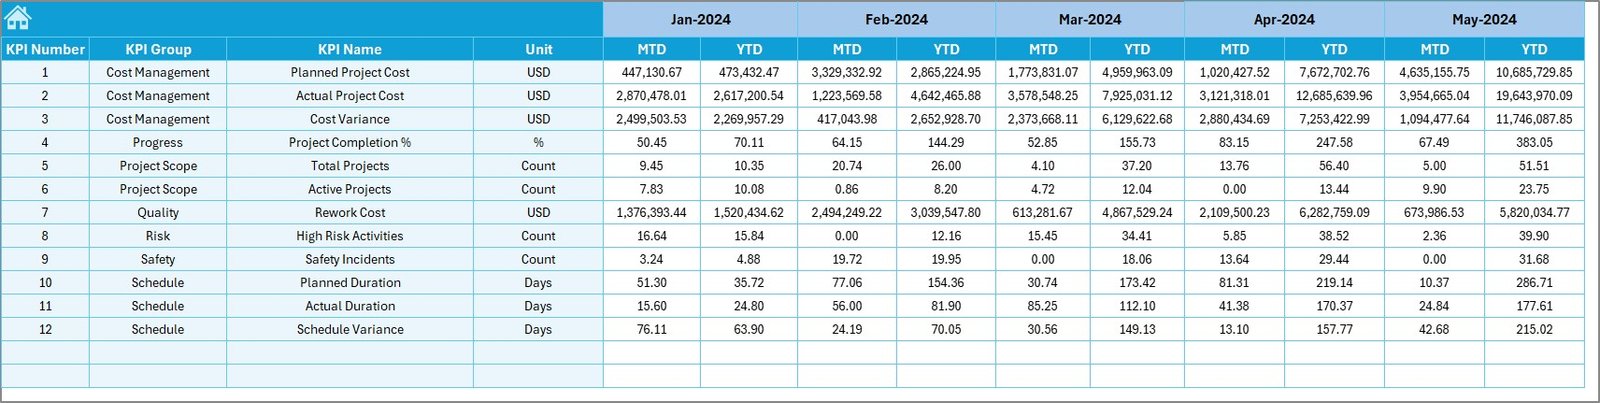
📌 Target Sheet – Stores monthly and yearly target values for accurate benchmarking.
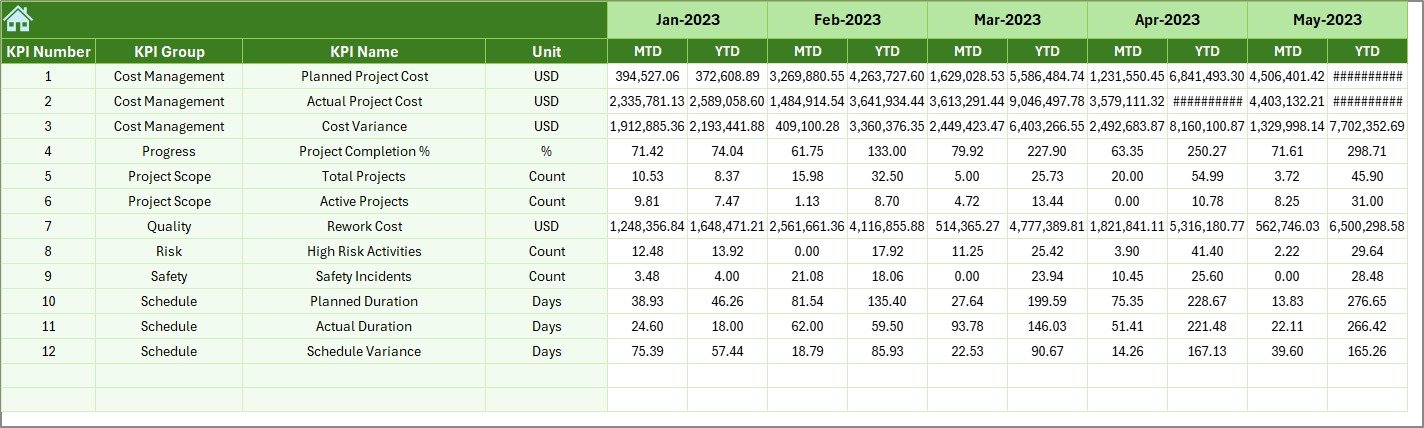
📌 Previous Year Number Sheet – Captures historical data for year-over-year comparison.
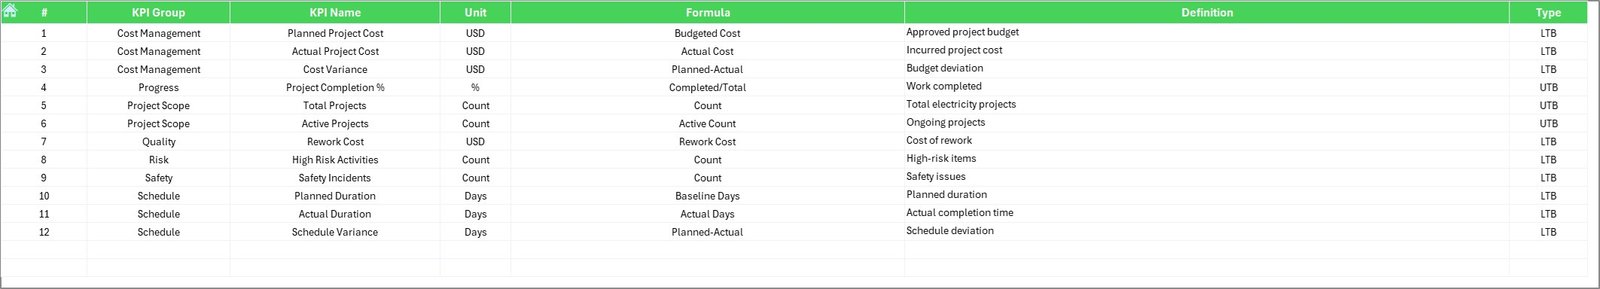
📌 KPI Definition Sheet – Documents KPI names, units, formulas, and definitions for clarity and consistency.
This structure ensures smooth data flow, transparency, and ease of use.
🛠️ How to Use the Electricity Project KPI Dashboard
Using this dashboard is simple and intuitive:
1️⃣ Enter actual project performance data in the Actual Numbers Input Sheet
2️⃣ Update planned values in the Target Sheet
3️⃣ Maintain historical data in the Previous Year Number Sheet
4️⃣ Select the required month from the dropdown
5️⃣ Instantly view updated KPIs, trends, and comparisons on the Dashboard Sheet
No macros, no VBA, and no advanced Excel skills required.
👥 Who Can Benefit from This Electricity Project KPI Dashboard?
This dashboard is ideal for:
👷 Project Managers – Track progress, delays, and budget performance
⚡ Electrical Engineers – Monitor operational and efficiency KPIs
📊 Operations Teams – Gain real-time performance visibility
💰 Finance Teams – Analyze cost variance and financial KPIs
🏢 Senior Management – Make strategic decisions with confidence
📋 Compliance & Audit Teams – Ensure performance transparency and documentation
Because of its flexibility, this dashboard adapts to small projects as well as large-scale electricity programs.
Click here to read the Detailed blog post
Visit our YouTube channel to learn step-by-step video tutorials:


Reviews
There are no reviews yet.