Managing electricity procurement without a clear performance framework often results in rising costs, missed savings opportunities, and reactive decision-making. That is exactly why organizations across manufacturing, utilities, facilities management, and infrastructure rely on the Electricity Procurement KPI Dashboard in Excel to gain complete visibility and control over electricity purchasing performance.
This professionally designed Excel dashboard converts complex procurement data into clear, actionable, and visual insights—without requiring expensive BI tools or advanced technical skills. If you want to track costs, compare targets, analyze trends, and improve procurement efficiency, this dashboard is built for you.
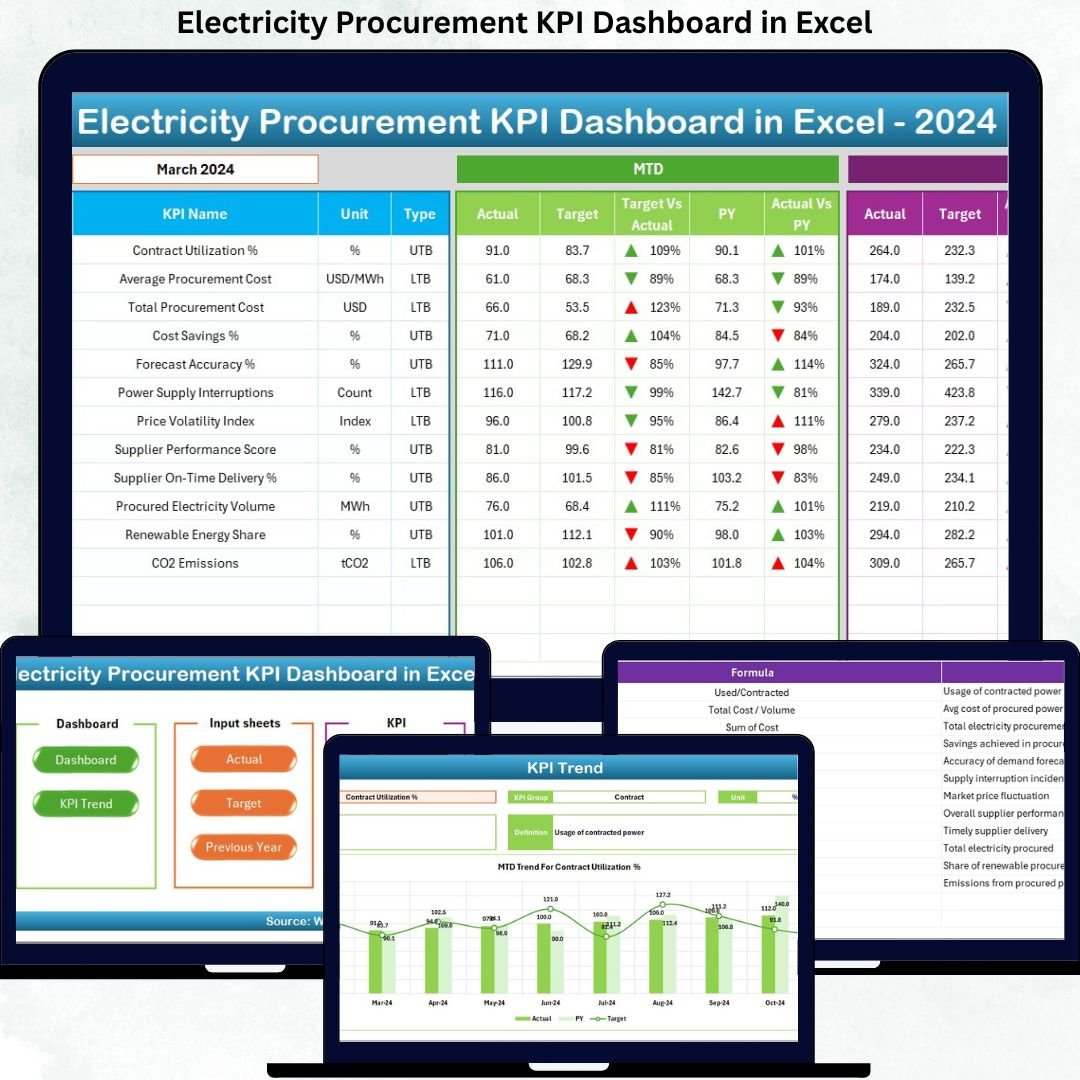
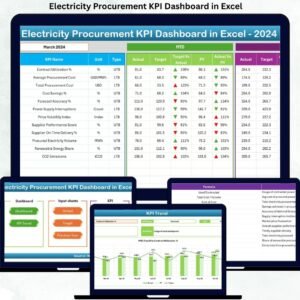
🚀 Key Features of Electricity Procurement KPI Dashboard in Excel
⚡ Centralized KPI Monitoring – Track all electricity procurement KPIs in one structured Excel file instead of managing scattered spreadsheets.
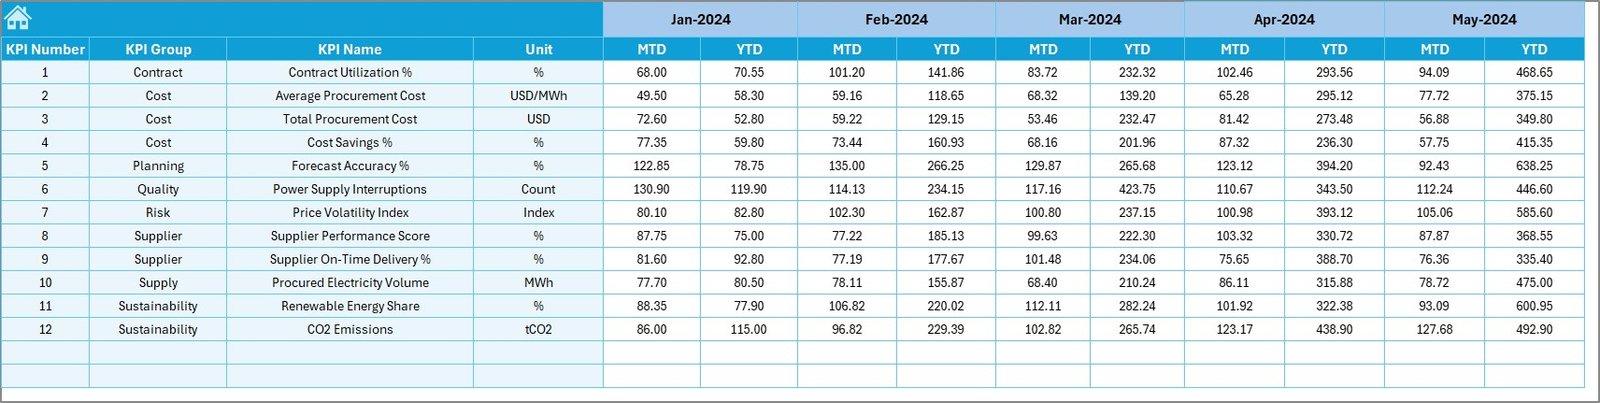
📊 MTD & YTD Performance Tracking – Monitor Month-to-Date and Year-to-Date actuals, targets, and previous-year values in a single view.
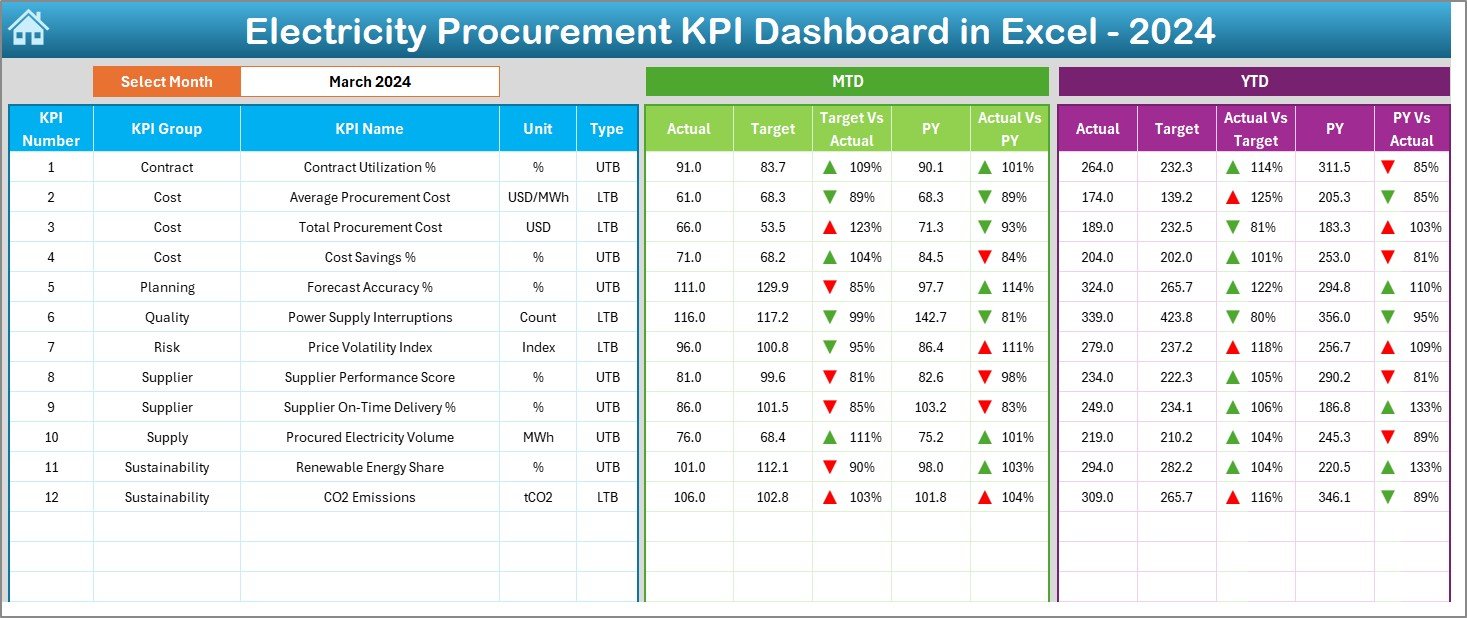
🎯 Target vs Actual Comparison – Instantly identify overspending and performance gaps with automated variance calculations.
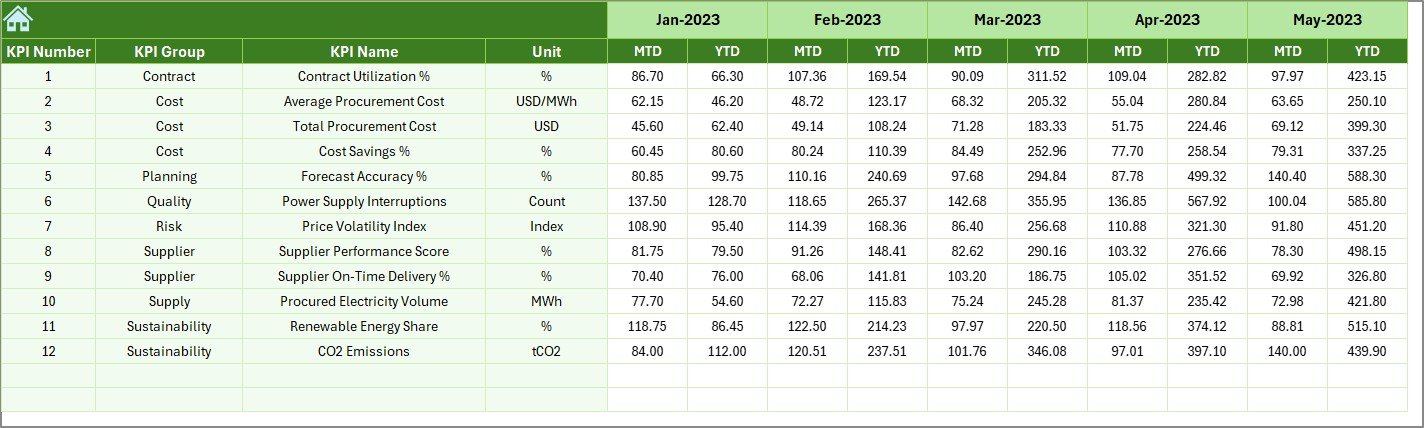
📉 Previous Year Comparison – Analyze year-over-year trends to understand long-term cost behavior and procurement efficiency.
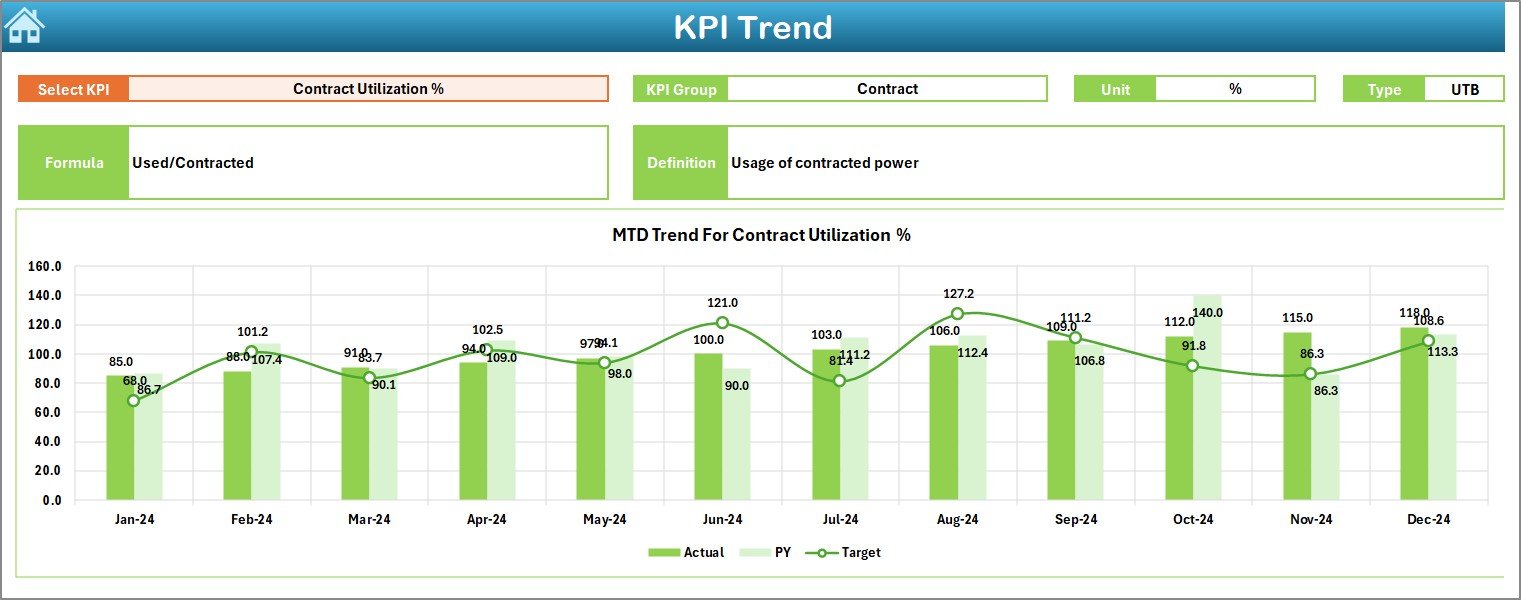
📈 Interactive Trend Analysis – Visual trend charts help you identify patterns, improvements, and recurring issues quickly.
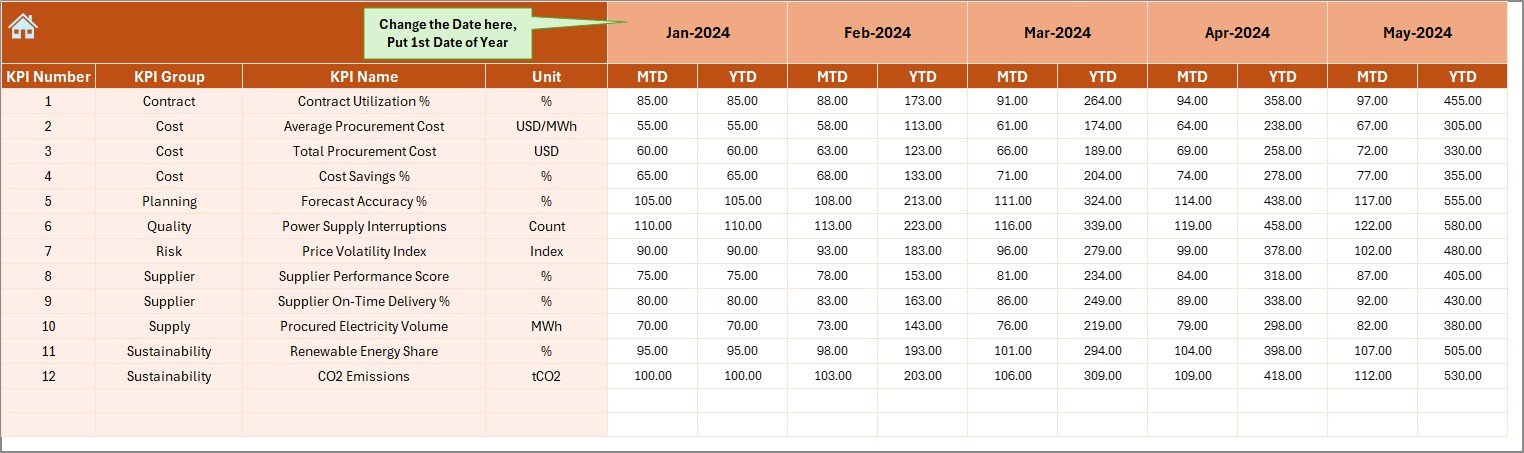
🔄 Dynamic Month Selection – Change the month using a simple dropdown, and the entire dashboard updates automatically.
🧭 User-Friendly Navigation – A dedicated summary page with navigation buttons makes the dashboard easy to use, even for non-technical users.
📂 What’s Inside the Electricity Procurement KPI Dashboard in Excel
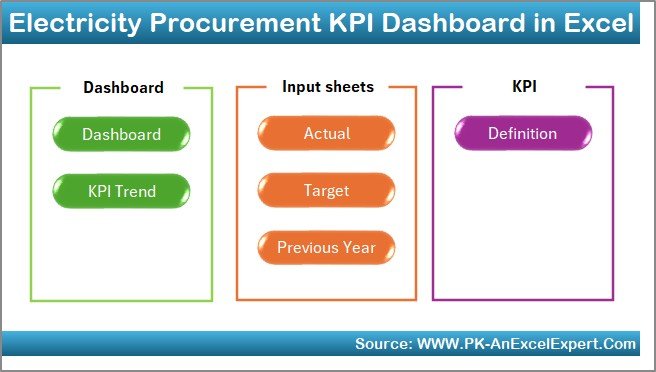
This dashboard is built with 7 structured worksheets, each serving a specific purpose:
📌 Summary Page – An index sheet with navigation buttons to jump to any worksheet instantly.
📌 Dashboard Sheet – The main visual dashboard displaying all KPIs with MTD and YTD actuals, targets, previous-year values, and variance indicators.
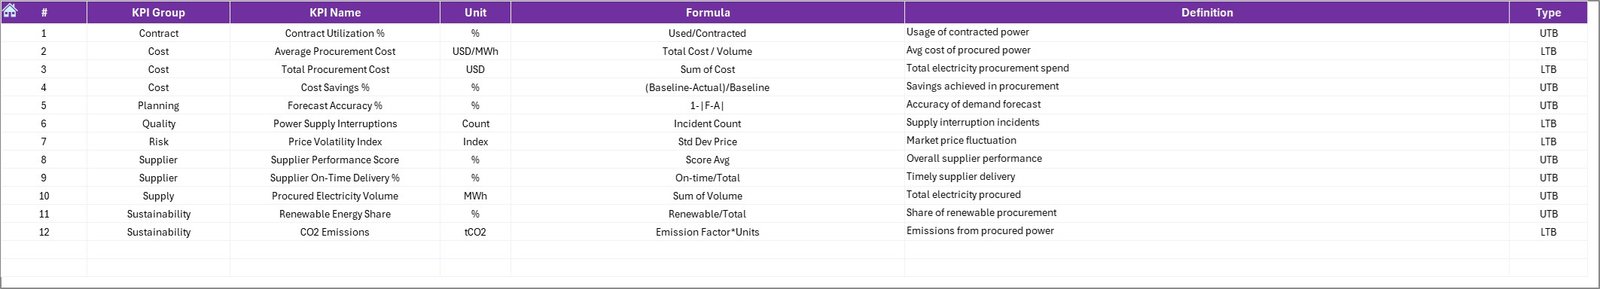
📌 Trend Sheet – Detailed KPI-level analysis with trend charts, KPI definitions, formulas, units, and performance type (UTB / LTB).
📌 Actual Numbers Input Sheet – A clean data entry sheet where users input monthly and yearly actual procurement values.
📌 Target Sheet – Defines monthly and YTD performance targets for each KPI.
📌 Previous Year Sheet – Stores historical MTD and YTD values for meaningful year-over-year comparison.
📌 KPI Definition Sheet – Acts as a knowledge base with KPI names, groups, formulas, units, and explanations.
🛠️ How to Use the Electricity Procurement KPI Dashboard in Excel
Using this dashboard is simple and intuitive:
1️⃣ Enter your monthly actual procurement data in the Actual Numbers sheet.
2️⃣ Define targets in the Target sheet.
3️⃣ Add previous-year values for comparison.
4️⃣ Select the desired month from the dropdown.
5️⃣ Instantly view MTD & YTD performance, trends, and variances on the dashboard.
No complex setup. No advanced Excel skills required.
👥 Who Can Benefit from This Electricity Procurement KPI Dashboard
This dashboard is ideal for:
🏭 Manufacturing Plants – Track electricity cost per unit and control production expenses.
🏢 Facility & Energy Managers – Monitor consumption trends and optimize electricity contracts.
💼 Procurement Teams – Improve supplier negotiations using data-driven insights.
📊 Finance Teams – Align electricity spending with budgets and financial goals.
🏗️ Infrastructure & Utility Projects – Control large-scale electricity procurement efficiently.
Whether you are managing a single facility or multiple locations, this dashboard adapts to your needs.
Click here to read the Detailed blog post
Watch the step-by-step video tutorial:
Visit our YouTube channel to learn step-by-step video tutorials
https://youtube.com/@PKAnExcelExpert


Reviews
There are no reviews yet.