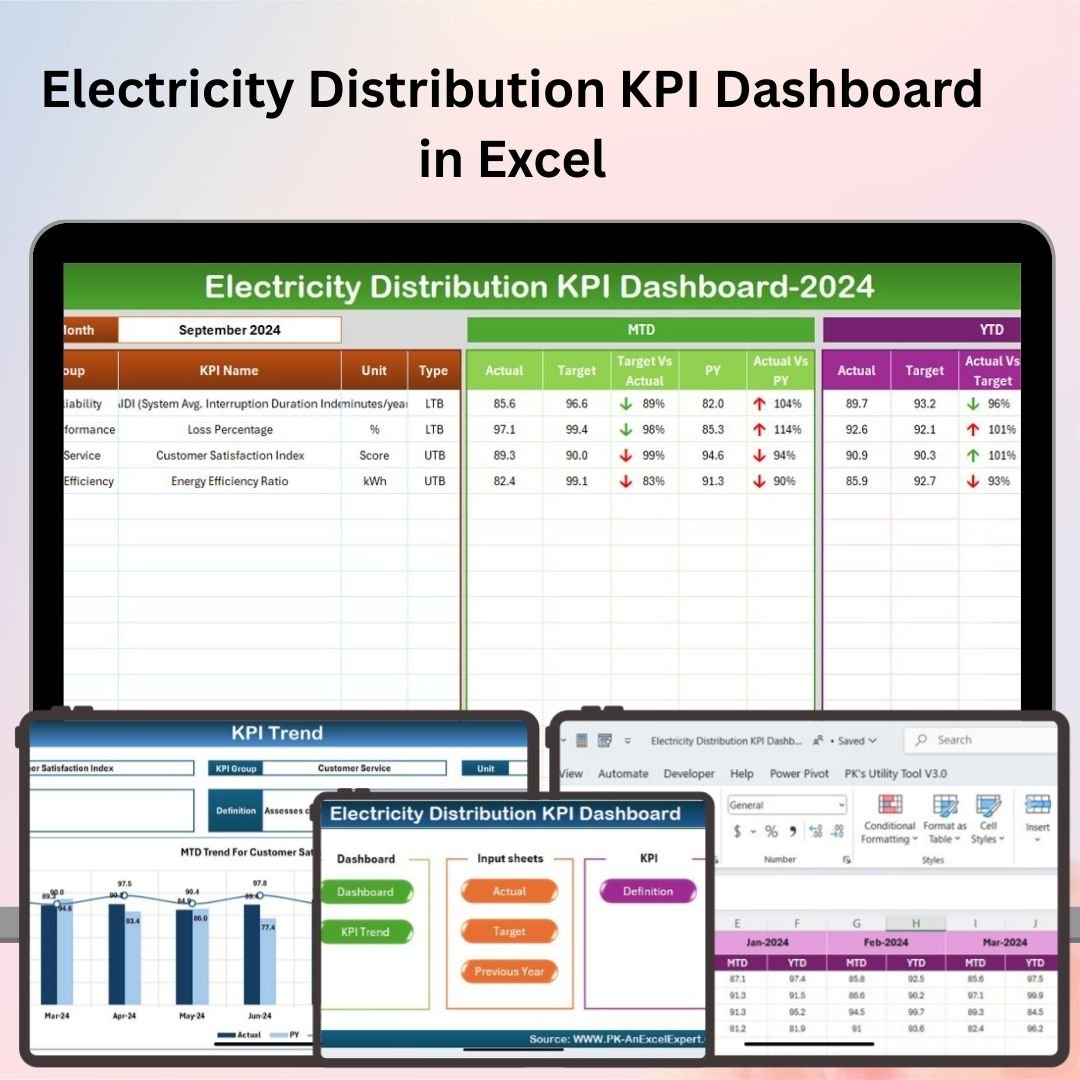

The Electricity Distribution KPI Dashboard in Excel is a powerful tool designed for utility companies, energy managers, and distribution teams to track and monitor the performance of electricity distribution networks. This Excel-based dashboard allows you to measure key performance indicators (KPIs) such as energy distribution efficiency, outage management, grid reliability, and operational costs, enabling you to optimize energy delivery and improve system performance.
With customizable features, real-time tracking, and easy-to-read visualizations, this dashboard helps energy managers and utility companies ensure reliable service delivery, reduce operational inefficiencies, and enhance customer satisfaction.
Key Features of the Electricity Distribution KPI Dashboard in Excel:
⚡ Energy Distribution Efficiency
Monitor the efficiency of electricity distribution across regions and networks, ensuring that energy is being delivered optimally and with minimal loss.
🌍 Outage Management and Response
Track outages, downtime, and response times, ensuring that issues are resolved promptly and that service interruptions are minimized.
📊 Grid Reliability and Performance
Measure the reliability of the electricity grid, including voltage levels, system capacity, and operational performance, to maintain system stability.
💰 Operational Cost Tracking
Track operational costs such as energy production, distribution, maintenance, and infrastructure, ensuring that the electricity distribution network remains financially sustainable.
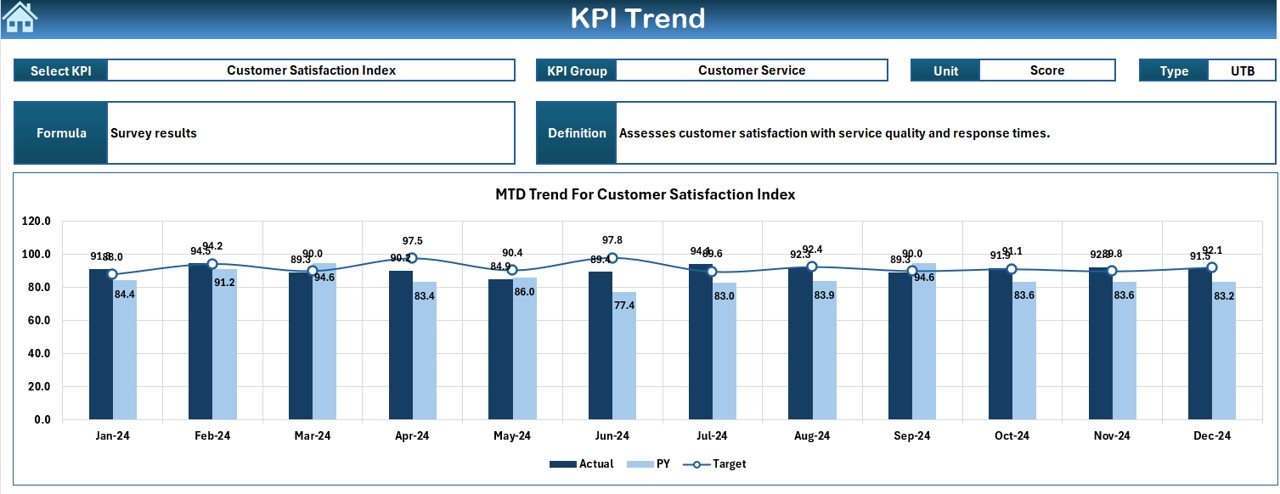
📈 Customer Satisfaction and Service Quality
Monitor customer satisfaction levels, including service interruptions, billing issues, and complaint resolution, to ensure high service quality.
🚀 Why You’ll Love the Electricity Distribution KPI Dashboard in Excel:
✅ Monitor Energy Distribution Efficiency – Track energy loss, grid performance, and distribution efficiency to ensure reliable electricity delivery across your network.
✅ Optimize Outage Management – Monitor outages, downtime, and service restoration times to ensure that issues are quickly identified and resolved, reducing service interruptions.
✅ Improve Grid Performance – Track grid reliability, voltage levels, and operational performance to ensure that your infrastructure is meeting system demands.
✅ Control Operational Costs – Monitor and manage the costs associated with energy distribution, infrastructure, and maintenance, helping you stay within budget.
✅ Enhance Customer Satisfaction – Track customer satisfaction, service complaints, and service issues to ensure that your electricity distribution network is providing high-quality service.
✅ Fully Customizable and Interactive – Fully customizable to fit your energy distribution network’s specific needs, with interactive visualizations and real-time tracking for better decision-making.
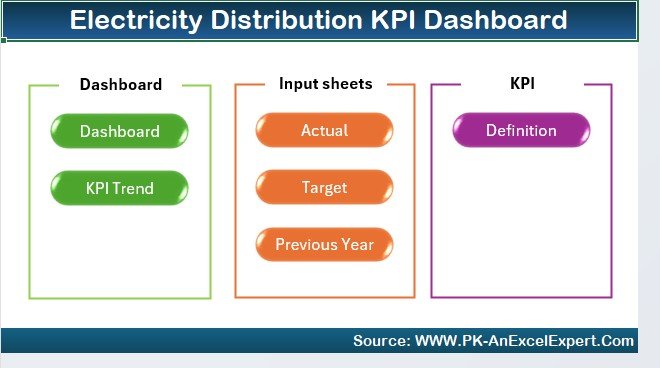
What’s Inside the Electricity Distribution KPI Dashboard in Excel:
-
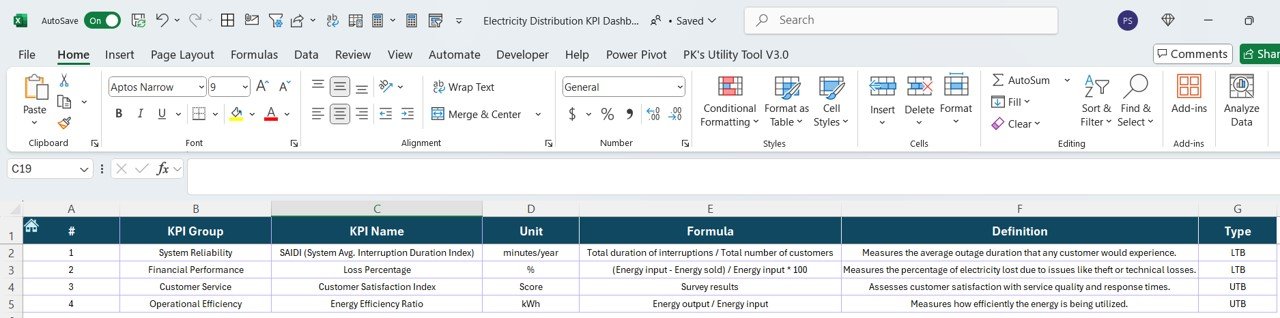
Energy Distribution Efficiency: Track energy consumption and loss across different regions to ensure efficient electricity delivery and minimize wastage.
-
Outage Management: Monitor service interruptions, track downtime, and ensure fast response times to minimize the impact of outages on customers.
-
Grid Reliability: Track key metrics such as grid stability, voltage fluctuations, and system capacity to ensure grid reliability.
-
Operational Costs: Monitor expenses related to energy production, maintenance, infrastructure, and distribution to ensure that the network remains financially sustainable.
-
Customer Service and Satisfaction: Track customer complaints, service issues, and satisfaction levels to ensure that your distribution network is meeting customer expectations.
-
Custom Reports: Generate tailored reports summarizing key KPIs, grid performance, outage management, and operational costs to help inform decisions and improve efficiency.
How to Use the Electricity Distribution KPI Dashboard in Excel:
1️⃣ Download the Template – Instantly access your Excel file upon purchase.
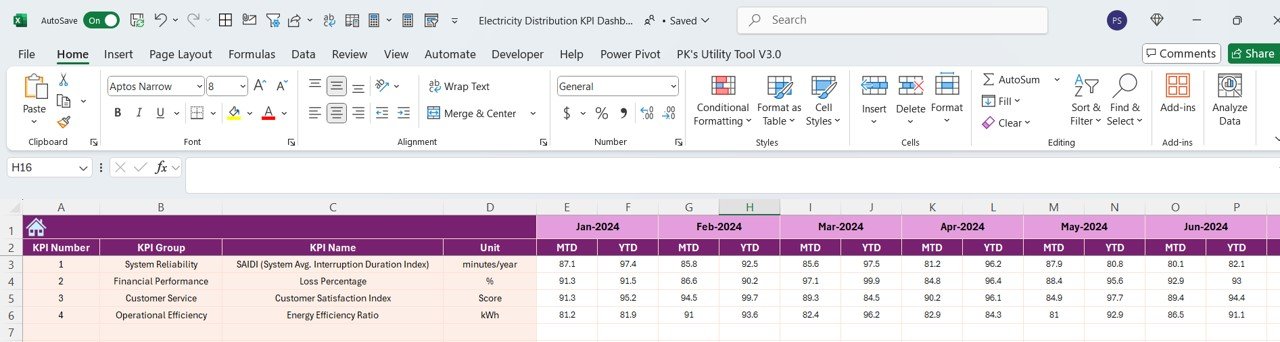
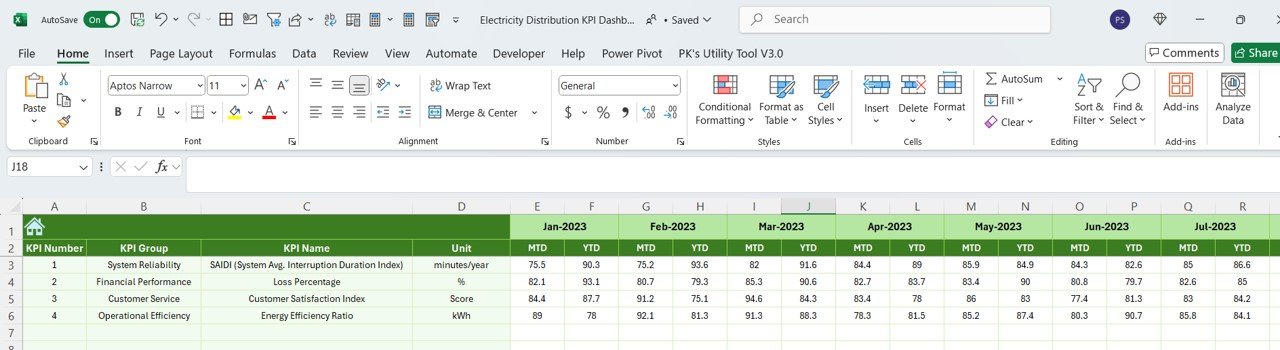
2️⃣ Enter Data for Distribution and Performance – Add data related to energy consumption, outages, costs, and customer feedback to start tracking KPIs.
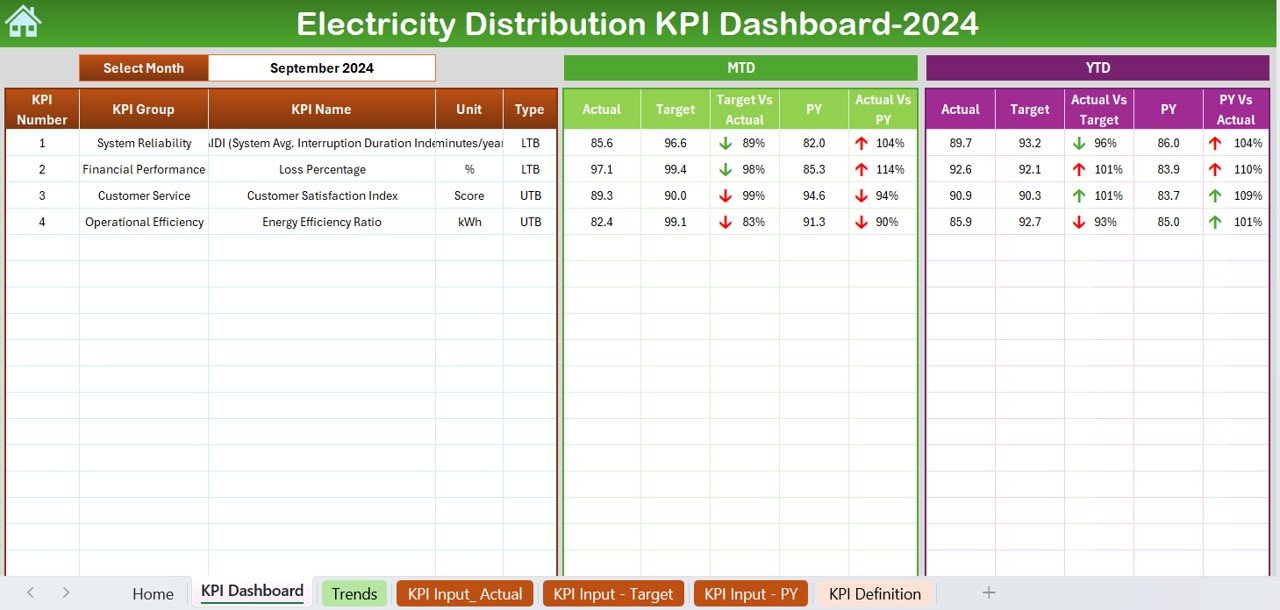
3️⃣ Monitor Key Metrics – Use the dashboard to monitor energy distribution efficiency, outage management, grid performance, and operational costs in real-time.
4️⃣ Analyze Trends – Track trends in outages, grid performance, and customer satisfaction to make data-driven improvements to your network.
5️⃣ Generate Reports – Create detailed reports summarizing grid performance, operational costs, and customer satisfaction to help guide future decisions and strategies.
Who Can Benefit from the Electricity Distribution KPI Dashboard in Excel:
-
Energy Managers
-
Utility and Distribution Companies
-
Infrastructure and Operations Teams
-
Maintenance and Repair Teams
-
Financial Managers in Energy Sector
-
Customer Service Teams
-
Government and Regulatory Agencies
-
Small to Large Energy Providers
The Electricity Distribution KPI Dashboard in Excel is the perfect tool for energy providers looking to optimize their electricity distribution network, track key performance indicators, and ensure reliable service delivery. With features that monitor outages, operational costs, and customer satisfaction, this dashboard provides a comprehensive view of your network’s performance, enabling better decision-making and operational efficiency.
Click here to read the Detailed blog post
https://www.pk-anexcelexpert.com/electricity-distribution-kpi-dashboard-in-excel/
Visit our YouTube channel to learn step-by-step video tutorials
Youtube.com/@PKAnExcelExpert


Reviews
There are no reviews yet.