


The electric vehicle (EV) revolution is accelerating faster than ever. Charging stations are expanding across cities, highways, offices, residential complexes, and fleet hubs. However, as EV charging networks grow, many operators still rely on scattered spreadsheets and manual reports. As a result, utilization drops go unnoticed, downtime increases, revenue leaks occur, and decisions become reactive.
That is exactly why the Electric Vehicle Charging KPI Dashboard in Excel becomes an essential performance management tool 🚀.
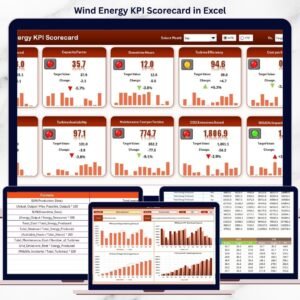
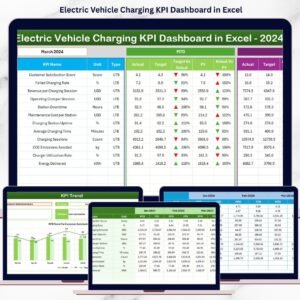
This ready-to-use Excel dashboard converts raw EV charging data into clear KPIs, automated comparisons, and powerful trend insights. Instead of guessing performance, operators gain complete visibility into utilization, energy delivery, downtime, revenue, and efficiency—all in one Excel file.
Whether you manage a single charging site or a multi-location EV charging network, this dashboard helps you track performance, reduce downtime, improve customer experience, and scale operations with confidence—without expensive software or technical complexity.
Key Features of Electric Vehicle Charging KPI Dashboard in Excel
⚡ Centralized EV Charging KPI Tracking
Monitor all charging KPIs in one structured Excel dashboard.
📊 MTD & YTD Performance Analysis
Track short-term and long-term performance with automated calculations.
🎯 Target vs Actual Comparison
Instantly identify performance gaps and achievements.
📈 Trend Analysis for Smarter Decisions
Understand utilization, revenue, and efficiency trends over time.
🔍 Visual Performance Indicators
Green ▲ and Red ▼ arrows highlight success or issues instantly.
🧭 Easy Navigation with Home Sheet
Move between sheets using one-click navigation buttons.
⚙️ 100% Excel-Based & Customizable
No Power BI, no coding, no advanced skills required.
What’s Inside the Electric Vehicle Charging KPI Dashboard in Excel
🏠 Home Sheet – Smart Navigation Hub

The Home Sheet acts as the index of the dashboard.
🔹 Six navigation buttons
🔹 One-click access to all worksheets
🔹 Clean, presentation-ready layout
This makes the dashboard easy to use for operators, managers, and executives.
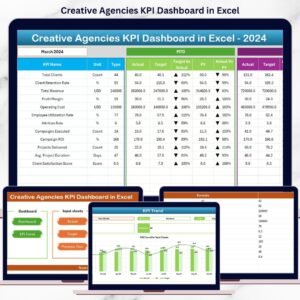
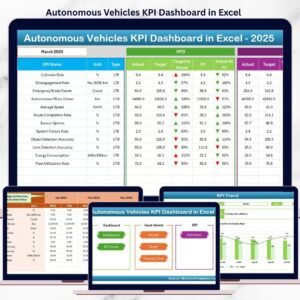
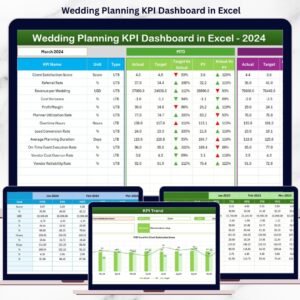
📊 Dashboard Sheet – Complete KPI Overview
The Dashboard Sheet is the core analysis page.
📅 Month Selection (Cell D3)
Select any month from the drop-down. The entire dashboard updates instantly.
📌 Month-to-Date (MTD) Metrics
-
MTD Actual
-
MTD Target
-
MTD Previous Year
-
Target vs Actual (%)
-
PY vs Actual (%)
-
▲ / ▼ Performance Indicators
📌 Year-to-Date (YTD) Metrics
-
YTD Actual
-
YTD Target
-
YTD Previous Year
-
Target vs Actual (%)
-
PY vs Actual (%)
-
▲ / ▼ Performance Indicators
This layout allows you to spot underperformance immediately—without manual analysis.
📈 KPI Trend Sheet – Deep Performance Insights
The KPI Trend Sheet supports detailed KPI-level analysis.
🎯 KPI Selection (Cell C3)
Choose any KPI from the drop-down list.
📊 Displayed KPI Details
-
KPI Group
-
Unit of Measurement
-
KPI Type (Upper the Better / Lower the Better)
-
KPI Formula
-
KPI Definition
📈 Trend Charts
-
MTD Trend: Actual vs Target vs Previous Year
-
YTD Trend: Actual vs Target vs Previous Year
These visuals help you identify long-term growth, seasonal behavior, and operational risks.
🧮 Actual Numbers Input Sheet – Enter Real Performance
This sheet captures current-year EV charging data.
✔ Enter MTD Actual values
✔ Enter YTD Actual values
✔ Control reporting year using Cell E1
All calculations and visuals update automatically.
🎯 Target Sheet – Define Performance Goals
The Target Sheet stores KPI targets.
✔ MTD Target values
✔ YTD Target values
This ensures accurate target tracking and performance evaluation.
📅 Previous Year Number Sheet – Year-over-Year Analysis
This sheet stores previous-year KPI values.
✔ PY MTD values
✔ PY YTD values
The dashboard automatically calculates growth, decline, and efficiency improvement.
📘 KPI Definition Sheet – KPI Clarity & Governance
The KPI Definition Sheet ensures consistency across teams.
Includes:
-
KPI Name
-
KPI Group
-
Unit
-
Formula
-
Definition
This prevents confusion and supports standardized performance reporting.
How to Use the Electric Vehicle Charging KPI Dashboard in Excel
📝 Enter actual, target, and previous-year data
📅 Select reporting month
📊 Review arrows and percentages
📈 Analyze trends
🎯 Take corrective action
No advanced Excel skills required.
👥 Who Can Benefit from This Dashboard
🔌 EV charging station operators
🏢 Infrastructure & facility managers
⚡ Energy and utility companies
🚗 Fleet charging operators
📊 Strategy & finance teams
💼 Business owners and executives
🔍 Click here to read the Detailed blog post
📺 Visit our YouTube channel to learn step-by-step video tutorials
👉 Youtube.com/@PKAnExcelExpert


Reviews
There are no reviews yet.