Educational institutions generate enormous volumes of data every day — from student enrollment and academic performance to financial results and institutional efficiency. However, many schools, universities, and training organizations still rely on manual reporting and disconnected spreadsheets, making decision-making slow and inefficient.
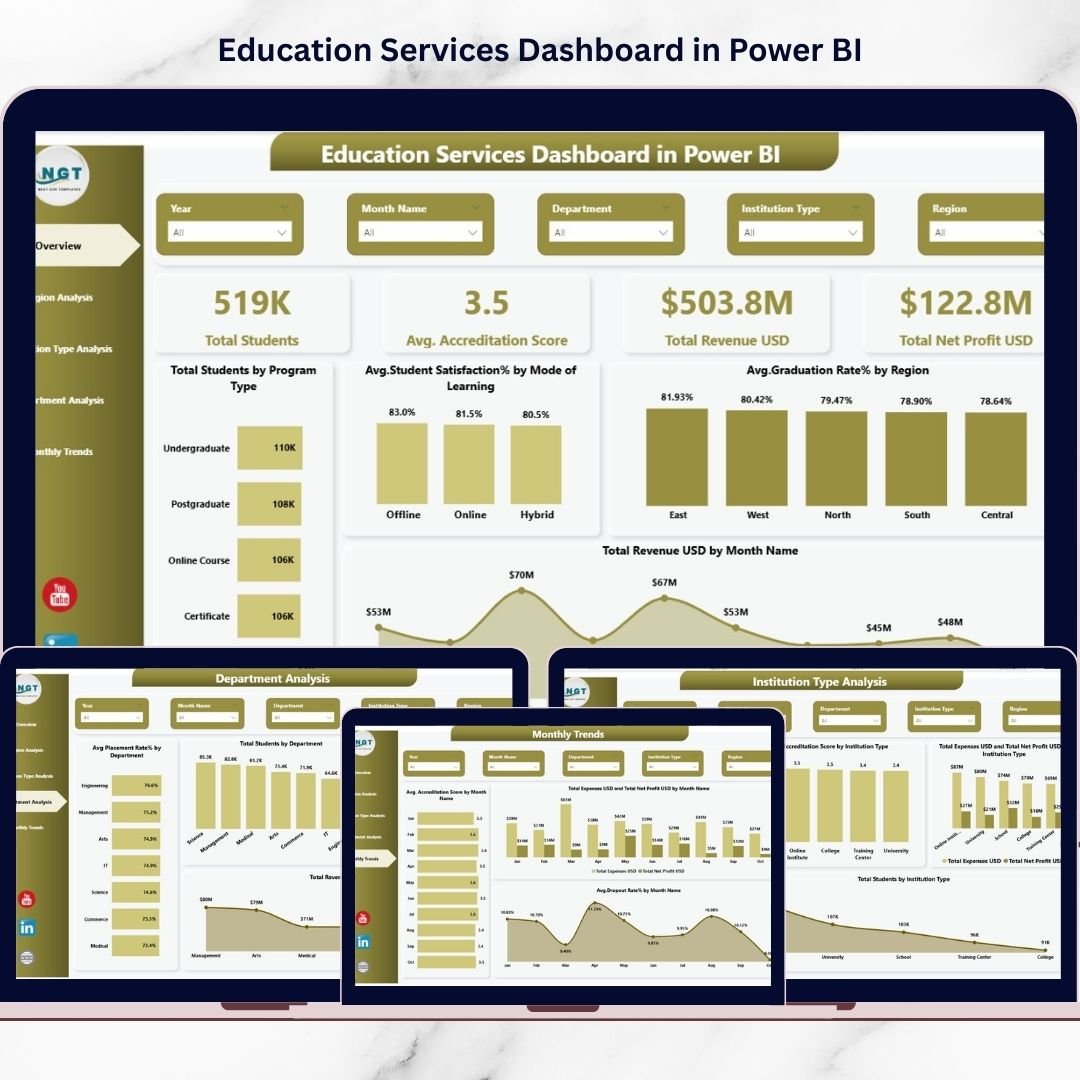
The Education Services Dashboard in Power BI is a powerful, ready-to-use analytics solution designed to transform complex educational data into clear, interactive insights. Instead of spending hours preparing reports, administrators and leadership teams can instantly monitor performance using dynamic visuals, KPIs, and smart filters.
This professionally designed dashboard helps education providers analyze student outcomes, financial health, departmental performance, and regional trends — all from one centralized platform. Whether you manage a university, training institute, or online education platform, this dashboard enables faster, smarter, and data-driven decisions.
📊 Key Feature of Education Services Dashboard in Power BI
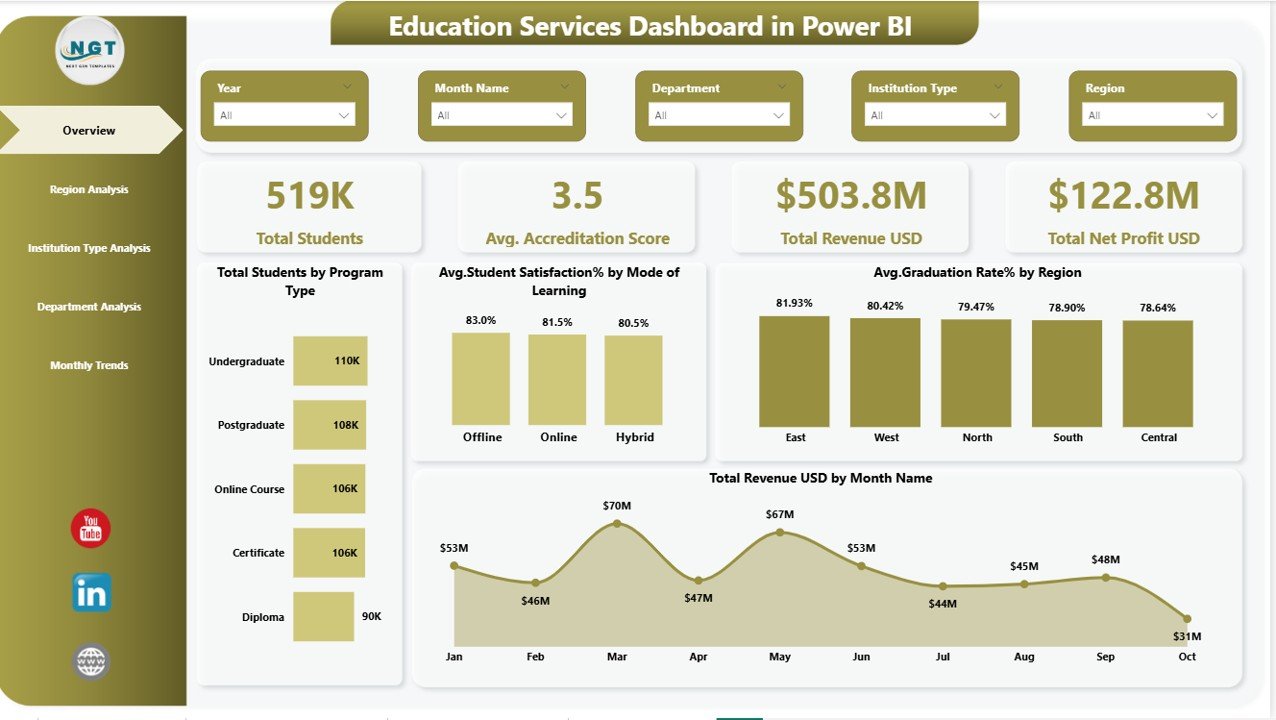
✅ Interactive Overview Dashboard – Instantly view Total Students, Accreditation Score, Revenue, and Net Profit through KPI cards.
✅ Multi-Page Analytical Design – Five structured dashboard pages provide deep insights into institutional performance.
✅ Dynamic Slicers & Filters – Analyze data by region, department, institution type, and time period effortlessly.
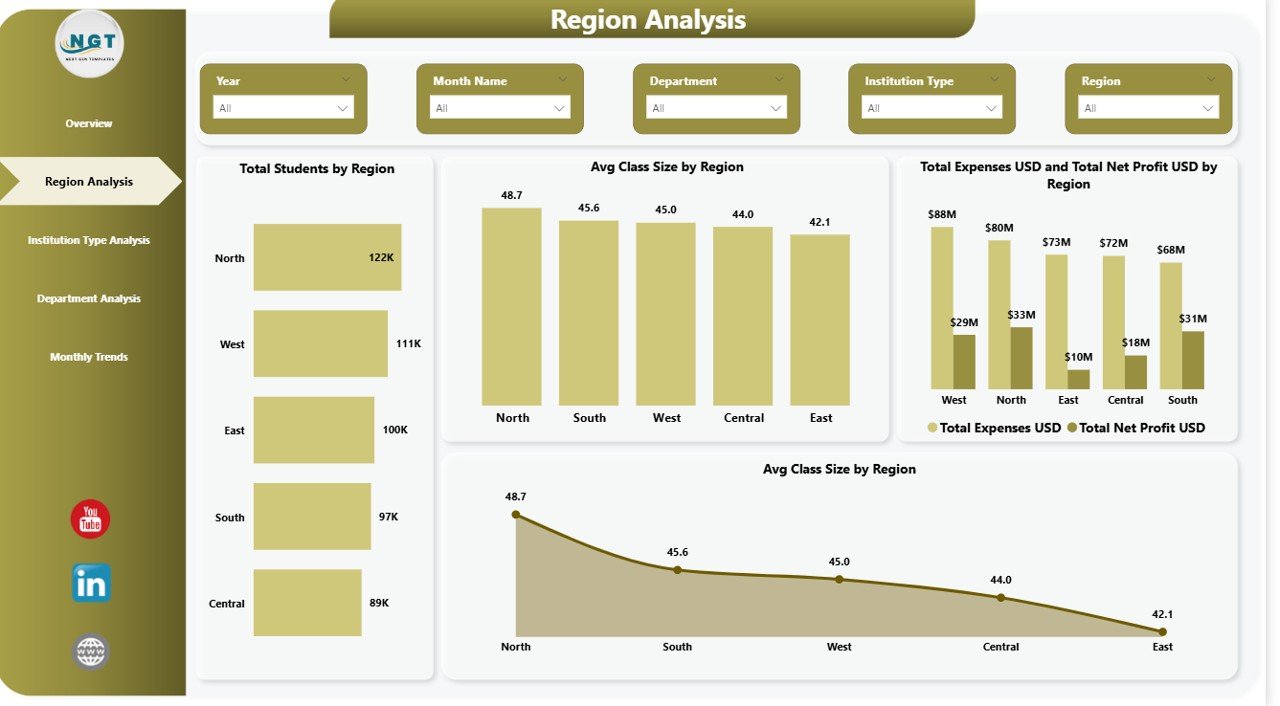
✅ Regional Performance Insights – Compare enrollment, class size, expenses, and profitability across locations.
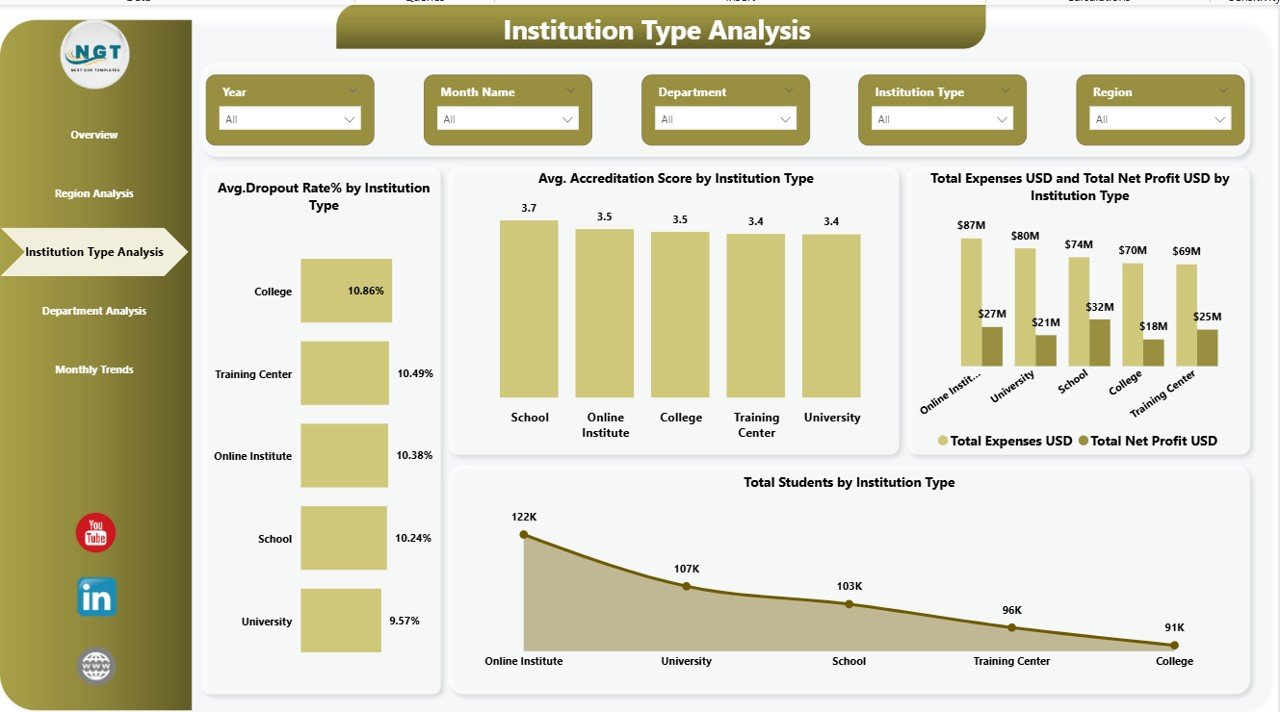
✅ Institution Type Comparison – Evaluate universities, colleges, and training institutes using performance analytics.
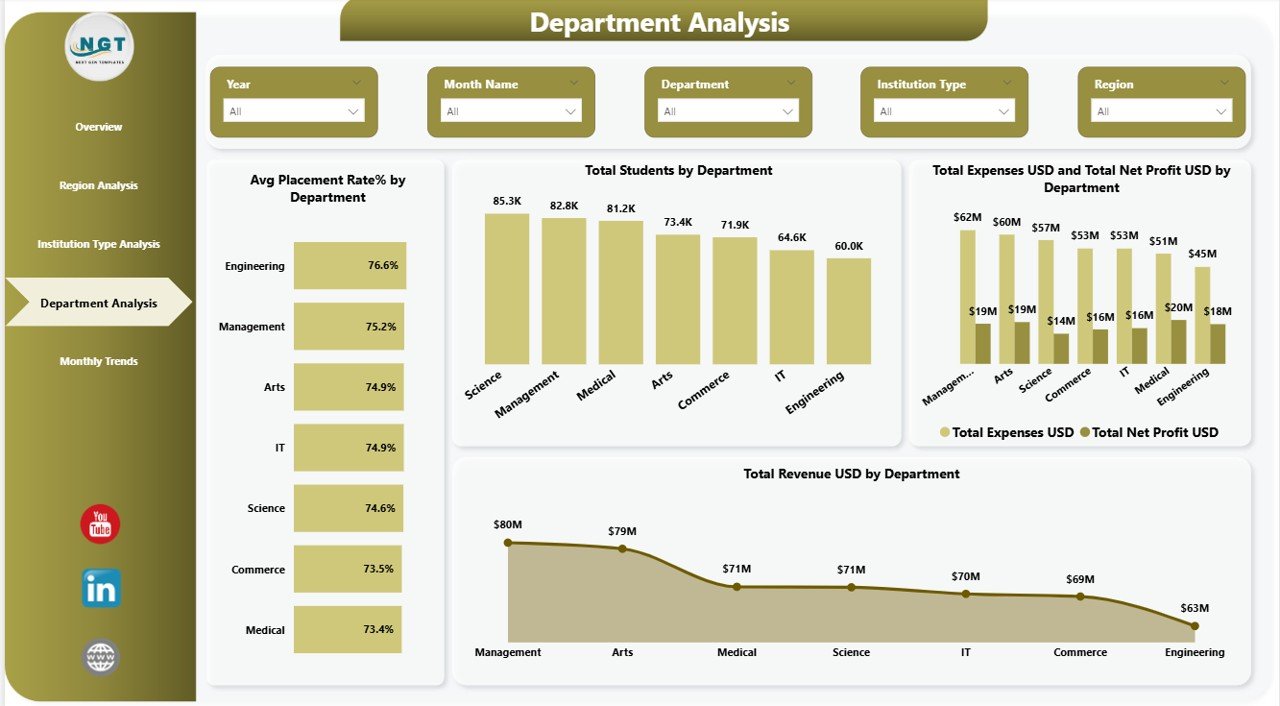
✅ Department Performance Monitoring – Identify high-performing departments using placement rates and revenue analysis.
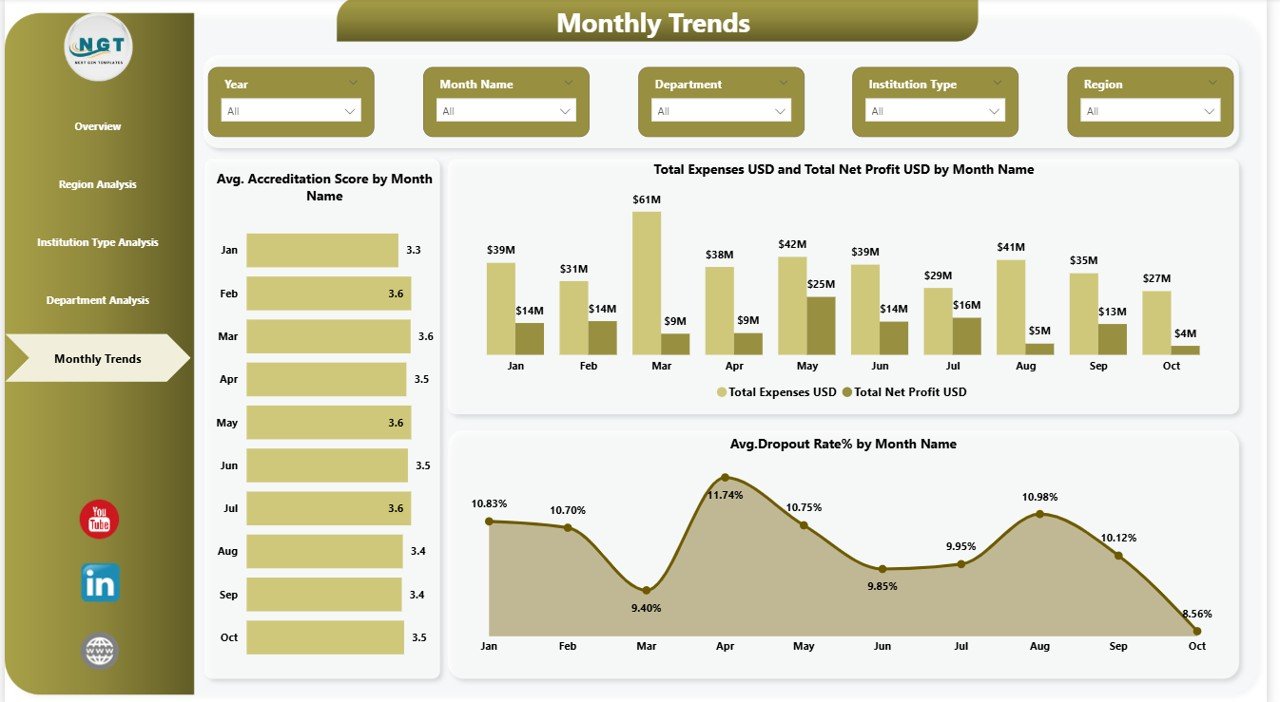
✅ Monthly Trend Analysis – Track accreditation scores, dropout rates, and financial performance over time.
✅ Professional Visualizations – Built using Power BI best practices for clarity and executive reporting.
✅ Real-Time Analytics Ready – Refresh data easily to keep insights updated.
📦 What’s Inside the Education Services Dashboard in Power BI
📁 Fully designed Power BI Desktop (.PBIX) file
📊 Five interactive dashboard pages:
-
Overview Dashboard
-
Region Analysis
-
Institution Type Analysis
-
Department Analysis
-
Monthly Trends Analysis
📈 Pre-built KPI visuals and charts
🎛 Interactive slicers for flexible analysis
🧩 Structured data model ready for customization
📘 Easy-to-understand dashboard layout for non-technical users
Everything is organized to help you start analyzing immediately without complex setup.
⚙️ How to Use the Education Services Dashboard in Power BI
1️⃣ Open the Power BI file using Power BI Desktop.
2️⃣ Connect your institutional datasets or replace sample data.
3️⃣ Refresh the dashboard to update visuals automatically.
4️⃣ Use slicers to filter by region, department, or institution type.
5️⃣ Explore trends and KPIs to identify insights instantly.
No advanced technical expertise is required — the dashboard is designed for quick adoption and easy navigation.
🎯 Who Can Benefit from This Education Services Dashboard in Power BI
🎓 Educational Institutions
-
Universities and Colleges
-
Schools and Training Centers
-
Online Learning Platforms
👩💼 Administrative Teams
-
Academic Directors
-
Finance Managers
-
Operations Teams
📊 Strategic Decision Makers
-
Education Consultants
-
Institutional Planners
-
Policy Analysts
Even non-technical users can analyze performance confidently using interactive visuals.
Educational organizations that adopt data-driven analytics gain a major competitive advantage. This dashboard eliminates fragmented reporting, improves transparency, and enables proactive decision-making.
Instead of reacting to problems late, institutions can monitor performance continuously, improve student outcomes, optimize budgets, and plan future growth with confidence.
The Education Services Dashboard in Power BI is not just a reporting tool — it is a complete decision-support system designed for modern education management.
Click here to read the Detailed blog post
Watch the step-by-step video tutorial:


