E-commerce Dashboard in HTML is a powerful, browser-based analytics tool designed to help online store owners, managers, and analysts track sales, revenue, customer satisfaction, and shipping efficiency — all from one sleek, interactive interface. Whether you operate a single storefront or manage multiple sales channels, this ready-to-use HTML dashboard transforms raw e-commerce data into meaningful visual insights that drive smarter business decisions.
Built with modern web technologies and interactive chart libraries, this dashboard provides a premium SaaS-like experience right in your browser. Upload your own Excel data file, apply dynamic filters, and explore performance metrics across multiple analysis pages instantly. No software installation is needed — just open the HTML file and start analyzing!
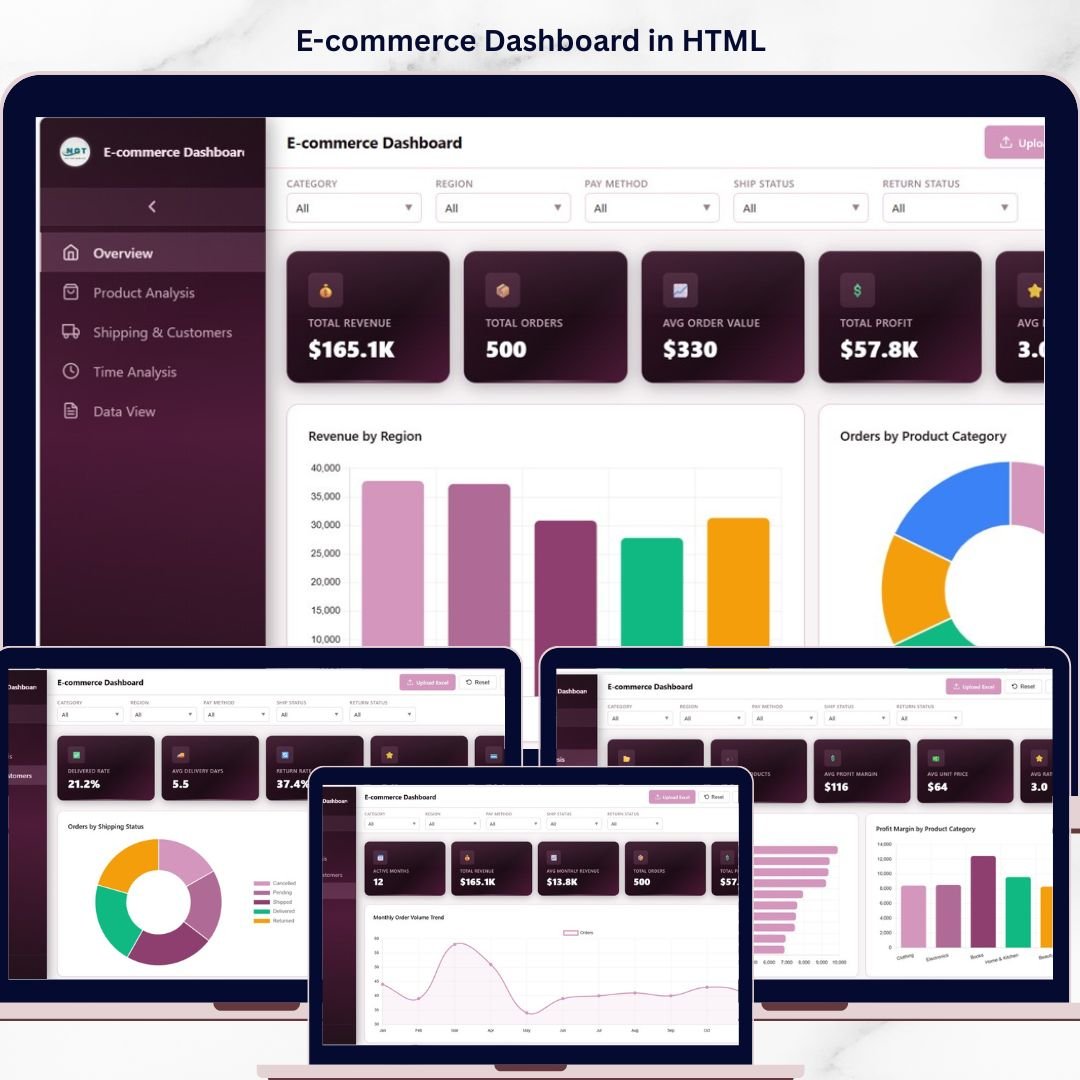
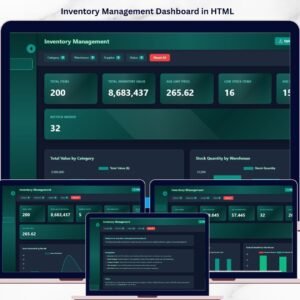
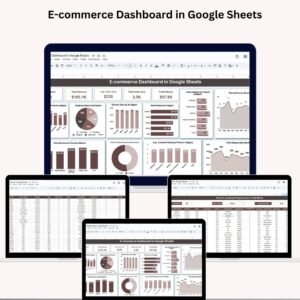
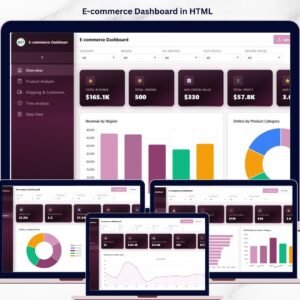
 E-commerce Dashboard in HTML
🔑 Key Features of the E-commerce Dashboard in HTML
📌 Multi-Page Interactive Analytics – Navigate between Overview, Product Analysis, Shipping & Customers, Time Analysis, and Data View pages using a modern sidebar layout.
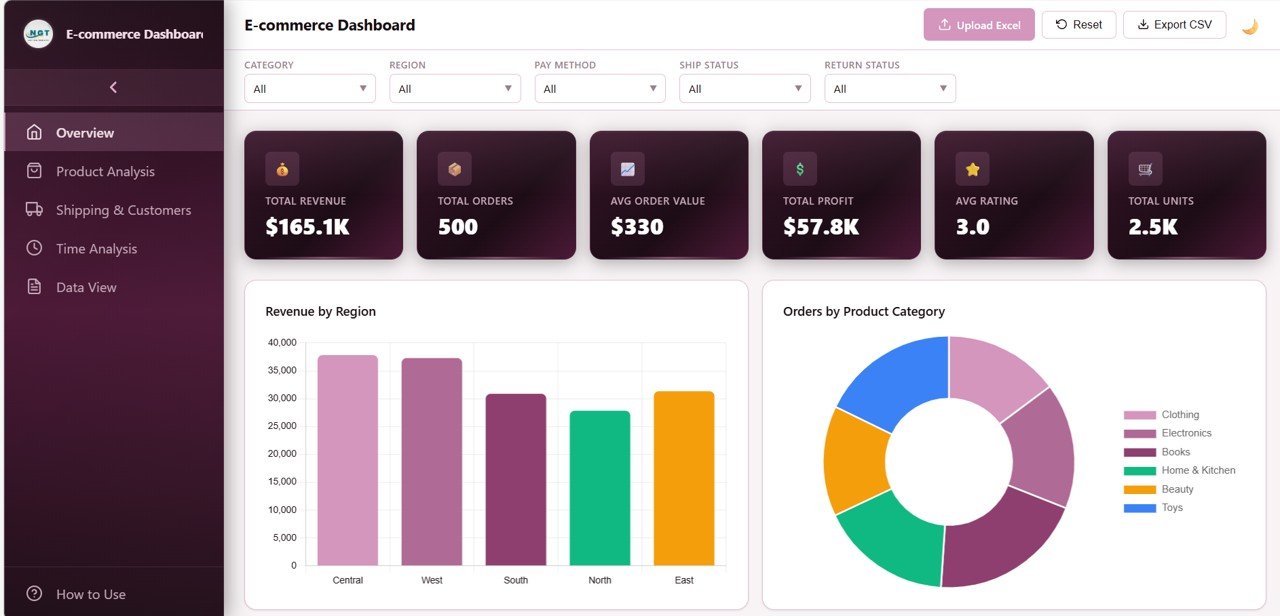
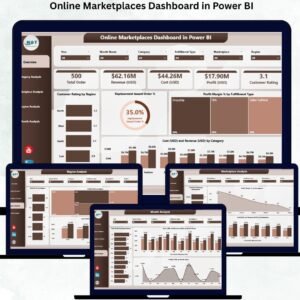
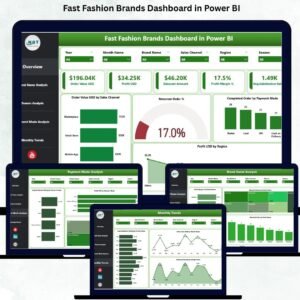
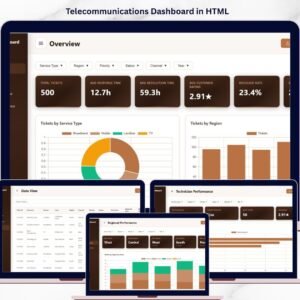
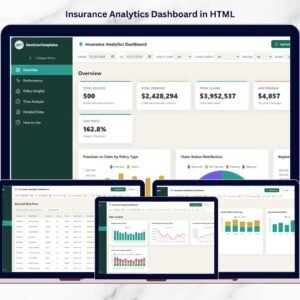
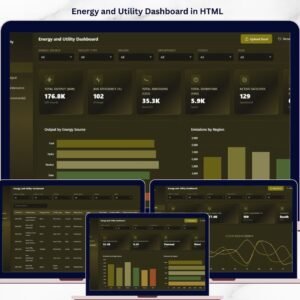
📊 Dynamic KPI Cards – Instantly view Total Revenue, Total Orders, Average Order Value, Total Profit, Average Rating, and Total Units at the top of the overview page.
🎛️ Global Filters & Slicers – Apply multiple slicers to filter the entire dashboard and see filtered results quickly across all analysis pages.
📈 Rich Chart Visualizations – Explore interactive bar charts, line trends, donut charts, and grouped comparisons that update dynamically based on your filter selections.
🌗 Light & Dark Theme Toggle – Switch seamlessly between light and dark modes for comfortable viewing in any environment.
📤 Excel File Upload – Replace demo data with your own e-commerce dataset by uploading an Excel file directly into the dashboard.
📥 CSV Export – Export filtered transaction-level data for further analysis or reporting.
📱 Fully Responsive Design – Works beautifully on desktops, tablets, and mobile devices with auto-collapsing sidebar navigation.
📦 What’s Inside the E-commerce Dashboard in HTML
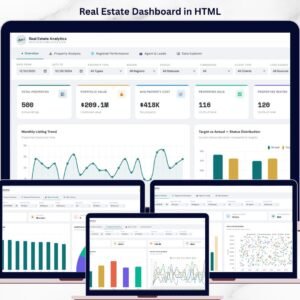
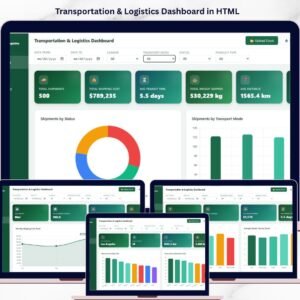
✅ Overview Page – High-level KPI cards showing Total Revenue, Total Orders, Average Order Value, Total Profit, Average Rating, and Total Units. Charts include Revenue by Region, Orders by Product Category, Revenue by Payment Method, Shipping Status Distribution, and Monthly Revenue Trend.
✅ Product Analysis Page – Deep dive into product performance with Revenue by Product Name, Profit Margin by Product Category, Average Rating by Product Category, Units Ordered by Product Category, and Top 10 Products by Revenue.
 Product Analysis Page
✅ Shipping & Customers Page – Monitor logistics and customer behavior with Orders by Shipping Status, Average Delivery Days by Region, Return Status Distribution, Orders by Customer Rating, and Payment Type Distribution.
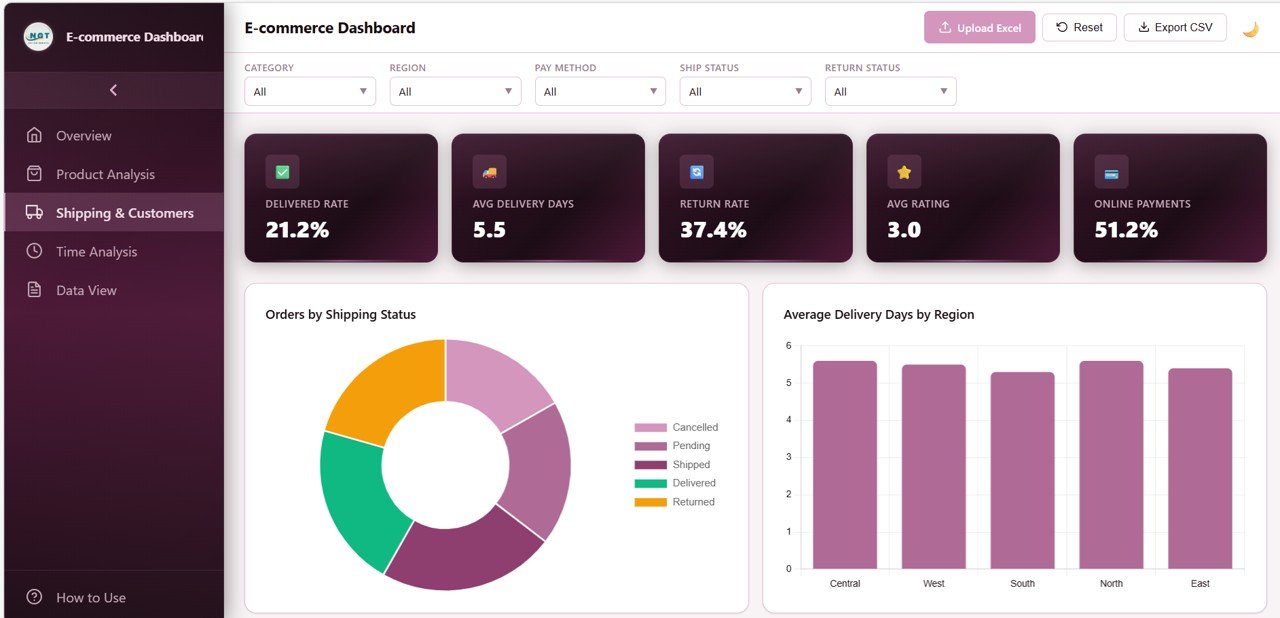 Shipping and Customers Page
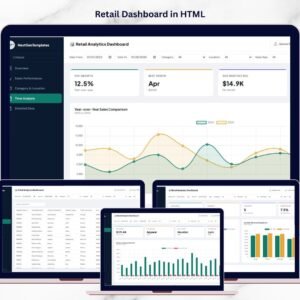
✅ Time Analysis Page – Track performance trends over time with Monthly Order Volume Trend, Average Order Value by Month, Profit Margin by Month, Revenue by Region and Month, and Average Delivery Days by Month.
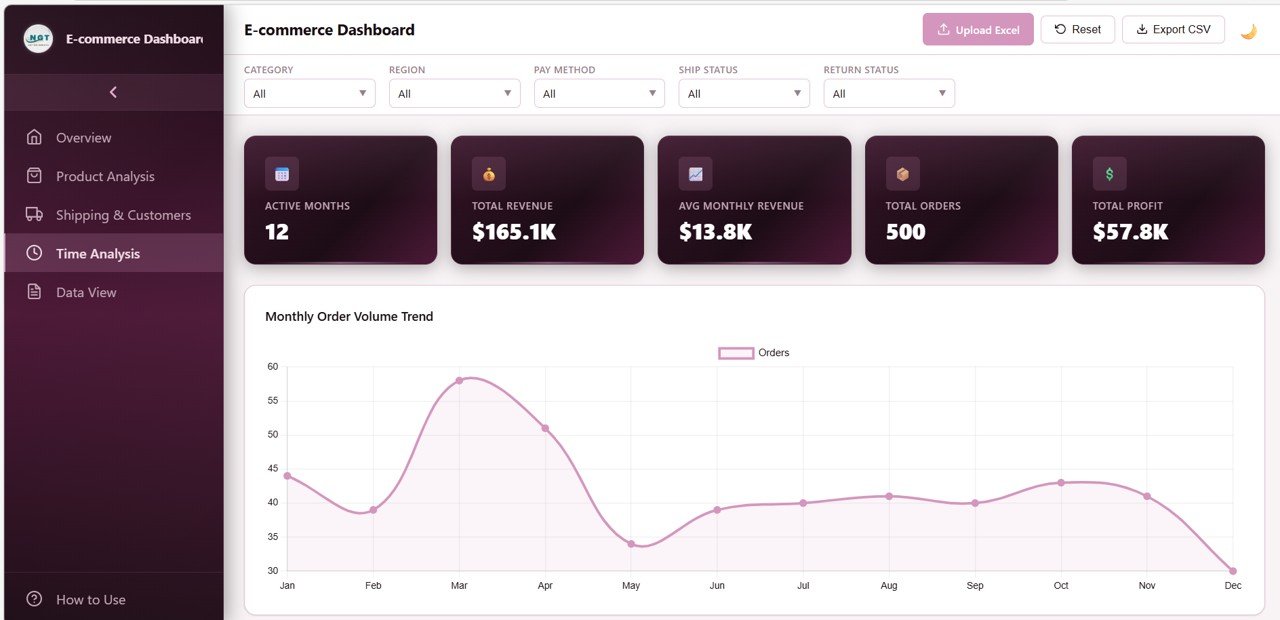 Time Analysis Page
✅ Data View Page – A detailed data table showing all records with search, sort, and pagination features. You can also export the filtered data to CSV for offline analysis.
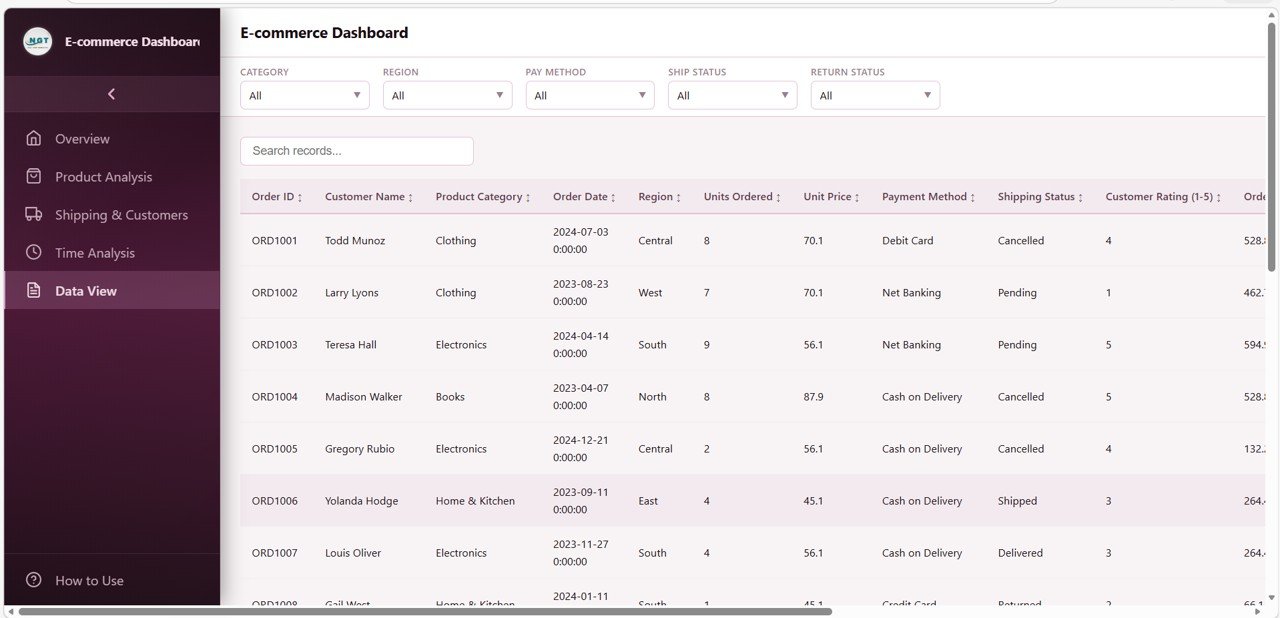 Data View Page
✅ How to Use Guide – Built-in instructions explaining data format requirements, upload process, navigation, and features.
⚙️ How to Use the E-commerce Dashboard in HTML
1️⃣ Download & Open – Download the HTML file and open it in any modern web browser like Chrome, Edge, Firefox, or Safari.
2️⃣ Explore Demo Data – The dashboard comes pre-loaded with realistic demo data so you can explore all features immediately.
3️⃣ Upload Your Data – Click the upload button to replace demo data with your own e-commerce Excel file.
4️⃣ Apply Filters & Analyze – Use the slicers and global filters to segment data by region, category, payment method, shipping status, or time period.
5️⃣ Export & Share – Export filtered data as CSV from the Data View page or take screenshots to share with your team.
👥 Who Can Benefit from This E-commerce Dashboard in HTML
🏪 E-commerce Store Owners – Monitor your store’s KPIs, sales trends, and shipping performance in real time.
📈 Sales & Marketing Teams – Track product performance, revenue by region, and payment method trends.
🛠️ Operations Managers – Optimize shipping fulfillment and reduce delivery delays with logistics insights.
📊 Business Analysts – Perform in-depth profitability analysis and identify growth opportunities across product categories.
💼 Consultants & Freelancers – Use this dashboard as a professional reporting tool for your e-commerce clients.
📖 Click here to read the Detailed Blog Post
Watch the step-by-step video tutorial:


Reviews
There are no reviews yet.