
In the world of logistics and supply-chain management, efficiency defines success. Managing warehouses, shipments, and delivery performance requires precise data visibility — and the Distribution KPI Scorecard in Excel is the ultimate solution.
This ready-to-use Excel template consolidates logistics, warehouse, and transportation data into a single, interactive performance scorecard. Designed for distribution managers, analysts, and operations heads, it provides a complete picture of how your distribution network is performing — from order accuracy to delivery timelines.
Built entirely in Microsoft Excel, this scorecard combines structured data tables, visual indicators, and trend charts to simplify complex reporting. With it, you can track performance, identify bottlenecks, and make informed, data-driven decisions in minutes — no coding or advanced analytics tools required.
⚙️ Key Features of the Distribution KPI Scorecard in Excel
📊 All-in-One Dashboard – Monitor MTD (Month-to-Date) and YTD (Year-to-Date) KPIs in one sheet.
🎯 Actual vs Target Comparison – Quickly identify areas that exceed or miss targets.
📈 Trend Analysis – Visualize KPI movement across months to detect improvement or decline.
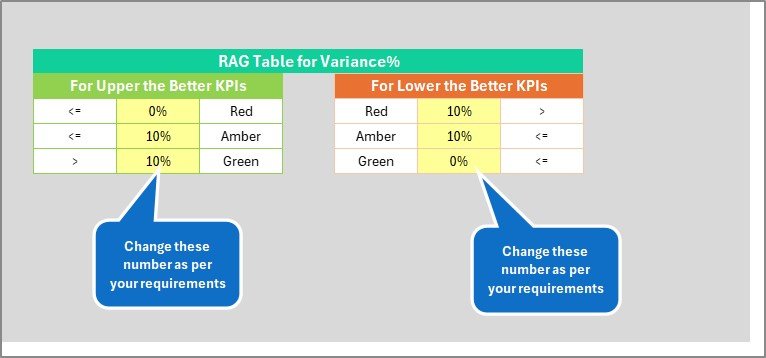
💡 Color-Coded Indicators – Green for success, red for risk — see status at a glance.
📋 KPI Definitions Sheet – Standardize KPI names, formulas, and meanings across departments.
🧮 Automatic Calculations – Built-in Excel formulas eliminate manual computation.
📅 Dropdown Filters – Switch between months and data views instantly.
🔒 No Coding Needed – Fully Excel-based; perfect for all skill levels.
⚙️ Customizable and Scalable – Add new KPIs, regions, or warehouses easily.
💼 Professional Design – Built for operations reviews and executive dashboards.
📂 What’s Inside the Distribution KPI Scorecard in Excel
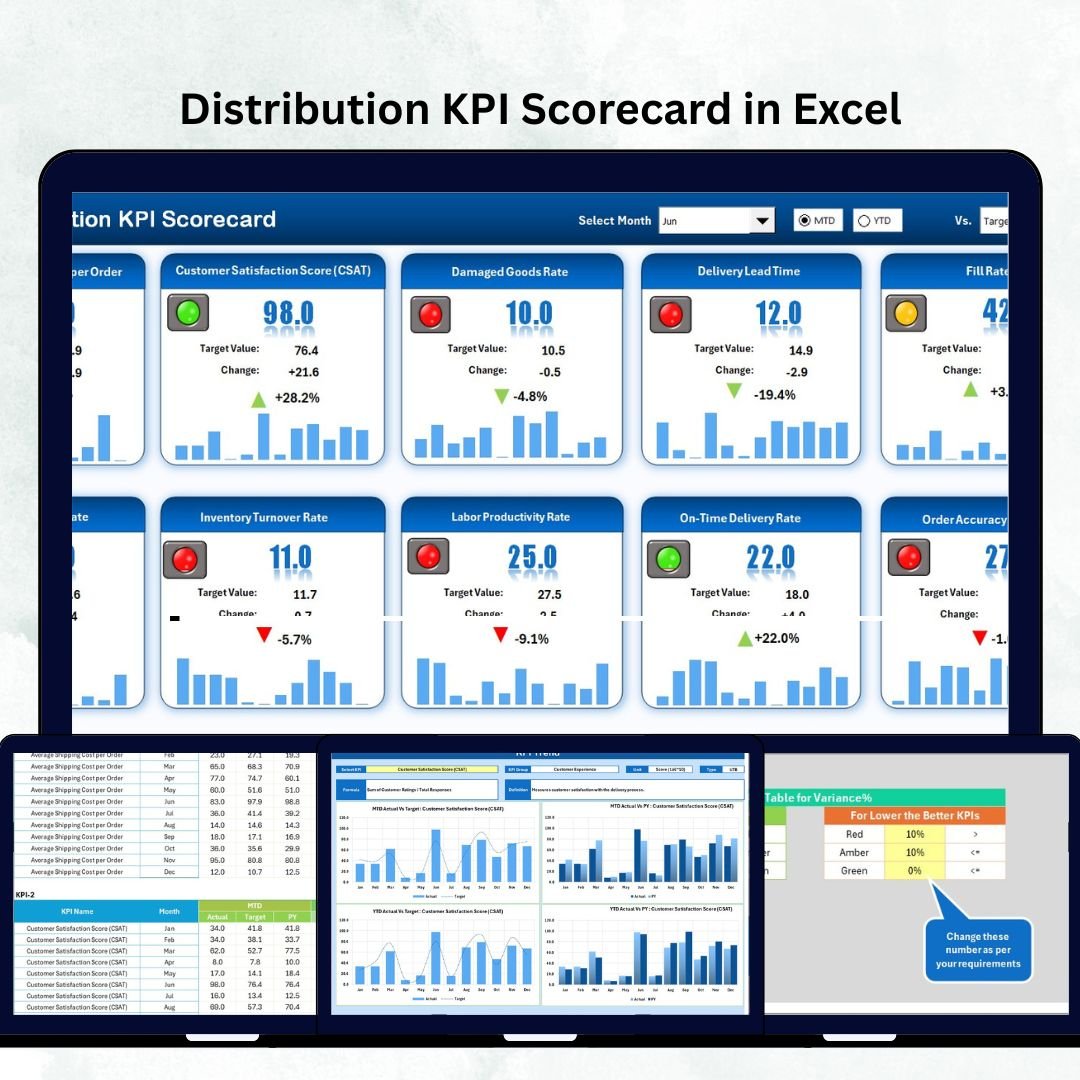
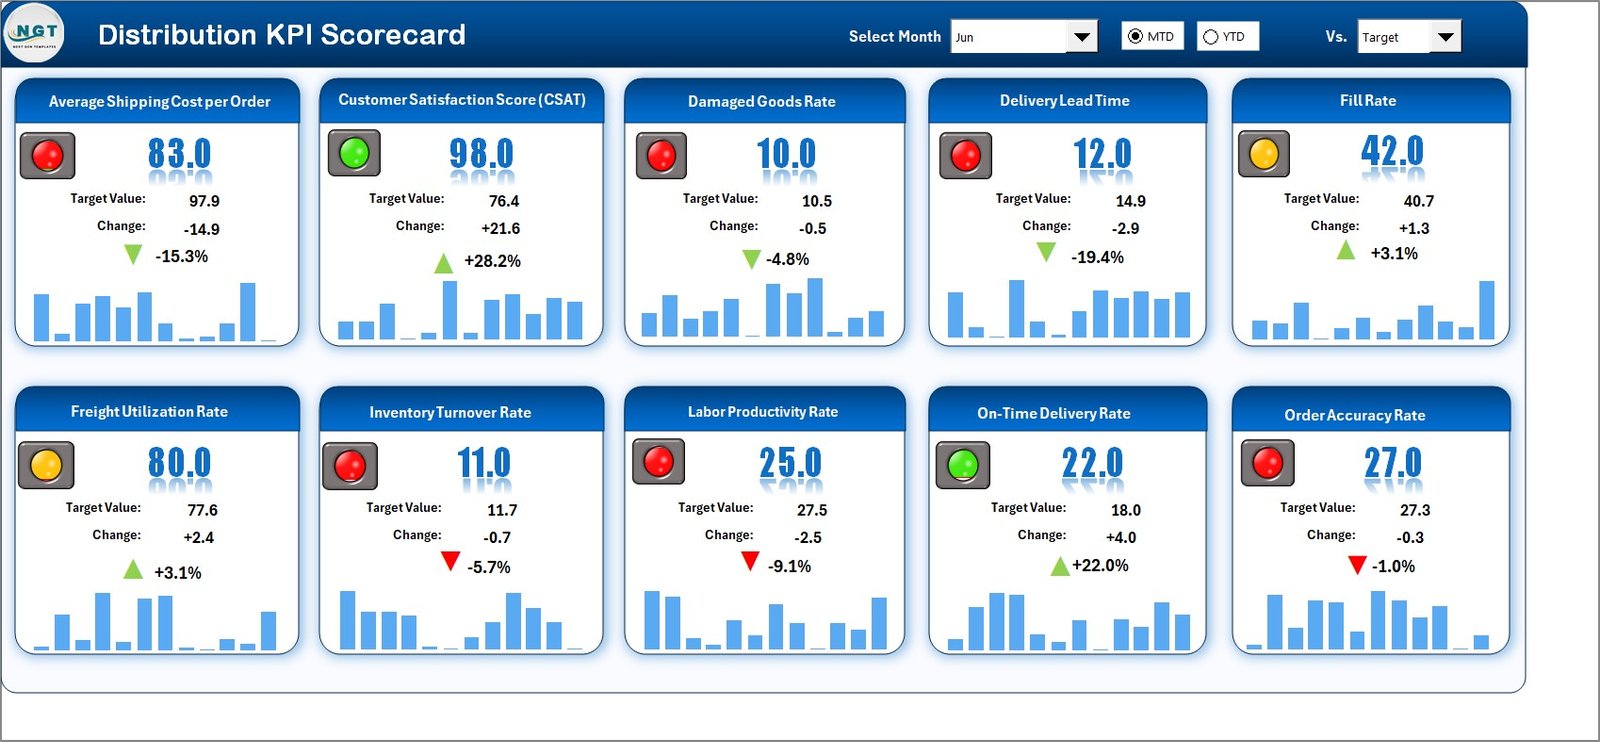
1️⃣ Scorecard Sheet – Main Dashboard
Your central performance hub. Use dropdowns to select month and MTD or YTD view.
Includes visual performance indicators and target comparisons for quick decision-making
2️⃣ KPI Trend Sheet – Track Progress Over Time
Select a specific KPI (cell C3) to see historical trends with interactive combo charts.
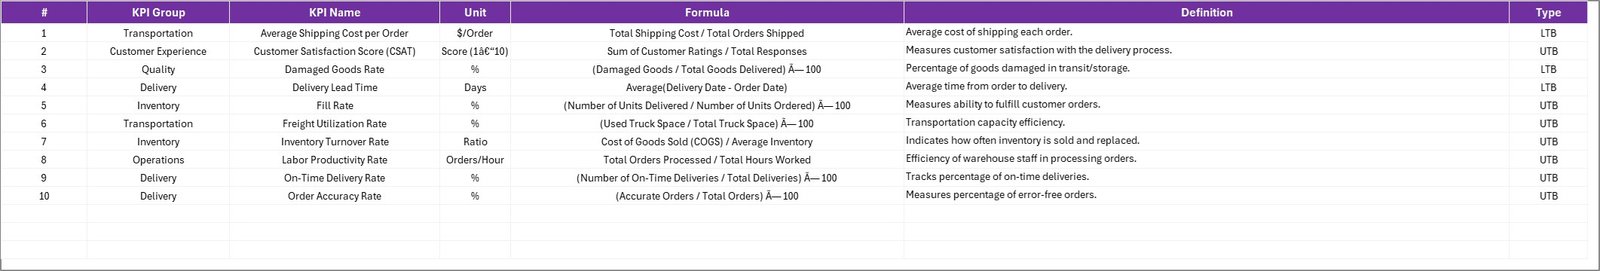
Review metadata like KPI Group, Unit, Type (UTB/LTB), Formula, and Definition for context.
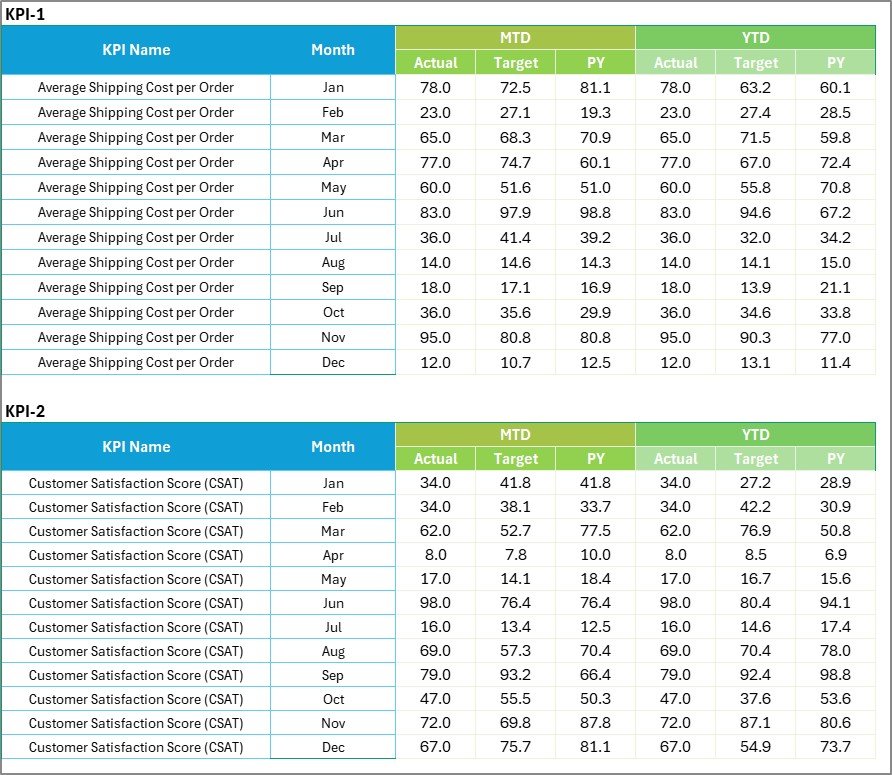
3️⃣ Input Data Sheet – The Data Engine
Record monthly Actual, Target, and Previous Year data for each KPI.
The dashboard updates automatically based on this sheet.
4️⃣ KPI Definition Sheet – The Reference Guide
Define each metric clearly to ensure consistent measurement across the organization.
This four-sheet structure keeps data entry, visualization, and analysis clean and reliable.
📦 Sample KPIs You Can Track
🏭 Operational KPIs
-
Order Fulfillment Rate (%)
-
On-Time Delivery (%)
-
Backorder Rate (%)
-
Inventory Turnover Ratio
🏢 Warehouse KPIs
-
Pick Accuracy (%)
-
Storage Utilization (%)
-
Order Cycle Time (Days)
-
Return Rate (%)
💰 Financial KPIs
-
Distribution Cost per Unit
-
Freight Cost as % of Sales
-
Profit per Order
-
Damage Cost (%)
You can customize these metrics or add new ones to match your business goals.
🧭 How to Use the Distribution KPI Scorecard
1️⃣ Define KPIs in the KPI Definition Sheet.
2️⃣ Enter Actual, Target, and PY data in the Input Data Sheet.
3️⃣ Navigate to the Scorecard Sheet and select your month.
4️⃣ Analyze Actual vs Target and PY comparisons visually.
5️⃣ Explore the KPI Trend Sheet to see historical patterns.
6️⃣ Update data monthly for accurate real-time insights.
💡 Pro Tip: Use Excel slicers to filter data by warehouse or region for deeper analysis.
🚀 Advantages of Using This Scorecard
✅ Centralized Tracking – All KPIs in one place for faster reviews.
✅ Data-Driven Decisions – Charts and indicators make analysis intuitive.
✅ Scalable and Flexible – Easily expand as your operations grow.
✅ Zero Extra Cost – Works within Excel — no software subscription required.
✅ Improved Accountability – Transparent KPI visibility encourages performance ownership.
🧠 Best Practices
📌 Define KPIs clearly and align them with business goals.
📌 Keep data consistent and formatted properly.
📌 Use simple color codes (Green = Good, Red = Poor).
📌 Review KPI trends monthly to spot seasonal variations.
📌 Protect formulas and back up data regularly.
📌 Train your team on reading and updating the dashboard.
👥 Who Can Benefit from This Scorecard
🚛 Distribution Managers – Monitor warehouse and delivery KPIs.
🏗️ Operations Leaders – Assess efficiency and cost optimization.
💼 Supply Chain Executives – Align KPIs with strategic goals.
📦 Warehouse Supervisors – Improve accuracy and utilization rates.
📊 Data Analysts – Perform monthly trend and variance analysis.


Reviews
There are no reviews yet.