


In today’s hyper-digital era, transformation without tracking is just guesswork. That’s why the Digital Transformation KPI Dashboard in Power BI is a game-changing tool designed to help you monitor, measure, and master your digital progress. From cloud adoption and automation to customer experience and innovation speed—this dynamic dashboard helps you stay in control, always. 🧠📈
Built using Power BI with Excel as the backend, this solution gives leaders and teams real-time visual insights that guide smart decisions and drive continuous growth.
🔍 Key Features of the Power BI Dashboard
🔸 1. Summary Page
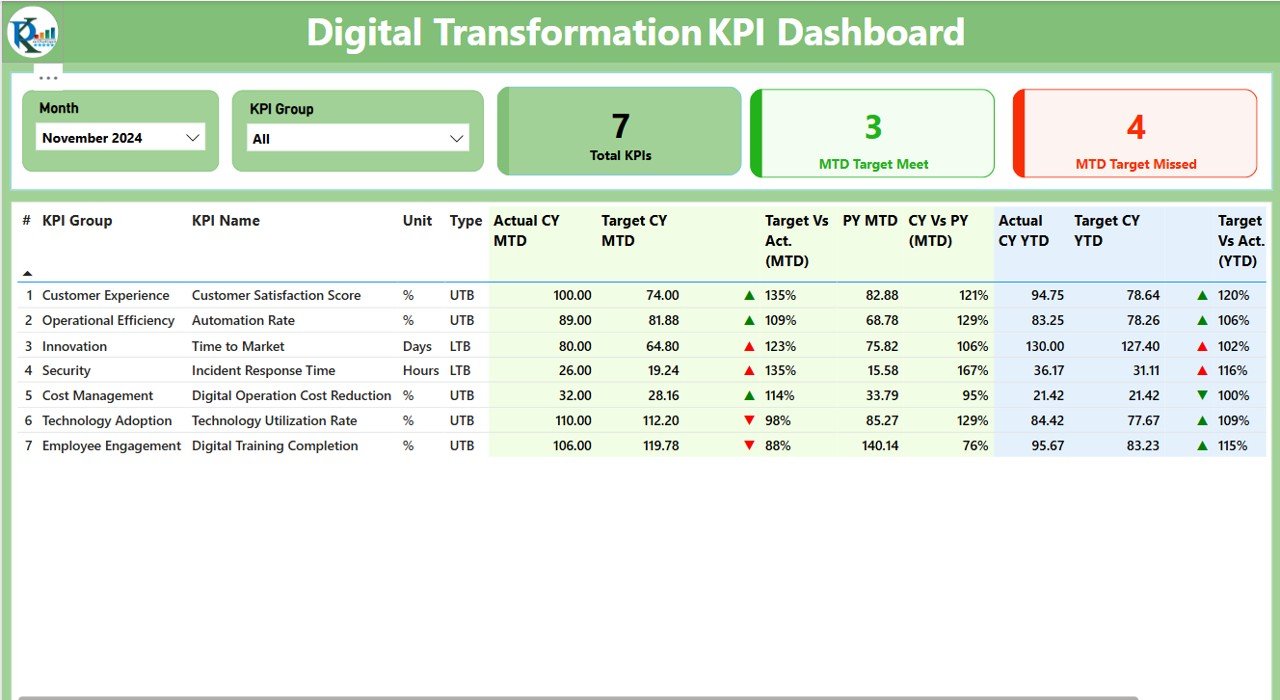
Your executive snapshot! Use filters for Month and KPI Group to view:
-
🟢 3 Insightful KPI Cards: Total KPIs, Target Met (MTD), and Target Missed (MTD)
-
📋 Dynamic Table: See KPI Number, Group, Name, Unit, Type (UTB/LTB), CY vs PY, Target vs Actual, and more.
-
🎯 Red/Green Icons: Visual cues that show if your KPIs are on track.
🔸 2. KPI Trend Page
Visualize progress over time using combo charts:
-
📆 MTD & YTD Trends: Compare CY actuals, PY actuals, and targets.
-
🧩 Interactive slicer lets you analyze any KPI in detail.
🔸 3. KPI Definition Page
A hidden drill-through page that reveals:
-
💡 KPI Formula
-
📘 Short, clear definition
-
🔙 Easy return button to main dashboard
📊 Data Source: Excel-Driven Simplicity
No complex database setup! Just use our structured Excel sheets:
-
Input_Actual – Actual KPI values by month
-
Input_Target – Target KPI values by month
-
KPI Definition – Master sheet for KPI number, group, formula, unit, and type
🚀 Why Use This Dashboard?
A Digital Transformation dashboard isn’t just a nice-to-have—it’s a necessity. This tool helps your organization:
-
📌 Focus on what matters
-
⏱️ React faster with real-time metrics
-
🔁 Track improvements month-over-month & year-over-year
-
💼 Align efforts across departments
From tech startups to global enterprises, this dashboard adapts to your size, speed, and goals.
💡 Best Practices for Maximum Impact
✅ Choose the Right KPIs: Link metrics to your transformation objectives
📐 Use Standard Formats: Keep units consistent across all KPIs
🎨 Visualize with Purpose: Use status icons to highlight trends clearly
🔗 Connect Excel to Power BI: Automate refreshes for real-time analysis
🧾 Document Definitions: Ensure all team members understand each KPI
💼 Real-World Use Cases
-
🏢 Corporates: Measure digital training, app adoption, and system upgrades
-
🏦 Banks: Monitor mobile banking, AI deployment, and cybersecurity KPIs
-
🚀 Startups: Track automation goals, customer onboarding, and feature releases
-
🎓 Educational Institutes: Follow online learning effectiveness and digital resources
🔁 MTD & YTD Analysis – Simplified
Instantly compare MTD (Month-to-Date) and YTD (Year-to-Date) actuals with targets and previous year values. No manual calculation—just real-time insights with intuitive icons and charts.
🎓 Who Can Use This?
-
Digital Transformation Teams
-
CIOs, CTOs & Innovation Leaders
-
Operations & Strategy Heads
-
Business Analysts & BI Developers
All you need is basic Excel and Power BI knowledge.
📥 What You’ll Get:
-
✅ Power BI Dashboard (.pbix) file
-
📊 Excel Data Source Template
-
🎯 Sample KPI Definitions
-
🔄 Automated calculations for MTD/YTD with visuals
-
🎓 Access to video tutorial: youtube.com/@PKAnExcelExpert
🔗 Click here to read the Detailed blog post


Reviews
There are no reviews yet.