

Digital Media Agencies KPI Dashboard in Excel is your all-in-one performance measurement tool designed for fast-moving digital media teams. Agencies handle multiple clients, campaigns, platforms, and metrics—often all at the same time. Without a centralized system, reporting becomes slow, messy, and confusing. This dashboard removes all complexity and gives you a clean, ready-to-use KPI monitoring system that works entirely inside Excel.
This dashboard helps marketing teams track important KPIs such as clicks, impressions, CTR, ROI, conversions, CAC, revenue contribution, client performance, team productivity, delivery timelines, and more. Because everything updates automatically based on the selected month, agencies save hours of manual reporting time while gaining sharper insights.
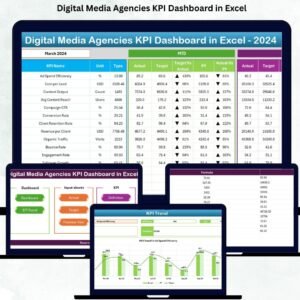
Whether you run SEO, social media, paid ads, or multi-channel campaigns, this Excel-based dashboard gives you month-to-date (MTD), year-to-date (YTD), target comparison, previous-year comparison, and trend analysis pages—all in one file. With its seven professionally designed worksheet tabs, it becomes the simplest yet most powerful analytics system for digital media agencies.
✨ Key Features of the Digital Media Agencies KPI Dashboard in Excel
This dashboard is packed with features that make KPI reporting faster, smarter, and easier.
🌟 Complete KPI Tracking System – Track all digital media KPIs including CTR, conversions, CAC, ROI, leads, and campaign performance.
📊 Automatic Monthly Updates – Select any month from the drop-down and the entire dashboard updates instantly.
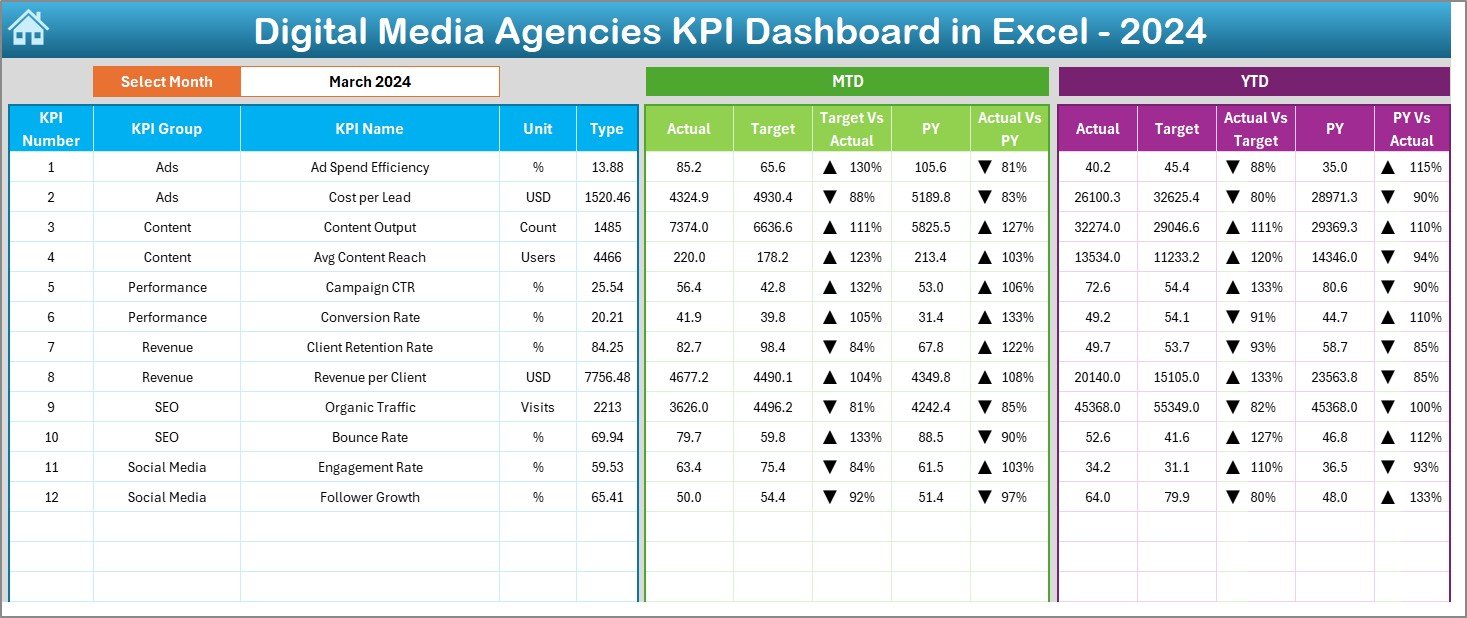
📈 MTD & YTD Insights – View short-term and long-term performance in one place.
📌 Target vs Actual Comparison – Instantly see where performance meets or misses expectations.
🔺 Conditional Formatting Signals – Up/down arrows help identify performance movement quickly.
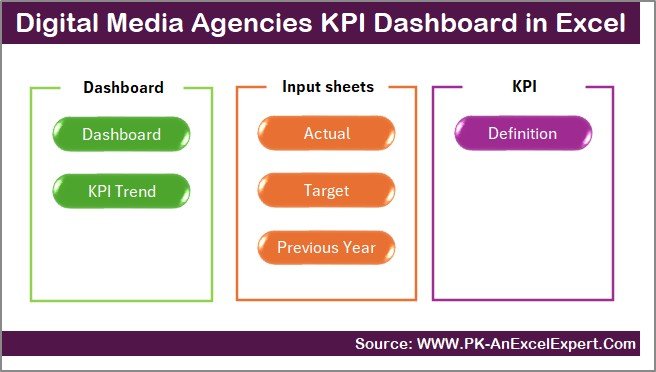
📂 7 Structured Worksheet Tabs – Includes Summary, Dashboard, Trend, Actual Input, Target Input, Previous Year Data, and KPI Definition.
🚀 Beginner-Friendly Interface – No coding, macros, or complex tools required.Digital Media Agencies KPI Dashboard in Excel
📦 What’s Inside the Digital Media Agencies KPI Dashboard in Excel
Your downloadable Excel file includes 7 powerful pages, each designed with clarity and usability in mind.
1️⃣ Summary Page – Navigation hub with smart buttons for quick access.
2️⃣ Dashboard Sheet – Main analysis page with KPIs, targets, trends, and conditional formatting.
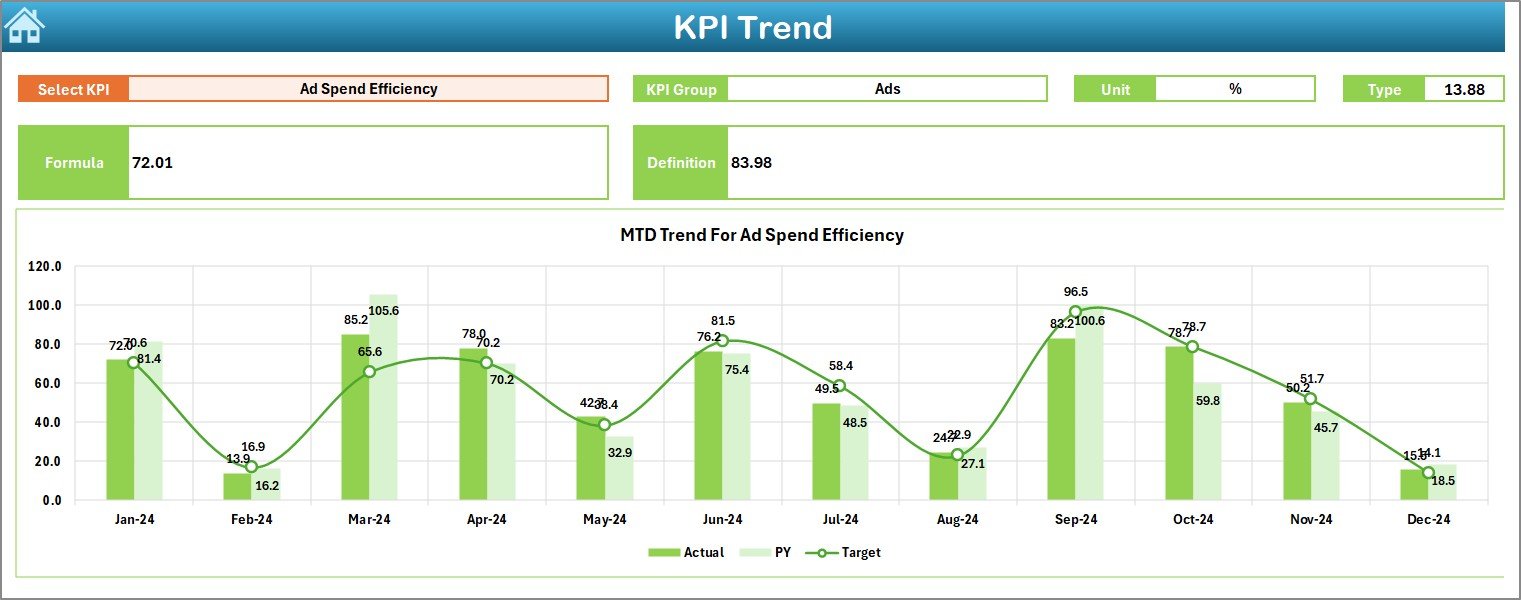
3️⃣ Trend Sheet – KPI-wise trend graphs for MTD & YTD performance.
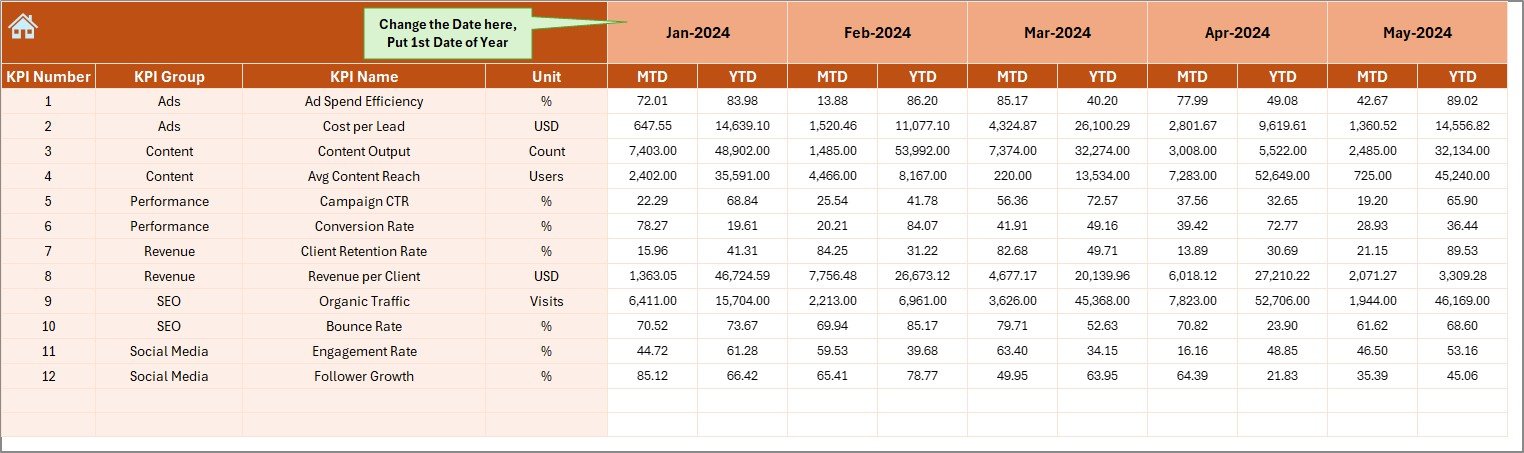
4️⃣ Actual Numbers Input Sheet – Enter monthly performance values easily.
5️⃣ Target Sheet – Store monthly and YTD targets for all KPIs.
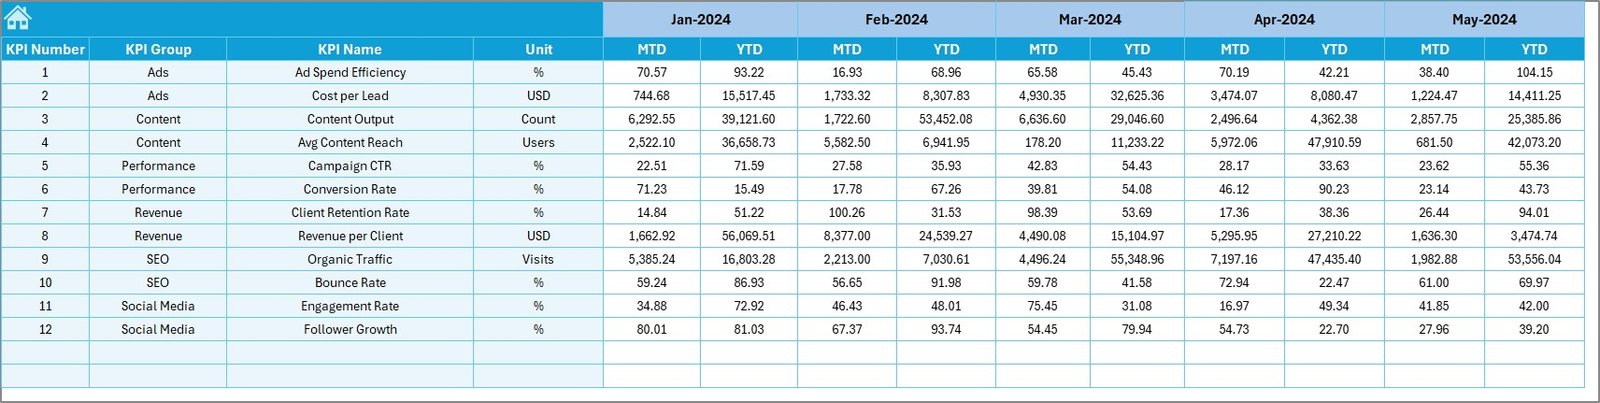
6️⃣ Previous Year Data Sheet – Compare current performance with last year.
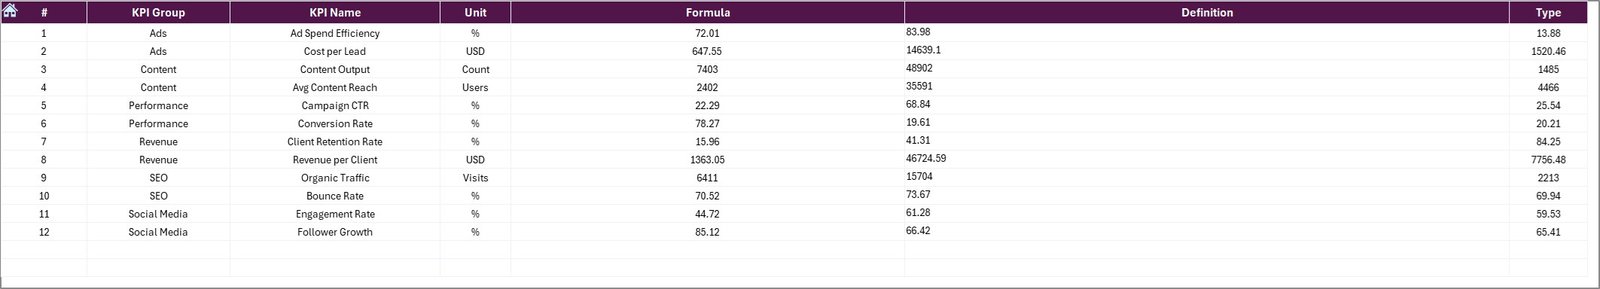
7️⃣ KPI Definition Sheet – Clear details of each KPI for team alignment.
Every page is designed for smooth analysis, accurate reporting, and quick decision-making.Digital Media Agencies KPI Dashboard in Excel
🛠️ How to Use the Digital Media Agencies KPI Dashboard in Excel
Using this dashboard is extremely simple—even for beginners.
👉 Step 1: Enter KPI actual values in the Actual Numbers Input Sheet.
👉 Step 2: Enter monthly + YTD targets in the Target Sheet.
👉 Step 3: Update previous year values in the PY Data Sheet.
👉 Step 4: Go to the Dashboard page and choose any month using the drop-down.
👉 Step 5: Review MTD, YTD, target, and PY comparisons instantly.
👉 Step 6: Use the Trend Sheet for deeper KPI-wise performance graphs.
Your entire dashboard updates automatically—no formulas or edits needed.Digital Media Agencies KPI Dashboard in Excel
🎯 Who Can Benefit from This Digital Media Agencies KPI Dashboard in Excel
This dashboard is perfect for anyone working in digital marketing, including:
👩💼 Digital Media Agencies – Track multi-client KPIs effortlessly.
📈 Marketing Managers – Review targets, performance gaps, and growth areas quickly.
🧑💻 Data Analysts – Access clean, structured KPI data for reporting.
📢 Freelancers & Consultants – Present professional KPI dashboards to clients.
🏢 Small & Large Marketing Teams – Standardize KPI tracking across all channels.
If you want clarity, speed, and accuracy in your reporting system—this dashboard is made for you.
### Click here to read the Detailed Blog Post
Watch the step-by-step video tutorial:


Reviews
There are no reviews yet.