

Modern defense and military organizations operate under extreme pressure, tight budgets, and high accountability. Every decision related to personnel deployment, vehicle usage, mission planning, and budget utilization directly impacts national security and operational readiness. However, when this critical information remains scattered across multiple spreadsheets or static reports, leaders lose clarity, speed, and confidence.
That is exactly where the Defense and Military Dashboard in Excel becomes a game-changing solution.
This ready-to-use Excel dashboard transforms complex defense data into clear, interactive, and actionable insights. Instead of manually compiling reports, decision-makers gain instant visibility into budgets, operations, personnel, vehicles, and regional performance—all in one centralized dashboard.
Designed for real-world military operations, this dashboard helps commanders, planners, and finance teams make faster, smarter, and data-driven decisions without relying on expensive software or complex systems.
🔑 Key Features of Defense and Military Dashboard in Excel
🛡️ Centralized Operational Visibility – Track budgets, personnel, vehicles, and missions from a single Excel dashboard
📊 Interactive KPI Monitoring – Analyze performance using dynamic charts, slicers, and KPIs
💰 Budget vs Actual Spend Tracking – Identify overspending, savings, and cost variance instantly
🧭 Operation-Type Analysis – Understand how different missions consume resources
🌍 Region-Wise Performance Insights – Monitor deployments and costs across multiple regions
📈 Monthly Trend Analysis – Identify operational patterns and forecast future needs
⚙️ Excel-Based & Customizable – No advanced tools required; easy to modify and expand

📦 What’s Inside the Defense and Military Dashboard in Excel
This dashboard includes multiple structured sheets, each designed to answer specific operational and strategic questions:
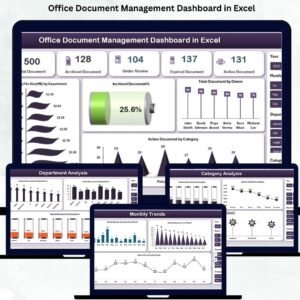
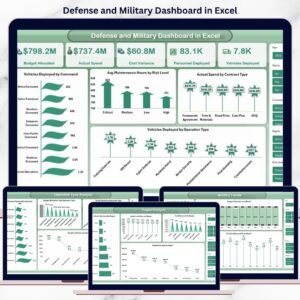
📌 Overview Sheet
Displays high-level KPIs such as:
-
Budget Allocated
-
Actual Spend
-
Cost Variance
-
Personnel Deployed
-
Vehicles Deployed
Includes powerful visuals like:
-
Vehicles Deployed by Command
-
Average Maintenance Hours by Risk Level
-
Actual Spend by Contract Type
-
Vehicles Deployed by Operation Type
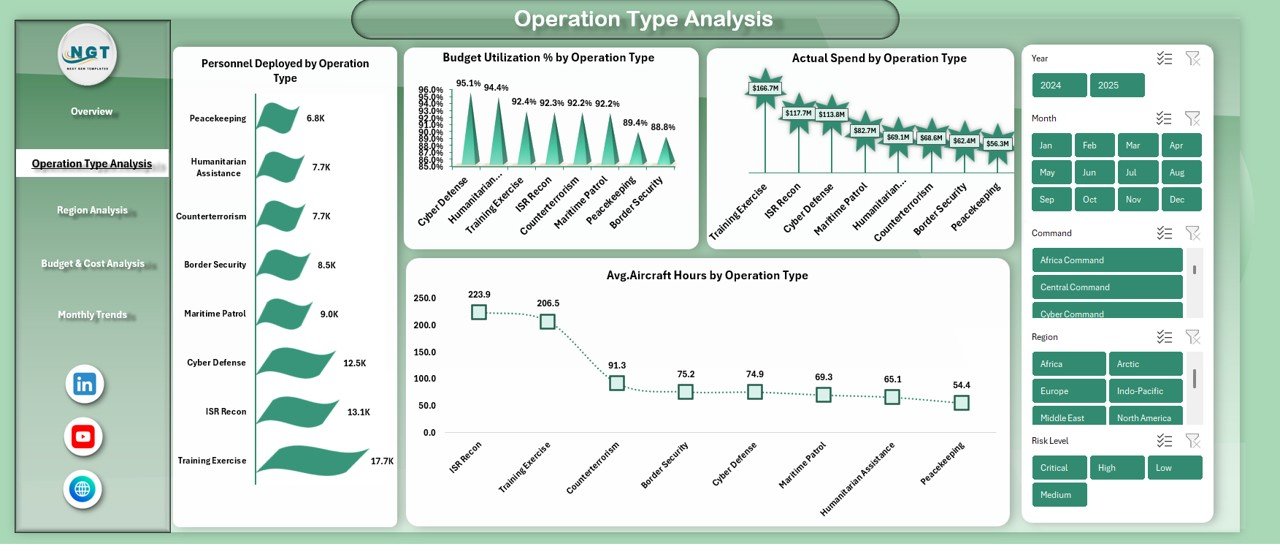
📌 Operation Type Analysis Sheet
Provides mission-level insights including:
-
Personnel Deployed by Operation Type
-
Budget Utilization % by Operation Type
-
Actual Spend by Operation Type
-
Average Aircraft Hours by Operation Type
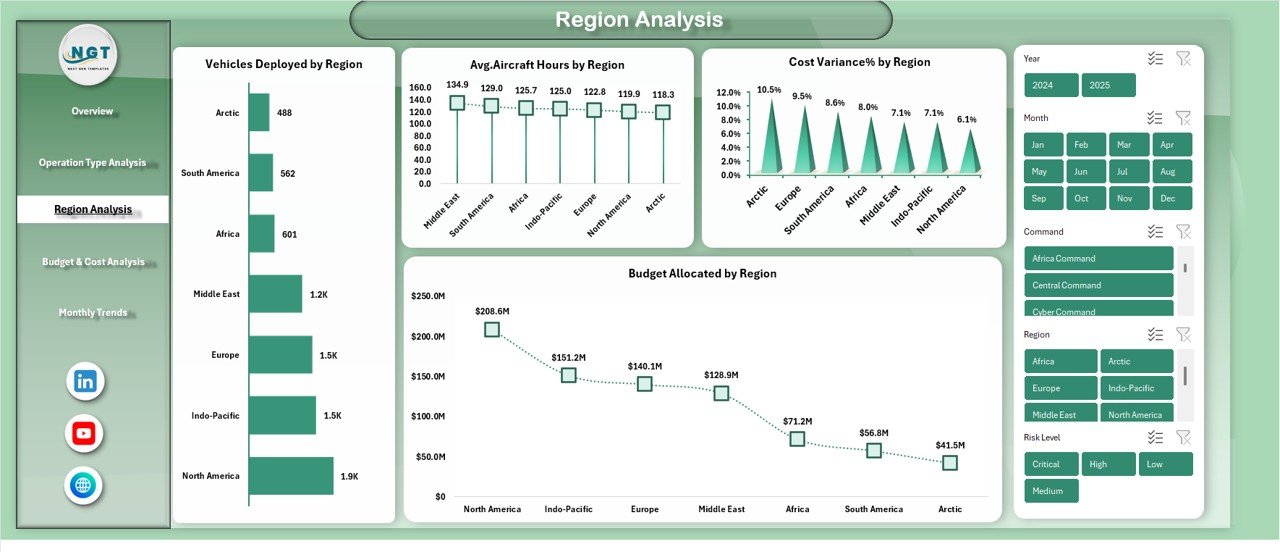
📌 Region Analysis Sheet
Helps analyze geographic performance with:
-
Vehicles Deployed by Region
-
Average Aircraft Hours by Region
-
Cost Variance % by Region
-
Budget Allocated by Region
📌 Budget & Cost Analysis Sheet
Supports financial control with:
-
Budget Allocated vs Actual Spend by Operation Type
-
Cost Variance by Risk Level
-
Budget Utilization % by Contract Type
-
Cost Variance % by Training Type
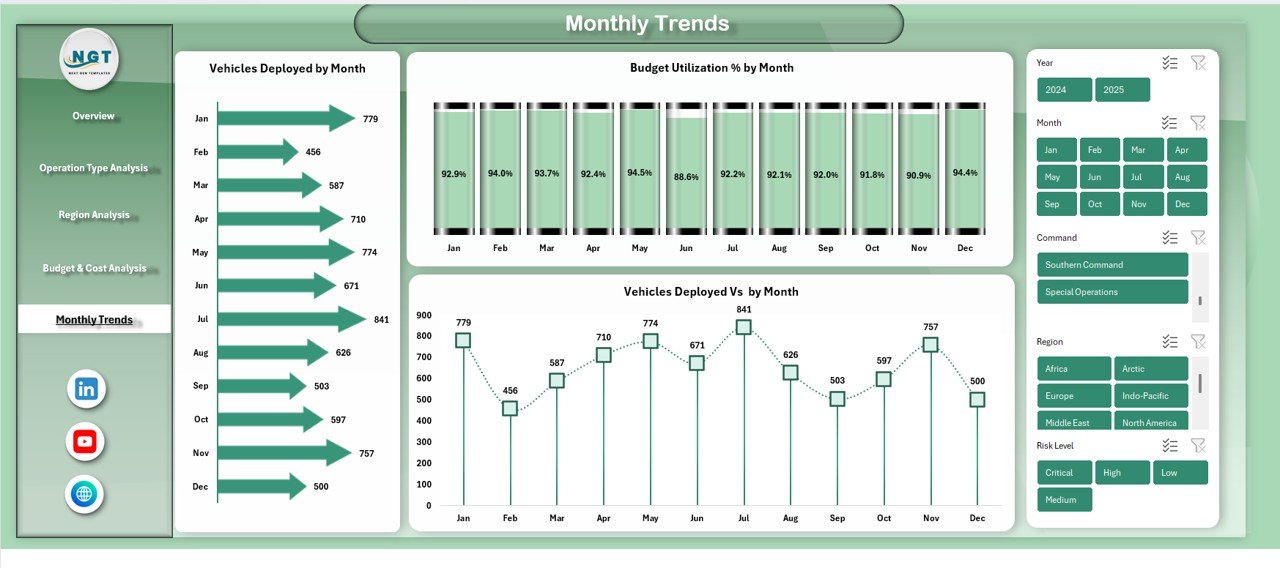
📌 Monthly Trends Sheet
Tracks performance over time using:
-
Vehicles Deployed by Month
-
Budget Utilization % by Month
-
Vehicles Deployed vs Budget by Month
🧭 How to Use the Defense and Military Dashboard in Excel
Using this dashboard is simple and practical:
1️⃣ Enter or update your operational data in the source data sheet
2️⃣ Refresh pivot tables if required
3️⃣ Use slicers to filter by region, operation type, or month
4️⃣ Instantly analyze KPIs, charts, and trends
5️⃣ Use insights to support planning, budgeting, and mission readiness
No advanced Excel knowledge is required—basic Excel familiarity is enough to get started.
🎯 Who Can Benefit from This Defense and Military Dashboard in Excel
This dashboard is ideal for:
🎖️ Defense leadership and senior commanders
📋 Operations and mission planning teams
💼 Finance and budget control departments
🚛 Logistics and fleet management teams
🛠️ Maintenance and risk assessment units
Whether you operate at a strategic or tactical level, this dashboard delivers clarity, control, and confidence.
Click here to read the Detailed Blog Post
Watch the step-by-step video tutorial:


Reviews
There are no reviews yet.