

Data privacy is no longer a background function. With evolving regulations, rising customer expectations, and growing audit pressure, organizations must track privacy performance with clarity and confidence. Unfortunately, many data privacy teams still rely on scattered Excel files, delayed reports, and manual tracking—making compliance harder than it needs to be.
That’s exactly where the Data Privacy Office KPI Dashboard in Power BI becomes a game-changer 🚀
This ready-to-use dashboard transforms raw privacy KPI data into clear visuals, performance indicators, and trend analysis. Instead of chasing numbers at the last minute, data privacy teams gain instant visibility into compliance status, risks, and progress—all in one centralized Power BI dashboard.
Built using Excel as the data source and Power BI as the visualization layer, this solution combines simplicity with powerful analytics. You update data easily in Excel, and Power BI handles the insights automatically.
## 🔑 Key Features of Data Privacy Office KPI Dashboard in Power BI
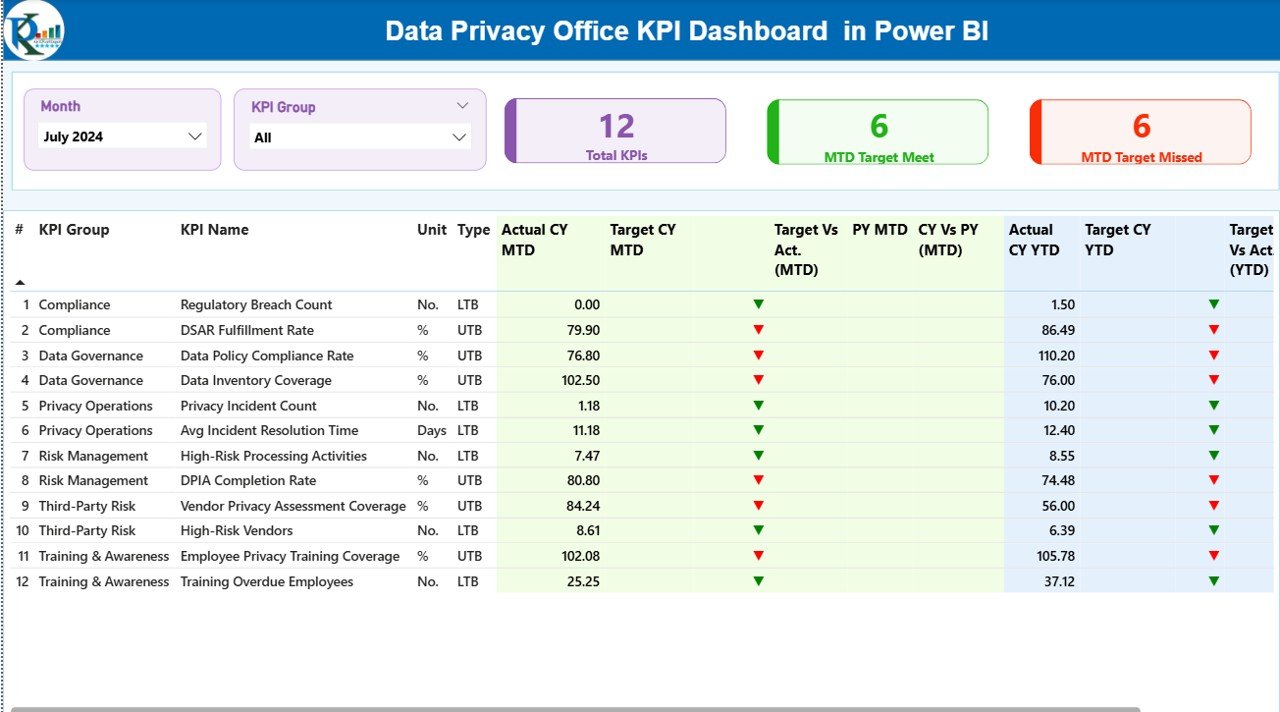
📊 Centralized Privacy KPI Monitoring
Track all data privacy KPIs from a single dashboard without juggling multiple files.
🎯 MTD & YTD Performance Tracking
Monitor Month-to-Date and Year-to-Date actuals, targets, and achievement status.
📈 Target vs Actual Comparison
Instantly see which KPIs meet targets and which require attention using icons and colors.
🔄 Current Year vs Previous Year Analysis
Compare CY and PY performance to understand trends and improvements.
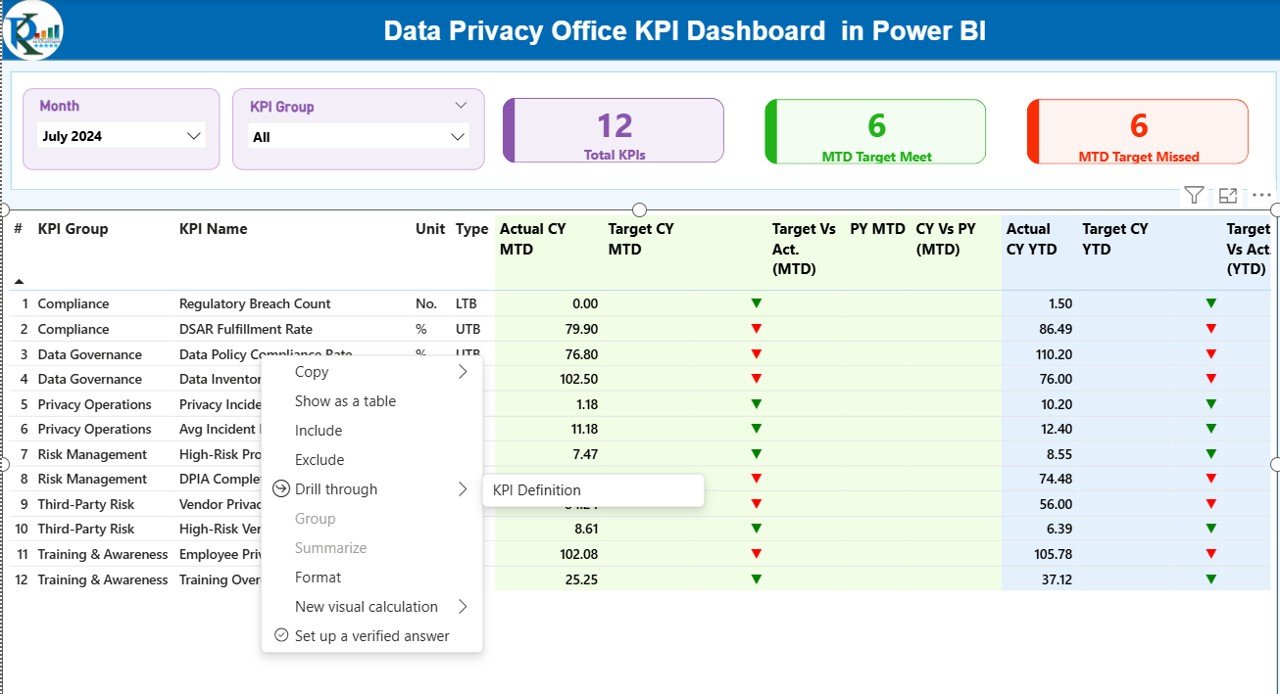
🧩 Interactive Slicers & Drill-Through
Filter data by month and KPI group, and drill into KPI definitions instantly.
📁 Excel-Based Data Entry
No complex systems—just structured Excel sheets that anyone can update.
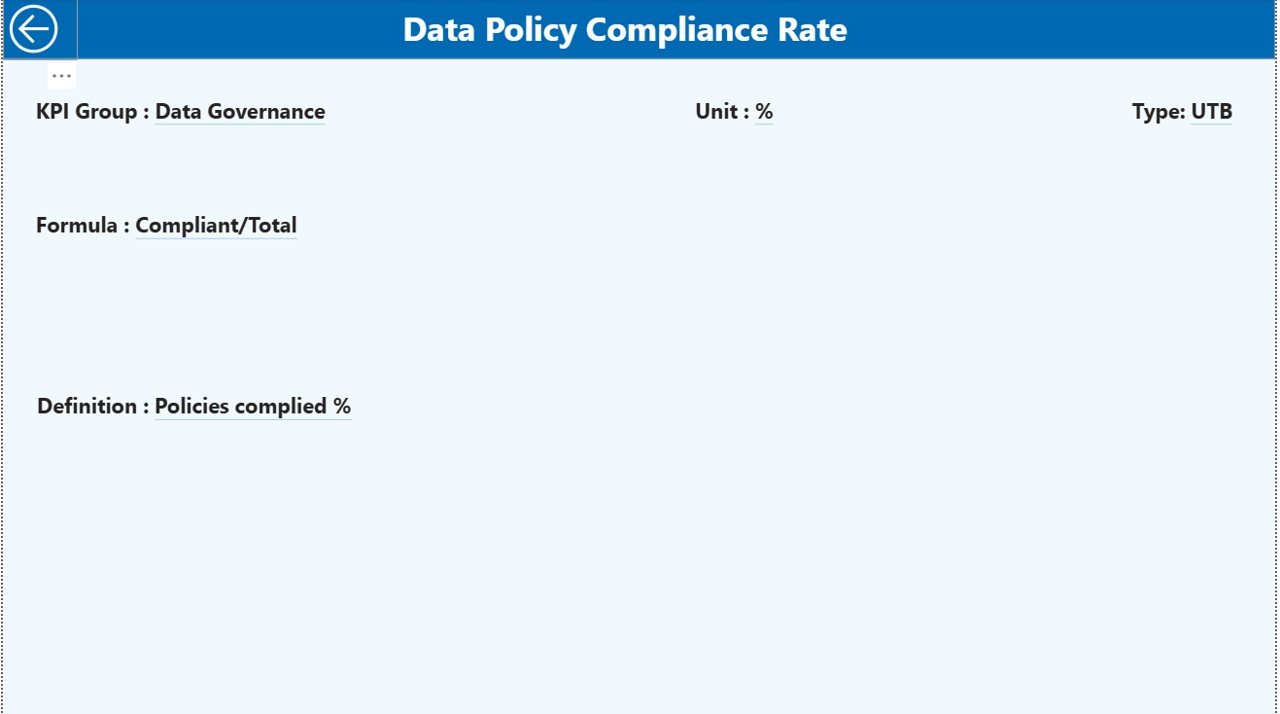
🛡️ Audit-Ready KPI Documentation
Clear KPI definitions, formulas, and types ensure transparency and consistency.
## 📦 What’s Inside the Data Privacy Office KPI Dashboard
This Power BI dashboard comes with a clean and structured setup designed for real-world use:
🗂 Excel Data File with 3 Sheets
-
Input_Actual – Capture MTD and YTD actual KPI values
-
Input_Target – Store MTD and YTD target values
-
KPI_Definition – Define KPI number, group, unit, formula, and type (LTB/UTB)
📄 Power BI Dashboard with 3 Pages
-
Summary Page – KPI cards, slicers, and a detailed performance table
-
KPI Trend Page – Combo charts showing actuals, targets, and PY comparison
-
KPI Definition Page – Drill-through reference page for KPI clarity
This structure keeps your data clean, consistent, and ready for audits.
## 🛠 How to Use the Data Privacy Office KPI Dashboard
Using this dashboard is simple—even for non-technical users:
1️⃣ Enter actual KPI values in the Input_Actual sheet
2️⃣ Update targets in the Input_Target sheet
3️⃣ Maintain KPI definitions in the KPI_Definition sheet
4️⃣ Refresh the Power BI dashboard
5️⃣ Analyze performance using slicers, tables, charts, and icons
That’s it! No advanced Power BI skills required.
## 👥 Who Can Benefit from This Data Privacy Office KPI Dashboard
This dashboard is ideal for:
👤 Data Privacy Officers (DPOs)
👤 Compliance & Governance Teams
👤 Risk Management Professionals
👤 Internal Audit Teams
👤 Senior Leadership & Management
Whether you manage a few KPIs or dozens, this dashboard scales easily with your organization.
Click here to read the Detailed Blog Post
Watch the step-by-step video tutorial:


Reviews
There are no reviews yet.