The Data Analytics KPI Dashboard in Excel is an essential tool for data analysts, business owners, and decision-makers looking to track and analyze key performance indicators (KPIs) in real-time. This customizable, interactive dashboard allows you to visualize and monitor various business metrics across different departments, making it easier to derive actionable insights and optimize operations.
Whether you are analyzing sales performance, marketing campaign results, or customer satisfaction metrics, this dashboard consolidates all your KPIs in one place, enabling you to make data-driven decisions. With clear and visually appealing charts, this Excel-based tool provides a powerful way to monitor business performance and improve strategic planning.
Key Features of the Data Analytics KPI Dashboard in Excel
📊 Comprehensive KPI Tracking
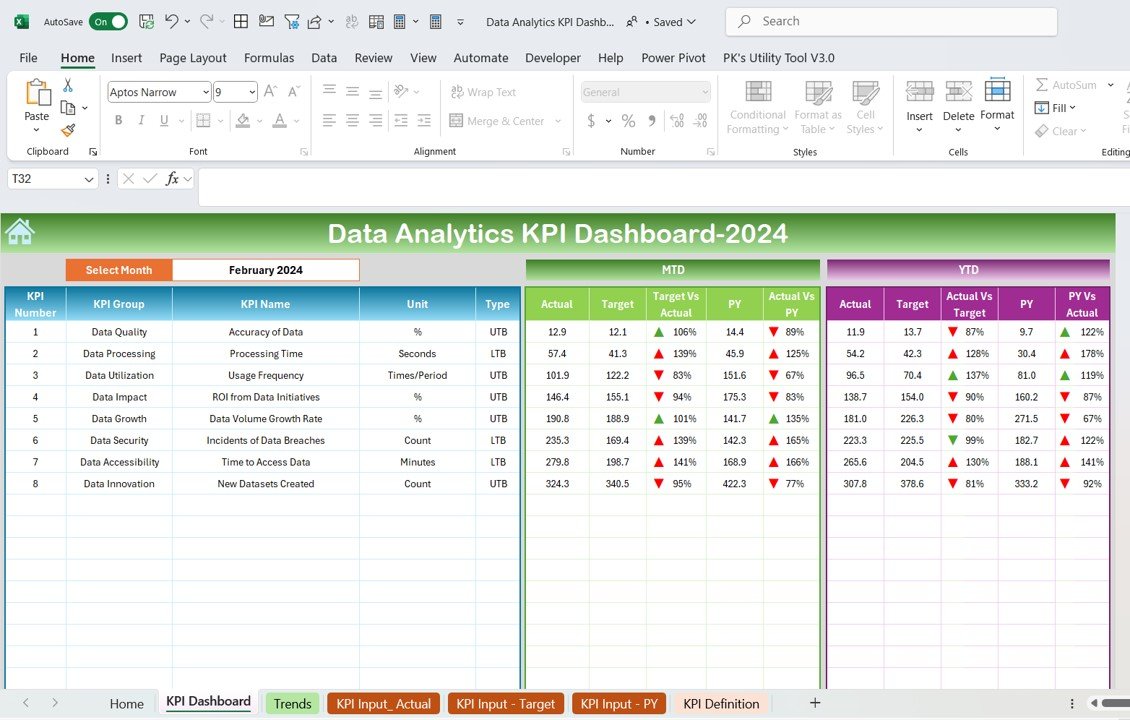
Monitor key business metrics such as sales, customer engagement, expenses, and growth rates. Track both historical data and real-time performance across various departments to get a full picture of your organization’s performance.
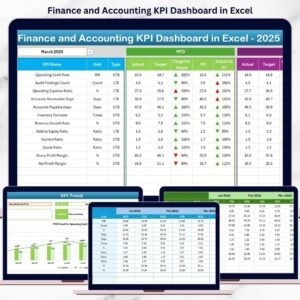
📈 Interactive Dashboards & Visualizations
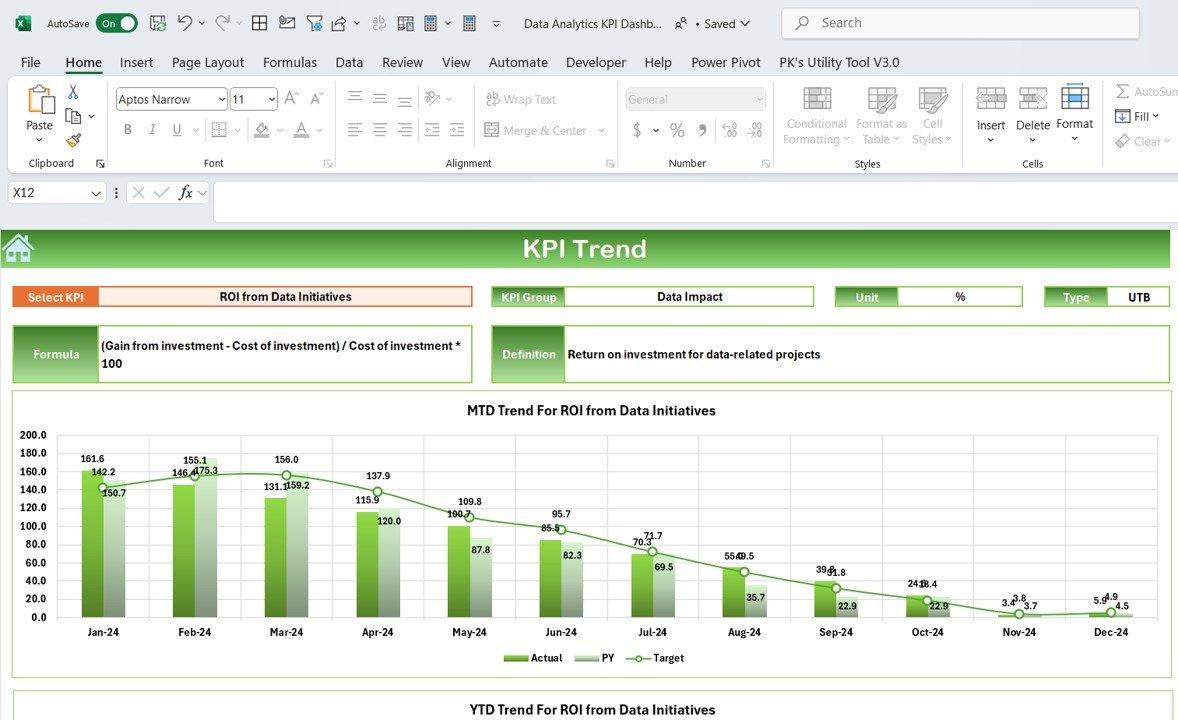
Use interactive charts and graphs to visualize your data in a meaningful way. Drill down into specific KPIs to gain deeper insights and assess trends over time. Customize the dashboard to suit your business needs.
💼 Department-Specific Metrics
Track performance across different departments, such as sales, marketing, finance, and customer support. Assess each department’s contribution to overall business goals and KPIs.
📅 Real-Time Data Insights
Get up-to-date insights into business performance with real-time data tracking. Identify areas for improvement and take proactive actions to optimize performance across departments.
🖥️ Customizable & User-Friendly Layout
The dashboard is fully customizable, allowing you to adjust data points, KPIs, and visualizations to match your specific business needs. Easy-to-use filters and slicers allow for quick data analysis and decision-making.
📉 Performance Benchmarking
Compare current performance with historical data and set benchmarks to measure progress. Use this feature to assess your growth, identify gaps, and take corrective actions when necessary.
Why You’ll Love the Data Analytics KPI Dashboard in Excel
✅ Make Informed Business Decisions
Leverage real-time data and interactive charts to make smarter, data-driven decisions. Track your KPIs and monitor business health with ease, ensuring you are always on top of your business performance.
✅ Track KPIs Across Departments
Monitor key metrics for every department in your organization. Assess sales, marketing, customer support, and other vital areas to ensure your business is moving in the right direction.
✅ Improve Operational Efficiency
By tracking the right KPIs, you can identify bottlenecks and inefficiencies in your operations. Use this information to streamline processes, reduce costs, and boost productivity.
✅ Monitor Business Growth & Performance
Track growth metrics and compare current performance against set targets and historical data. Identify opportunities for growth and capitalize on them with the right strategies.
✅ Fully Customizable & Scalable
Tailor the dashboard to suit your business’s unique needs. Whether you’re tracking a few key metrics or need to analyze hundreds, this dashboard is scalable and fully customizable.
What’s Inside the Data Analytics KPI Dashboard Template in Excel?
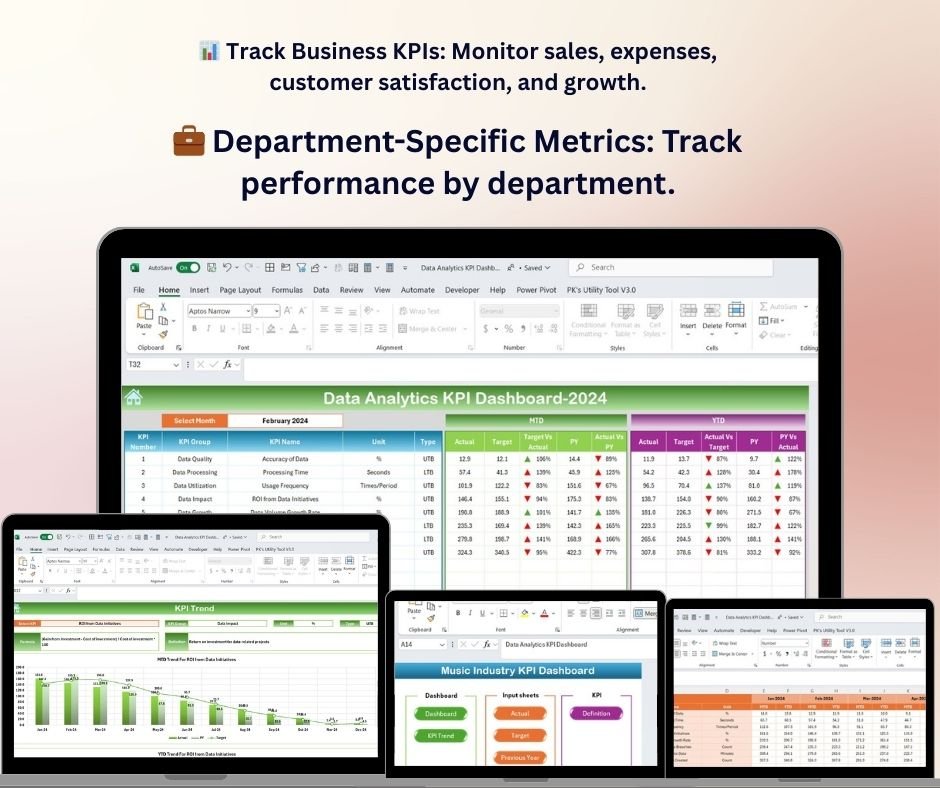
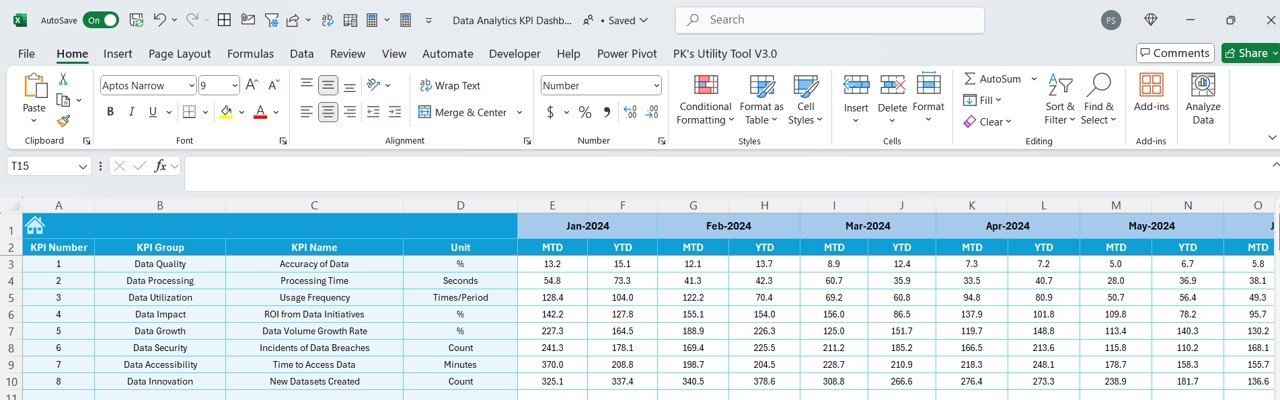
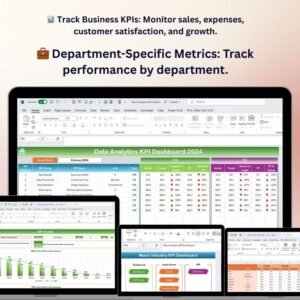
- Comprehensive KPI Tracking: Monitor sales, expenses, customer satisfaction, and growth rates.
- Interactive Data Visualizations: Visualize your business performance through dynamic charts, graphs, and tables.
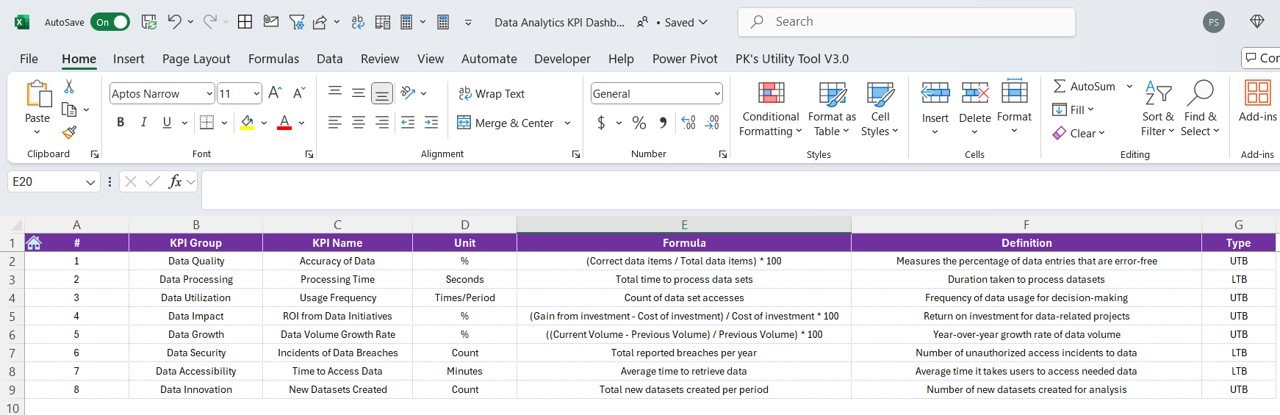
- Department-Specific Metrics: Track performance across departments such as sales, marketing, finance, and customer support.
- Real-Time Data Insights: Get the latest updates on your business metrics.
- Performance Benchmarking: Compare current metrics with historical data and set targets for growth.
- Customizable Layout: Adjust data points, KPIs, and visualizations as needed.
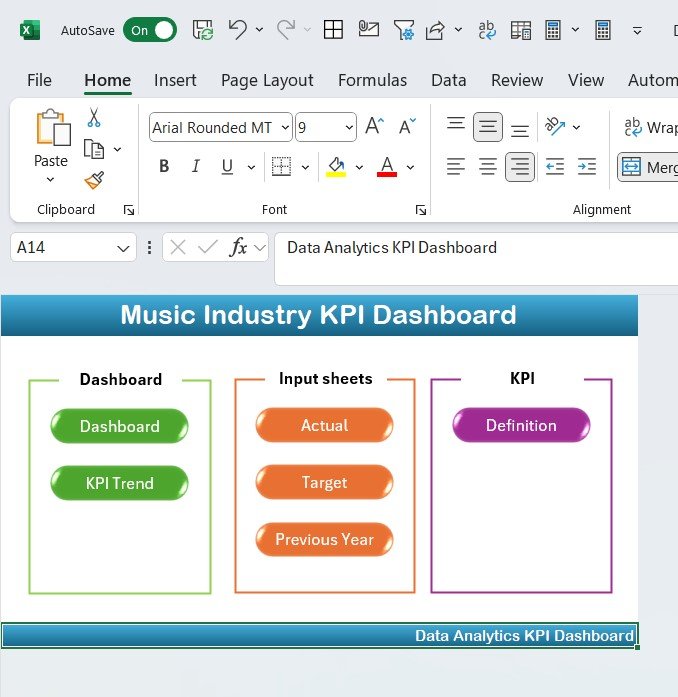
How to Use the Data Analytics KPI Dashboard in Excel
1️⃣ Download the Template: Get instant access to the Data Analytics KPI Dashboard in Excel.
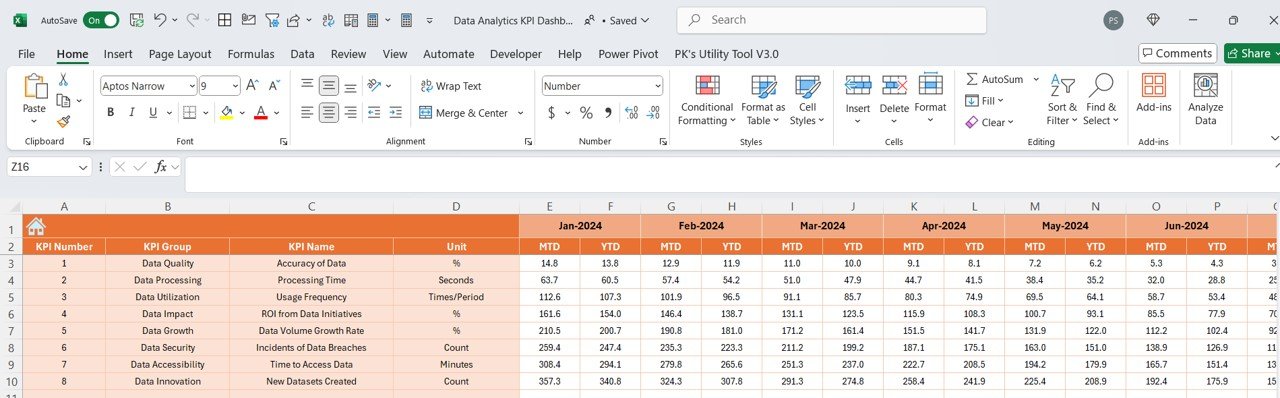
2️⃣ Input Your Business Data: Enter your key business metrics such as sales, expenses, customer satisfaction, etc.
3️⃣ Track & Monitor KPIs: Use the dashboard to track performance across various departments and KPIs.
4️⃣ Analyze & Optimize Performance: Use real-time insights to analyze trends and optimize business performance.
5️⃣ Generate Reports & Insights: Create custom reports to share with your team, stakeholders, or clients.
Who Can Benefit from the Data Analytics KPI Dashboard in Excel?
🔹 Business Owners & Executives
🔹 Data Analysts & Marketing Teams
🔹 Sales Managers & Customer Support Teams
🔹 Finance & Operations Managers
🔹 HR & Recruitment Teams
🔹 Small & Medium Businesses (SMBs)
🔹 Enterprises & Corporations with Complex Data Analytics Needs
Track and optimize your business performance across departments with the Data Analytics KPI Dashboard in Excel. Monitor sales, expenses, customer satisfaction, and much more to drive data-driven growth.
Click here to read the Detailed blog post
Visit our YouTube channel to learn step-by-step video tutorials
Youtube.com/@PKAnExcelExpert


Reviews
There are no reviews yet.