
The Cybersecurity Dashboard in Power BI is a powerful, ready-to-use analytics solution that helps organizations monitor, analyze, and strengthen their cyber-defense posture — all in one interactive platform.
In today’s threat-filled digital landscape, even the most secure companies face risks like ransomware, phishing, and insider attacks. Managing such threats through spreadsheets or static reports can leave gaps and delays. The Cybersecurity Dashboard in Power BI bridges this gap by converting complex security data into dynamic visuals that drive faster, smarter decisions.
Whether you’re a CISO, IT manager, or data analyst, this dashboard delivers real-time insight into incident patterns, risk scores, and financial impacts — empowering your team to act before threats escalate.
✨ Key Features of the Cybersecurity Dashboard in Power BI
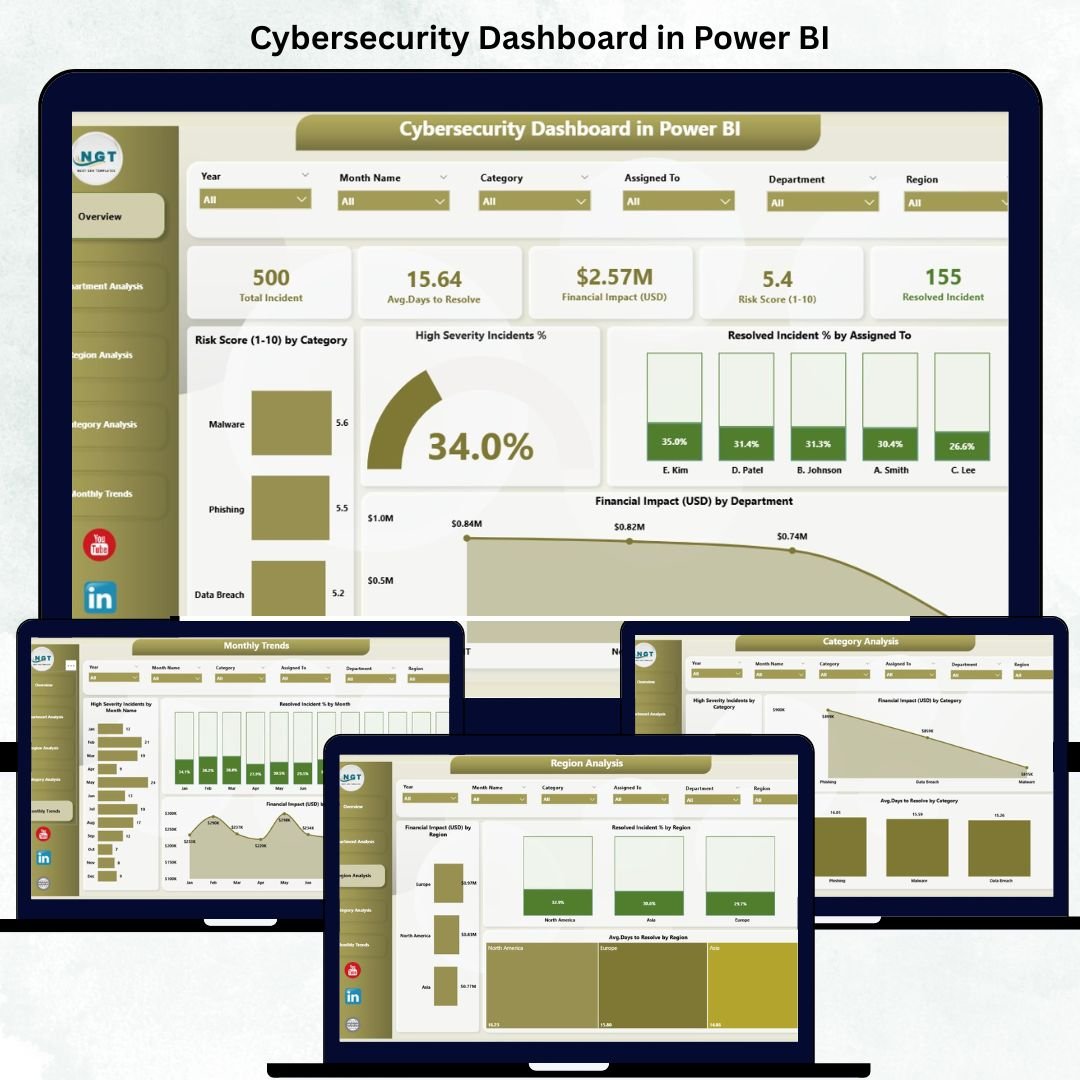
✅ 📊 Overview Page – Your Security Command Center
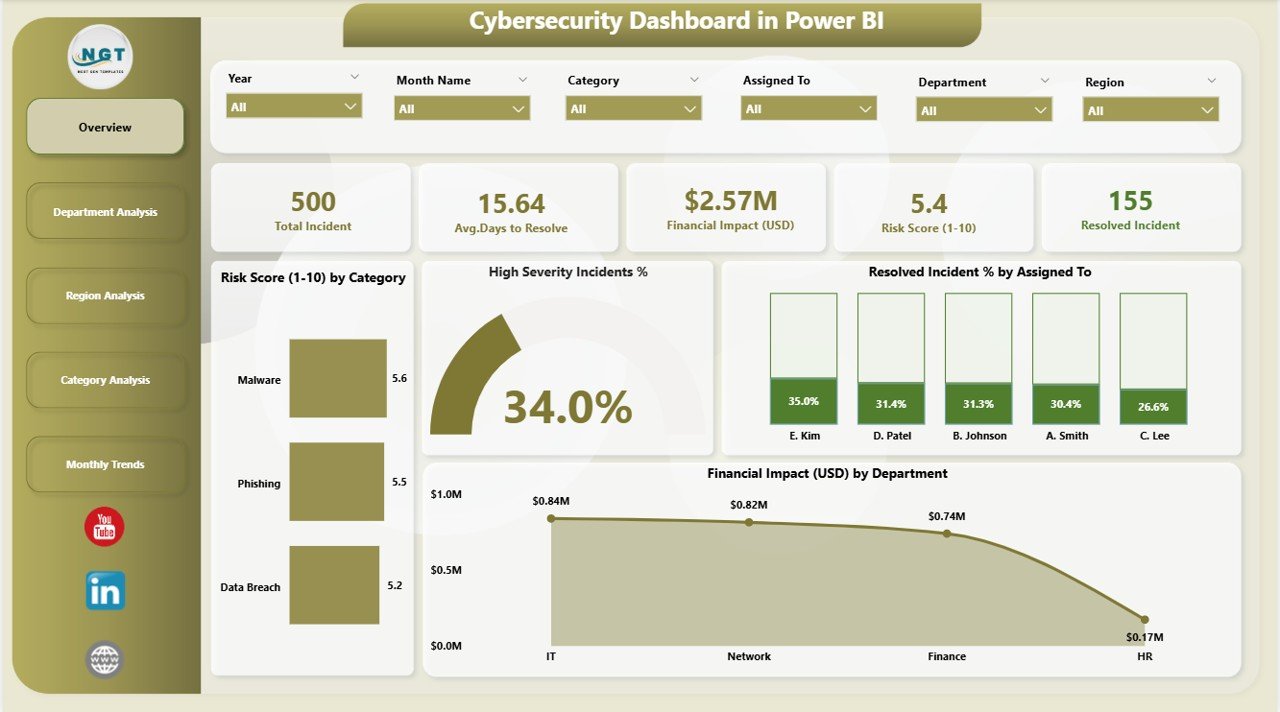
Gain a quick snapshot of your organization’s cybersecurity health.
Includes:
-
KPI Cards for Total Incidents, Average Risk Score, Resolved Incidents %, and High-Severity Rate.
-
Charts showing:
• Risk Score (1-10) by Category
• High-Severity Incident %
• Resolved Incident % by Analyst
• Financial Impact (USD) by Department
🎯 Instantly evaluate overall risk exposure and response efficiency.
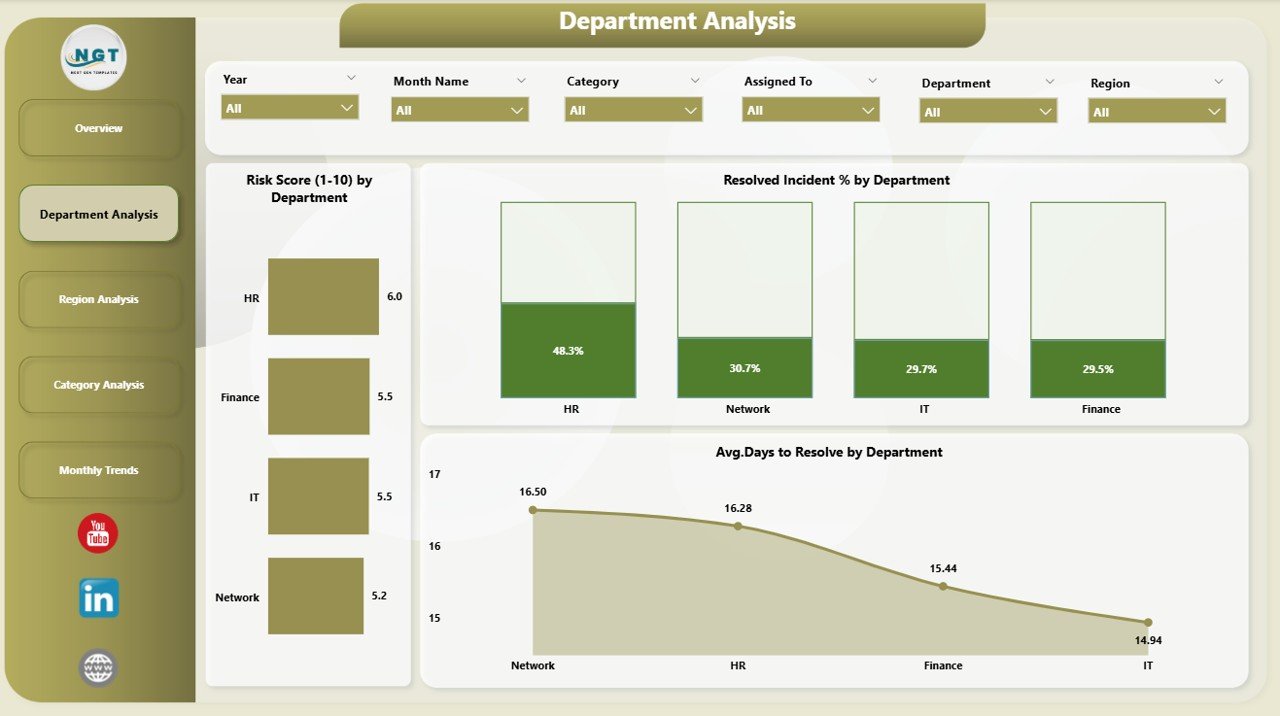
✅ 🏢 Department Analysis Page – Measure Internal Exposure
Identify which departments face the most risk and how effectively they respond.
-
Risk Score (1-10) by Department
-
Resolved Incident % by Department
-
Average Days to Resolve by Department
💡 Pinpoint slow response areas and prioritize training or resources.
✅ 🌍 Region Analysis Page – Visualize Global Threat Patterns
For organizations operating across regions or countries.
-
Financial Impact (USD) by Region
-
Resolved Incident % by Region
-
Avg. Days to Resolve by Region
📈 Compare regional performance and optimize cyber investments globally.
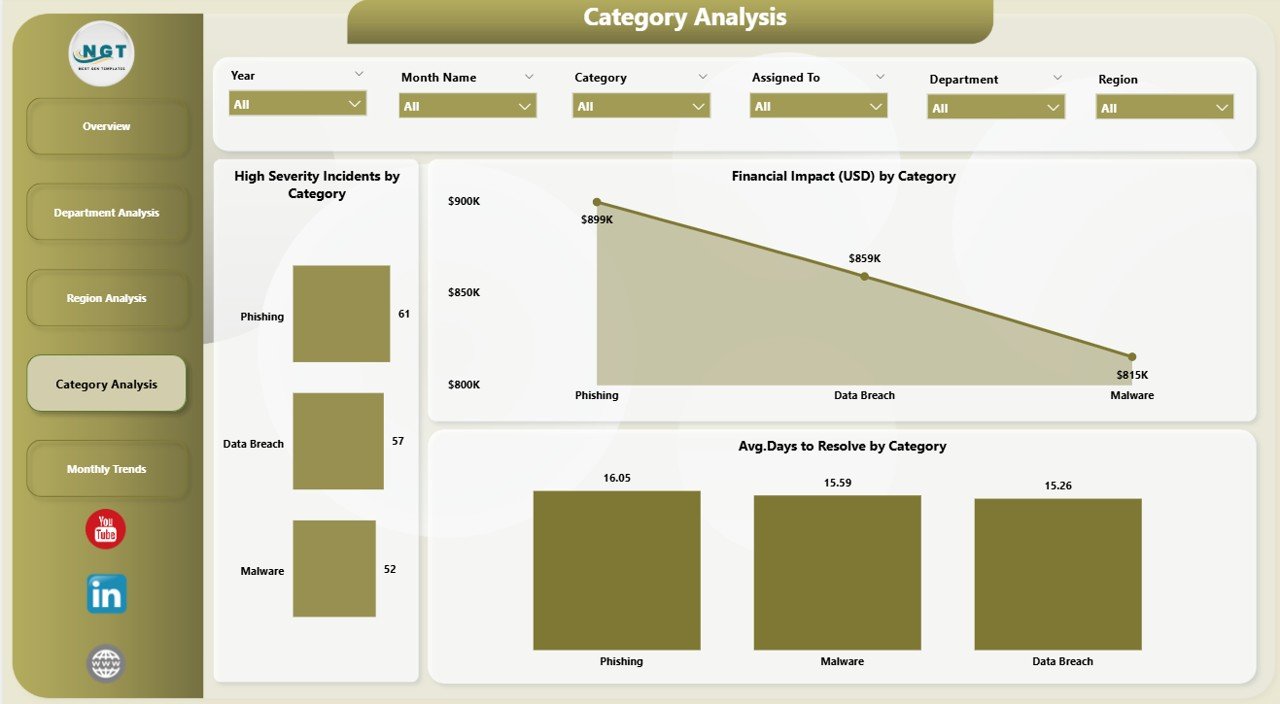
✅ 🧩 Category Analysis Page – Understand Threat Types
Not all attacks are equal — analyze by category.
-
Financial Impact (USD) by Category
-
High-Severity Incidents by Category
-
Avg. Days to Resolve by Category
🔍 Identify costliest attack types and focus on critical response areas.
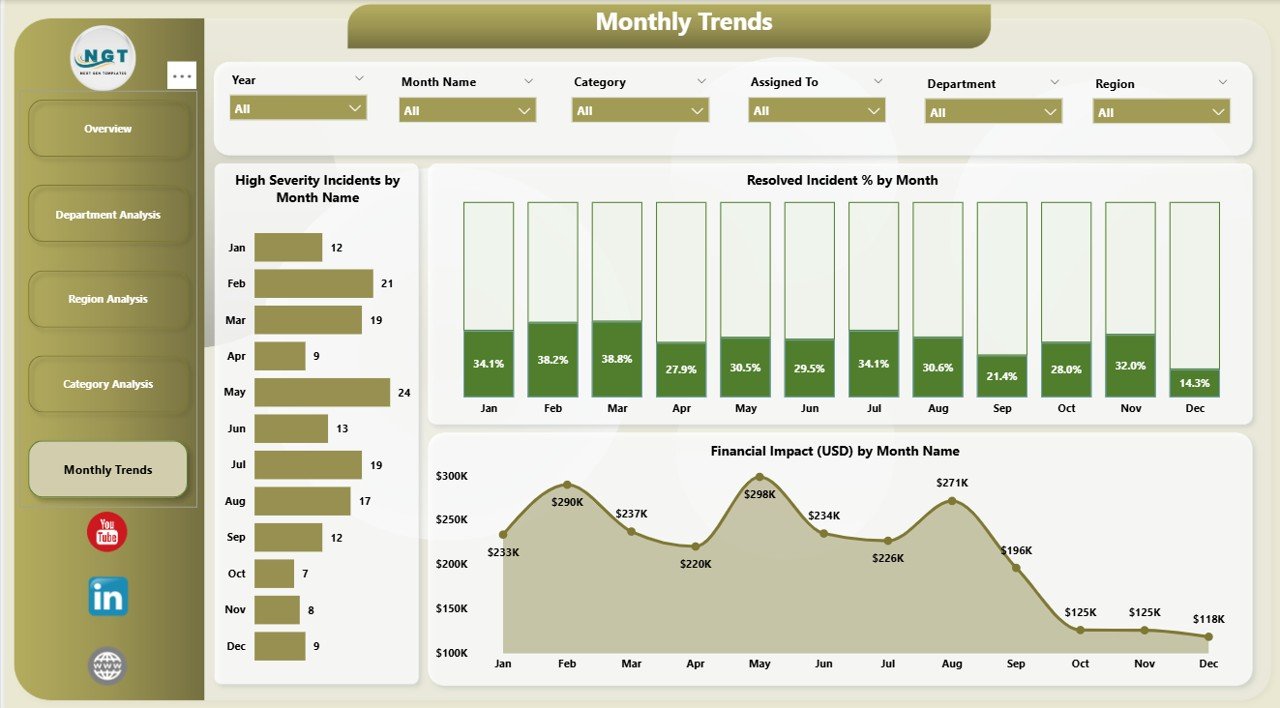
✅ 📅 Monthly Trends Page – Track Performance Over Time
Spot patterns and evaluate improvement initiatives.
-
Financial Impact (USD) by Month
-
High-Severity Incidents by Month and Category
-
Resolved Incident % by Month
📊 Monitor long-term progress and forecast emerging risks.
⚙️ How It Works
1️⃣ Connect Data Sources – Integrate Excel, SIEM logs, or cloud security reports.
2️⃣ Refresh Automatically – Power BI updates visuals in real time.
3️⃣ Analyze KPIs – Drill down by department, region, or threat type.
4️⃣ Share Insights – Publish to Power BI Service for secure access across teams.
💡 No coding needed — just connect, refresh, and protect.
👥 Who Can Use This Dashboard
🔐 CISOs & Security Leaders – Gain organization-wide threat visibility.
💻 IT Operations Teams – Monitor incident resolution rates and risk scores.
🧠 Data Analysts & BI Professionals – Visualize patterns for strategic insight.
💰 Finance Managers – Quantify financial impact of cyber incidents.
📑 Compliance Officers – Track security metrics aligned with ISO 27001 or GDPR.
💡 Advantages of Using the Cybersecurity Dashboard in Power BI
✅ Real-Time Threat Monitoring – Get instant updates on active incidents and risks.
✅ Unified Data View – Eliminate silos by merging all security data in one dashboard.
✅ Faster Decision-Making – Visual alerts and color coding speed up executive response.
✅ Improved Collaboration – Share live dashboards across departments and regions.
✅ Financial Clarity – Track economic impact and justify cyber budget allocations.
✅ Customizable Interface – Adjust KPIs, filters, and themes to match your organization.
📈 From incident tracking to board-level reporting, this dashboard simplifies every step of cyber risk management.
🔐 Why Choose Power BI for Cybersecurity Analytics
-
Connects with Excel, Azure Sentinel, Splunk, and cloud APIs.
-
Provides AI-based forecasting and trend detection.
-
Supports role-based security and data encryption.
-
Accessible from desktop, web, and mobile.
Power BI turns your cyber metrics into a real-time defense dashboard — fast, scalable, and secure.
📊 Future Enhancements & Opportunities
🔧 Integrate predictive AI models to forecast attacks.
📡 Enable real-time alerting for critical incidents.
💬 Add sentiment or user feedback analysis.
📱 Deploy a mobile security command center for executives.
Each enhancement brings the dashboard closer to a complete cyber intelligence platform.
🧠 Best Practices
✅ Keep visuals focused — track only essential KPIs.
✅ Apply consistent color coding (Red = High Risk).
✅ Schedule automatic data refreshes for accuracy.
✅ Use role-based permissions for data security.
✅ Align KPIs with business and compliance goals.
Following these practices ensures your dashboard remains accurate, secure, and impactful.
🎥 Learn More
Visit our YouTube channel for step-by-step video tutorials and demonstrations of the Cybersecurity Dashboard in Power BI.


Reviews
There are no reviews yet.