

Running a cruise line business requires constant control over operations, revenue, and guest experience 🚢. From passenger occupancy and onboard revenue to fuel costs, service quality, and operational efficiency, cruise companies track dozens of KPIs every single month. However, when teams rely on disconnected Excel sheets, manual reports, and delayed analysis, leadership loses real-time visibility into performance. That is exactly where a Cruise Lines KPI Dashboard in Excel becomes extremely valuable.
The Cruise Lines KPI Dashboard in Excel is a ready-to-use, interactive performance monitoring solution designed specifically for cruise industry operations. Instead of reviewing raw numbers across multiple files, cruise management teams can track Month-to-Date (MTD) and Year-to-Date (YTD) performance, compare Actual vs Target vs Previous Year, and analyze trends using clear visual indicators 📊.
Because the dashboard works entirely in Microsoft Excel, it is easy to deploy across departments without any additional software or technical setup. As a result, cruise companies move from reactive reporting to data-driven operational control.
✅ Key Features of Cruise Lines KPI Dashboard in Excel
The Cruise Lines KPI Dashboard in Excel is designed to deliver instant performance clarity across cruise operations 🔍.
It combines structured data input with automated calculations and visuals, allowing leadership teams to review performance in seconds instead of hours.
Key highlights include:
-
MTD and YTD KPI tracking
-
Actual vs Target vs Previous Year comparison
-
Visual performance indicators using up and down arrows
-
Interactive month and KPI selection
-
KPI-level trend analysis
Because calculations and visuals update automatically, teams reduce manual effort and focus on insights.
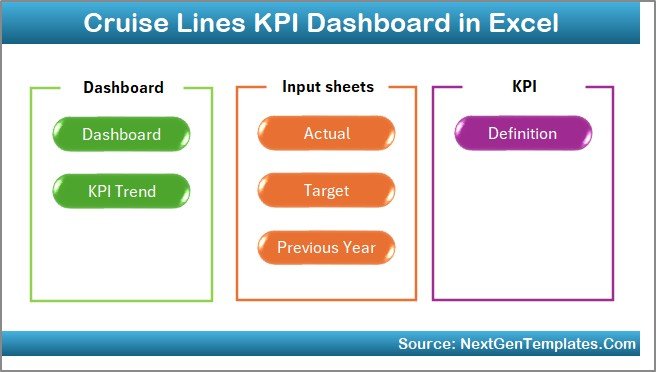
📦 What’s Inside the Cruise Lines KPI Dashboard in Excel
This product includes seven well-structured Excel worksheets, each serving a specific analytical purpose:

1️⃣ Home Sheet
The Home Sheet acts as the navigation hub 🧭.
It provides:
-
A clean index layout
-
Six navigation buttons
-
One-click access to all major dashboard sheets
This ensures even first-time users can navigate comfortably.
2️⃣ Dashboard Sheet
The Dashboard Sheet is the core performance view.
Month Selection
A month dropdown in cell D3 allows users to switch months instantly. Once selected, all KPIs, charts, and indicators update automatically.
MTD Performance Section
-
MTD Actual
-
MTD Target
-
MTD Previous Year
-
Target vs Actual variance
-
Previous Year vs Actual variance
-
Up/down arrows showing performance direction
YTD Performance Section
-
YTD Actual
-
YTD Target
-
YTD Previous Year
-
Target vs Actual variance
-
Previous Year vs Actual variance
This structure helps leadership analyze short-term and long-term performance together.
3️⃣ KPI Trend Sheet
The KPI Trend Sheet supports deep KPI-level analysis 📈.
Users select a KPI from the dropdown in cell C3, and the sheet displays:
-
KPI Group
-
KPI Unit
-
KPI Type (Lower the Better / Upper the Better)
-
KPI Formula
-
KPI Definition
Trend Charts
-
MTD Trend: Actual, Target, Previous Year
-
YTD Trend: Actual, Target, Previous Year
These charts help identify patterns, seasonality, and performance gaps.
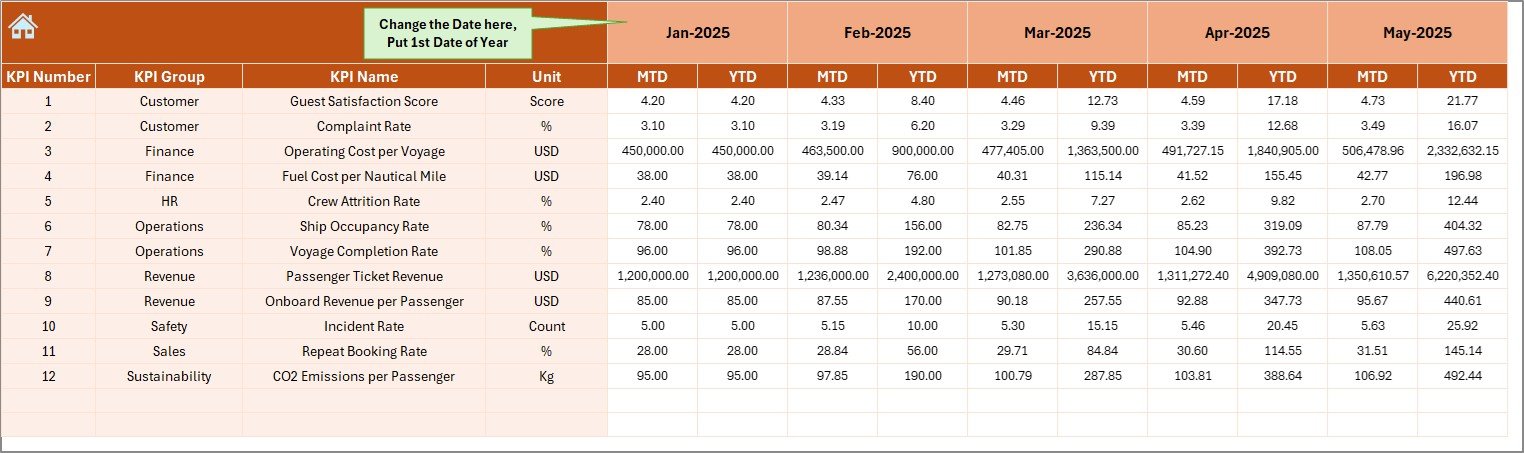
4️⃣ Actual Numbers Input Sheet
This sheet captures real operational data.
Users:
-
Define the starting month of the year in cell E1
-
Enter MTD Actual values
-
Enter YTD Actual values
Clear structure ensures error-free data entry.
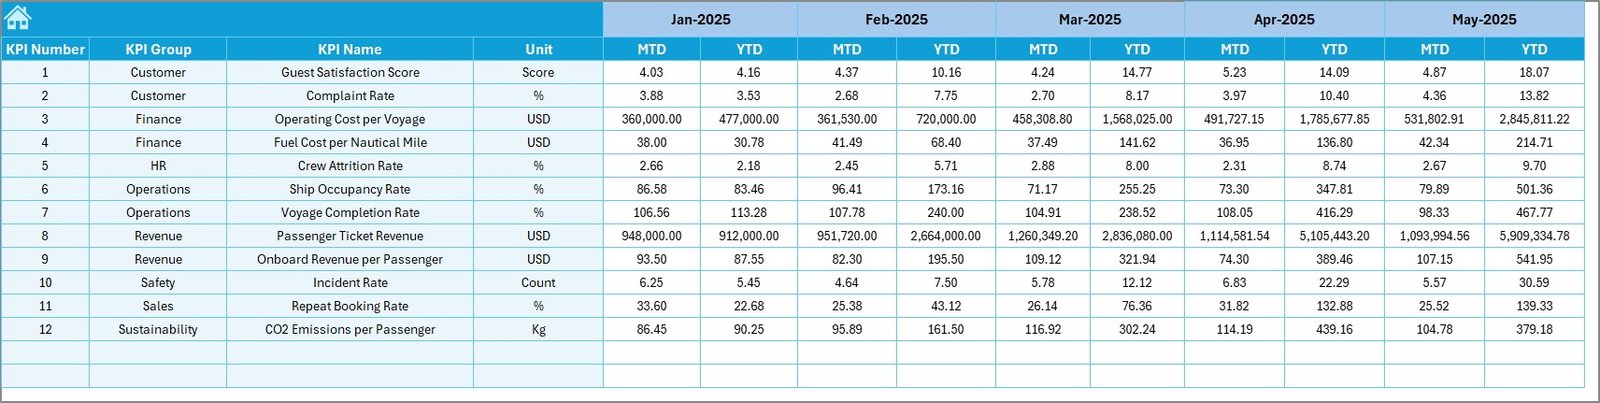
5️⃣ Target Sheet
The Target Sheet stores KPI benchmarks.
For each KPI, users enter:
-
MTD Target values
-
YTD Target values
Targets drive variance calculations and performance indicators automatically.
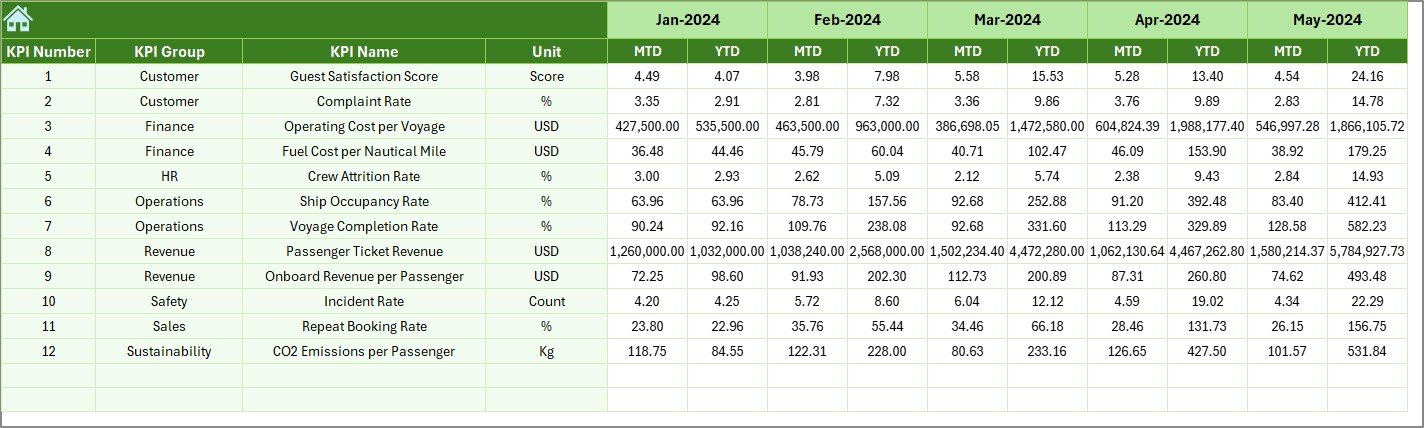
6️⃣ Previous Year Numbers Sheet
This sheet stores last year’s performance data.
It enables:
-
Year-over-year comparison
-
Long-term trend analysis
-
Growth and decline tracking
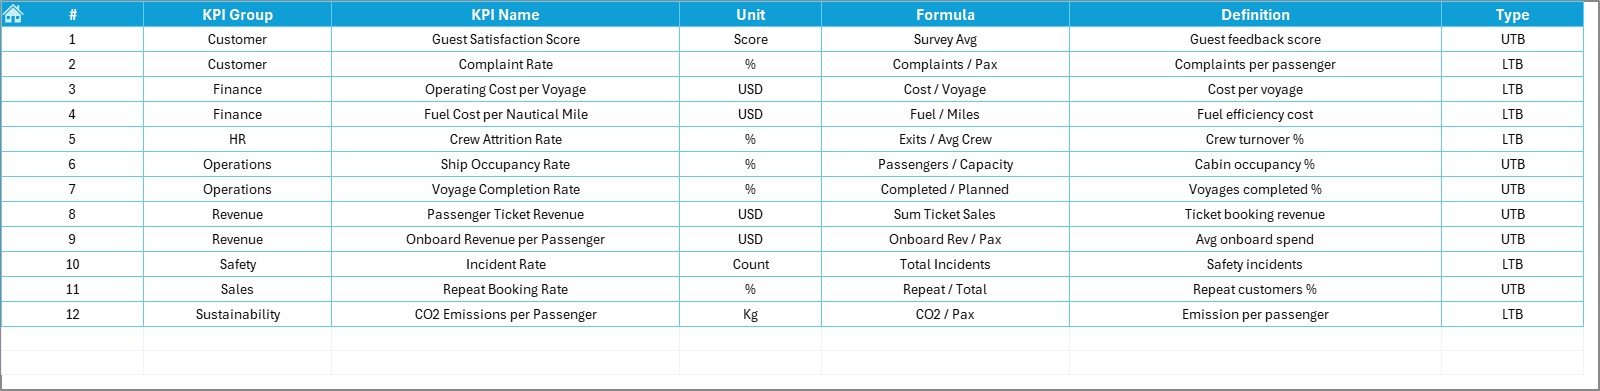
7️⃣ KPI Definition Sheet
The KPI Definition Sheet acts as the foundation of clarity.
It stores:
-
KPI Name
-
KPI Group
-
KPI Unit
-
KPI Formula
-
KPI Definition
This ensures consistency and transparency across teams.
🛠️ How to Use the Cruise Lines KPI Dashboard in Excel
Using the dashboard is simple and intuitive 👍.
First, enter actual, target, and previous year data in the respective input sheets.
Next, select the required month from the dashboard dropdown.
Then, review MTD and YTD performance with arrows and variances.
Finally, use the KPI Trend Sheet to analyze detailed trends.
Because everything updates automatically, teams always work with current insights.
👥 Who Can Benefit from This Cruise Lines KPI Dashboard
This dashboard is ideal for:
-
Cruise Line Executives
-
Operations Managers
-
Finance and Revenue Teams
-
Fleet Management Teams
-
Business Analysts
-
Strategy and Planning Teams
It works for both small cruise operators and large cruise lines.
🔗 Click here to read the Detailed blog post
🎥 Visit our YouTube channel to learn step-by-step video tutorials
👉 https://www.youtube.com/@PKAnExcelExpert


