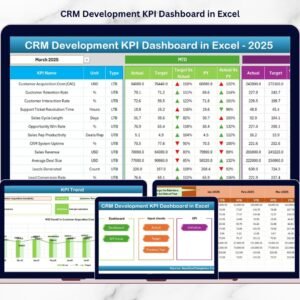
CRM Development KPI Dashboard are the backbone of modern business growth. However, CRM development teams often struggle to measure performance clearly. They track multiple KPIs, update targets, compare actual results, and prepare reports for leadership — all while managing customer data and automation systems.
If you are using scattered Excel sheets and manual reports, you are wasting valuable time.
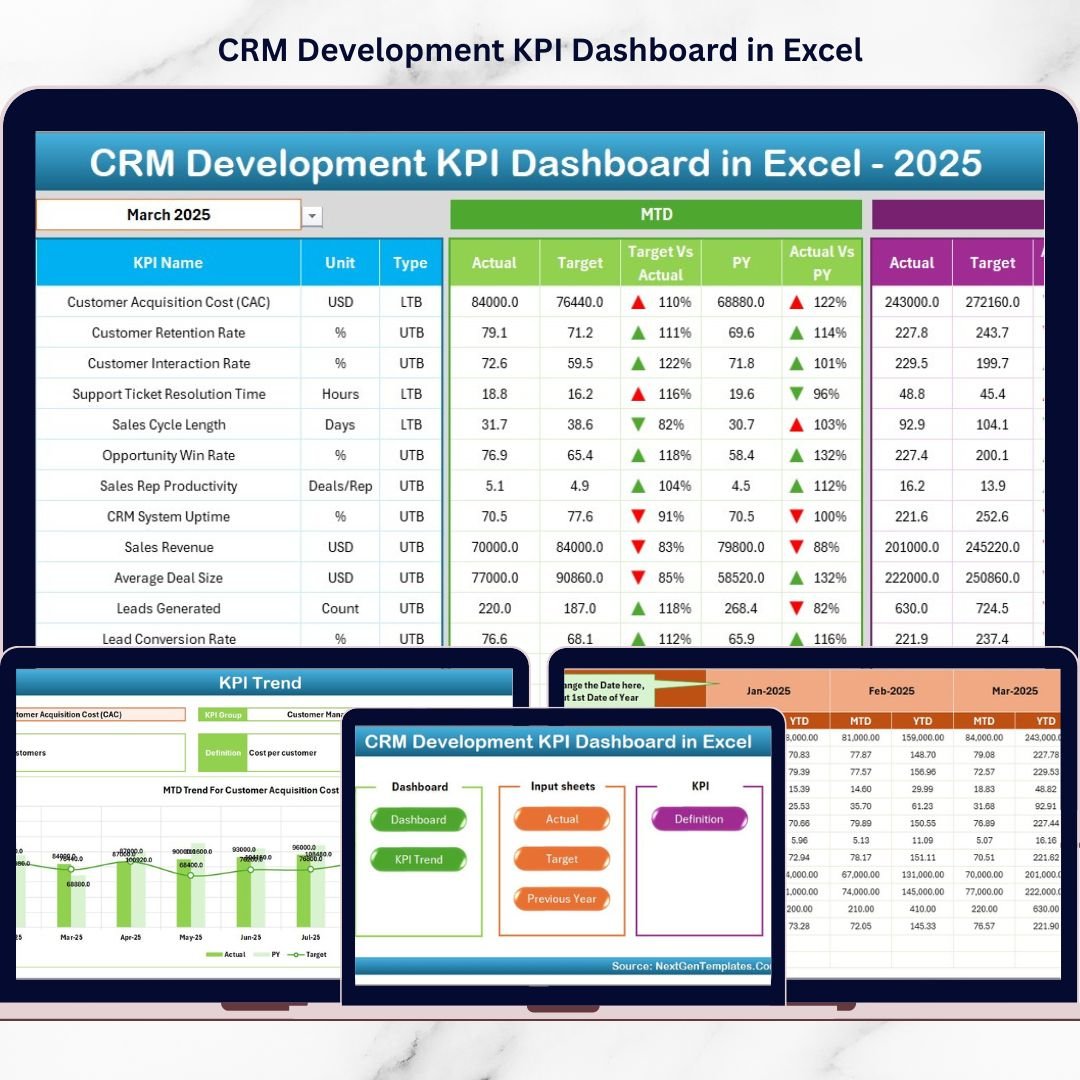
That is why we created the CRM Development KPI Dashboard in Excel — a powerful, ready-to-use template that centralizes CRM performance tracking in one structured system.
This dashboard helps you monitor MTD and YTD performance, compare Actual vs Target, analyze Previous Year results, and study KPI trends — all in a professional, automated Excel file.
If you want clarity, accountability, and faster decision-making, this dashboard is built for you.
🚀 Key Feature of CRM Development KPI Dashboard in Excel
This dashboard includes 7 structured worksheets, each designed to simplify CRM KPI management:
🏠 Home Sheet – Professional navigation hub with clickable buttons for instant sheet access.
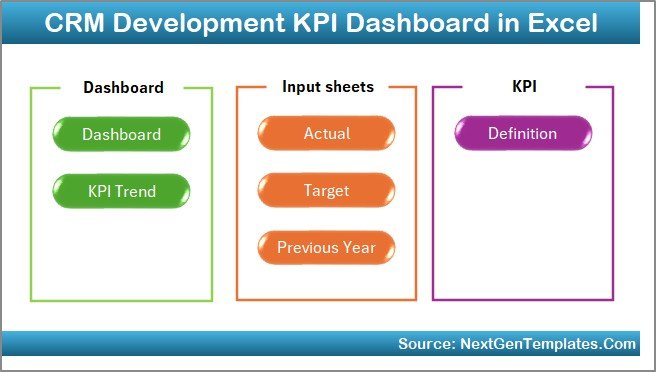
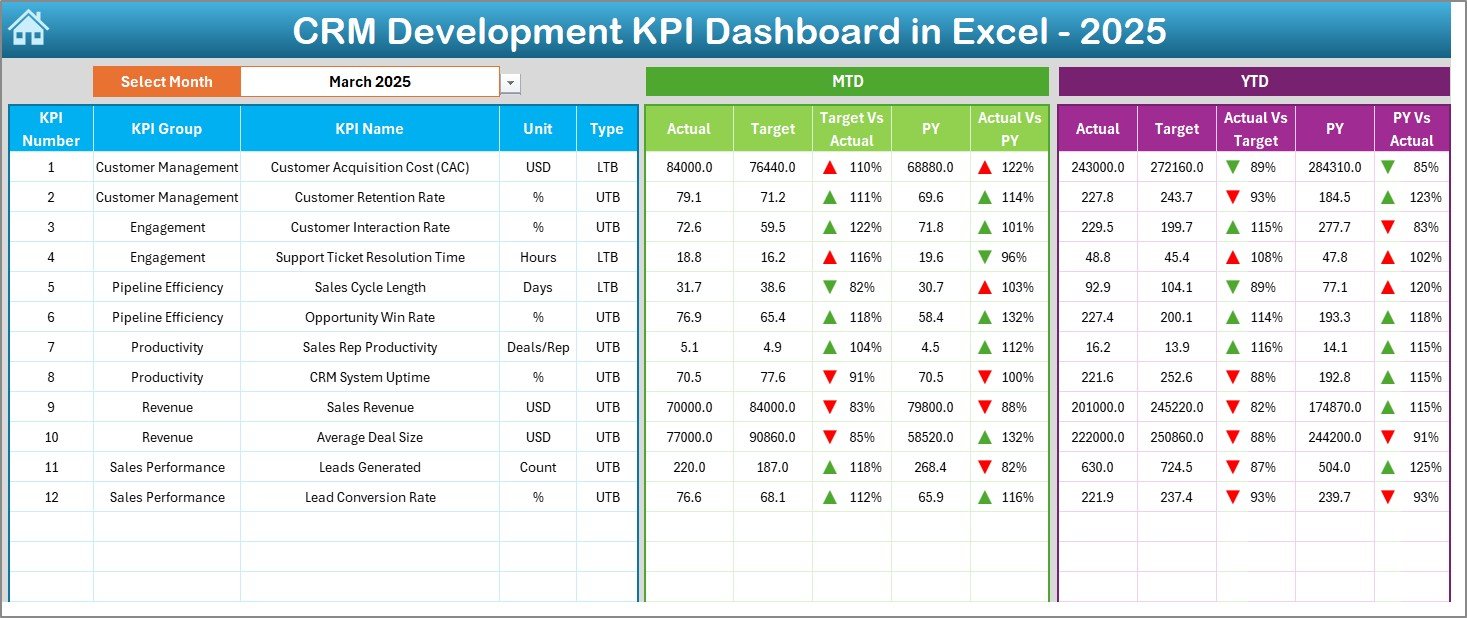
📊 Dashboard Sheet – Dynamic performance page with Month Selector (Cell D3), MTD & YTD tracking, and conditional formatting arrows.
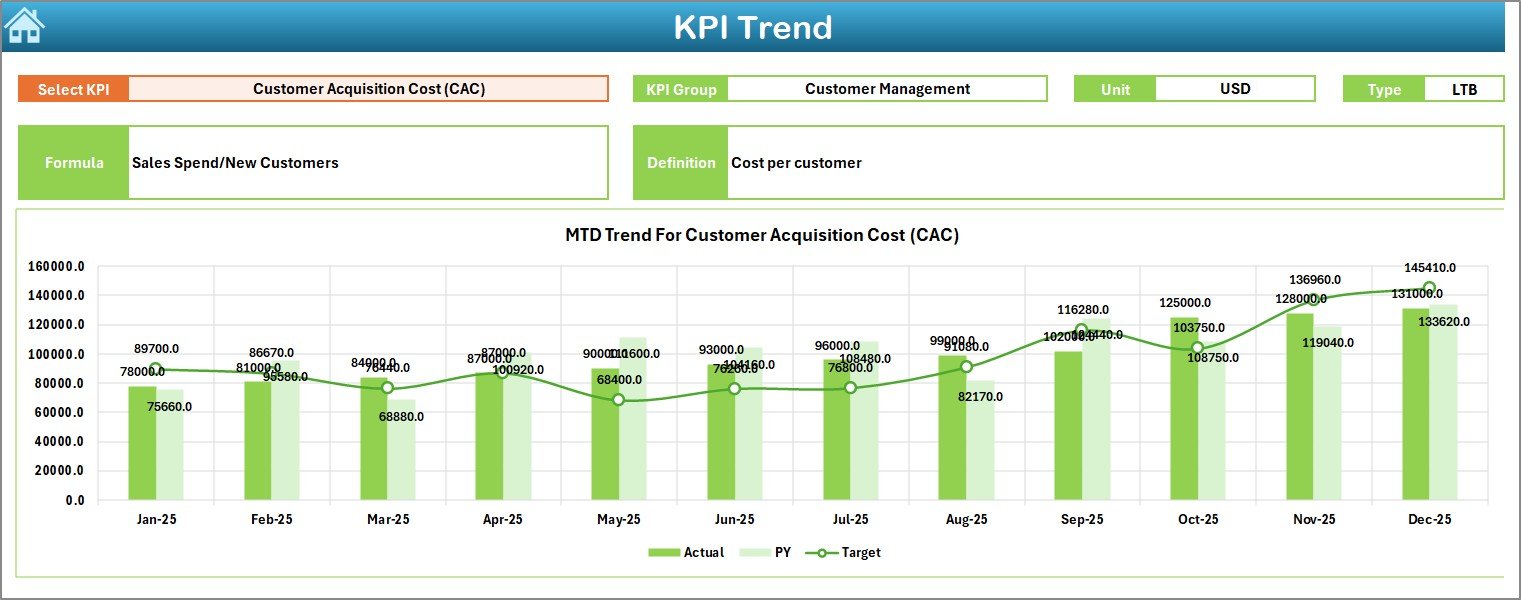
📈 KPI Trend Sheet – Select KPI (Cell C3) and analyze MTD & YTD trend charts with Actual vs Target vs PY comparisons.
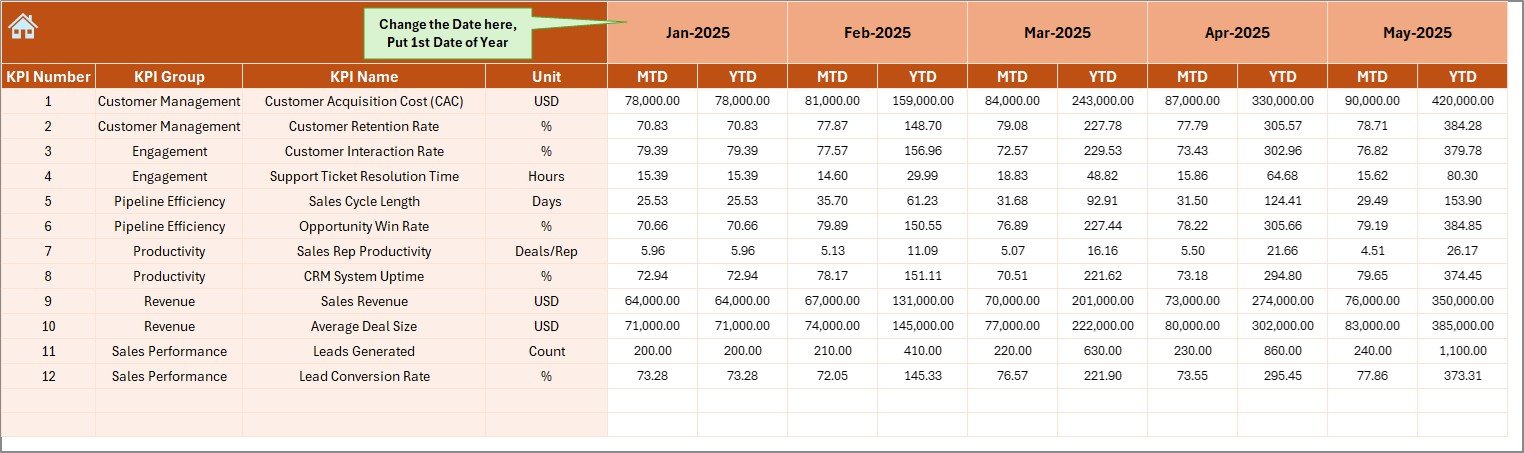
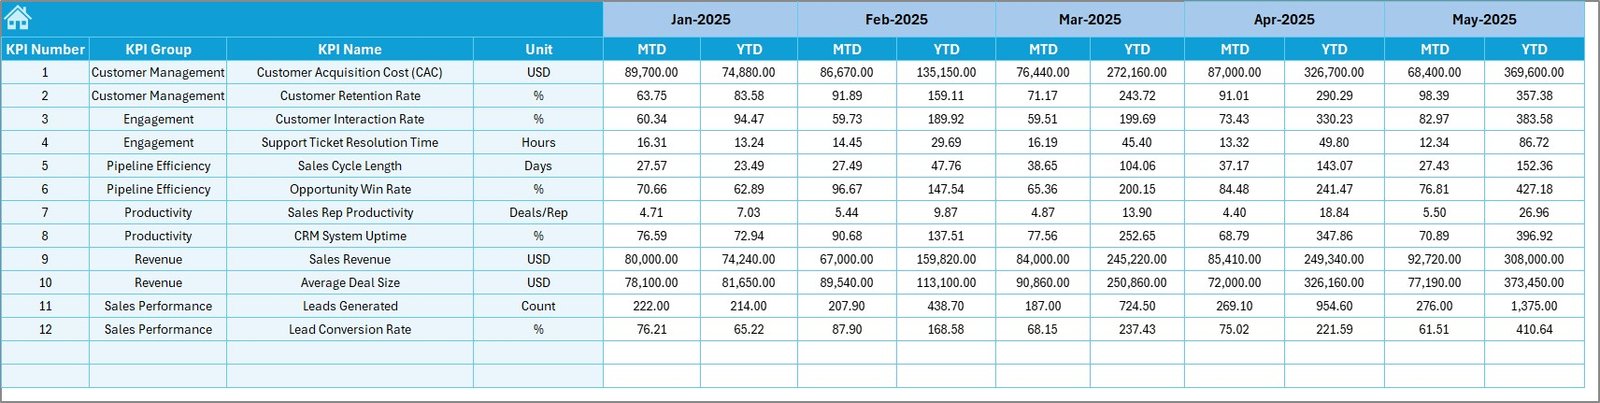
📝 Actual Numbers Input Sheet – Controlled data entry page with month reference setup.
🎯 Target Sheet – Structured target management for monthly MTD & YTD goals.
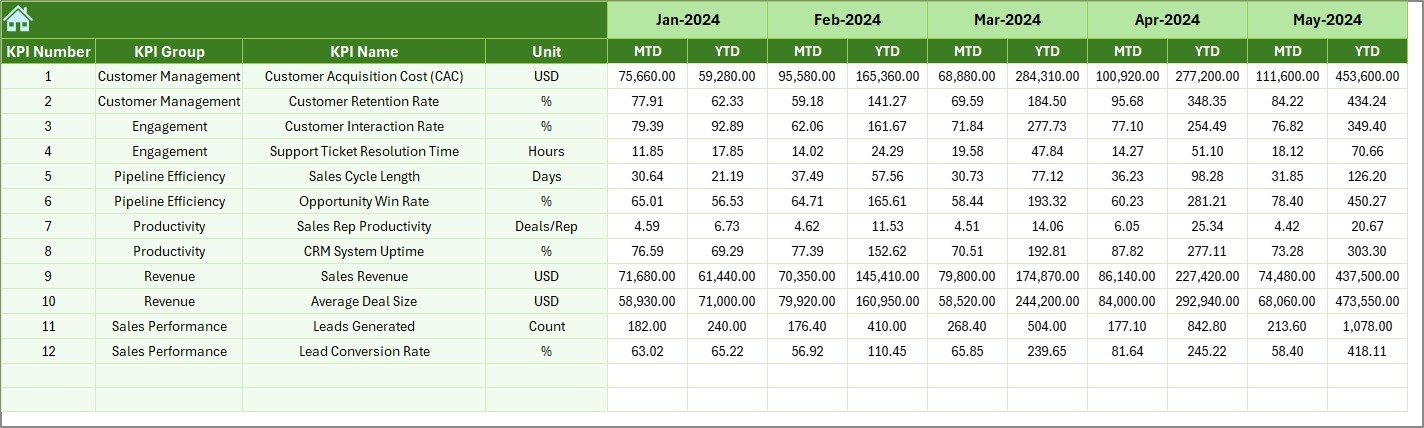
📅 Previous Year Sheet – Year-on-year performance comparison.
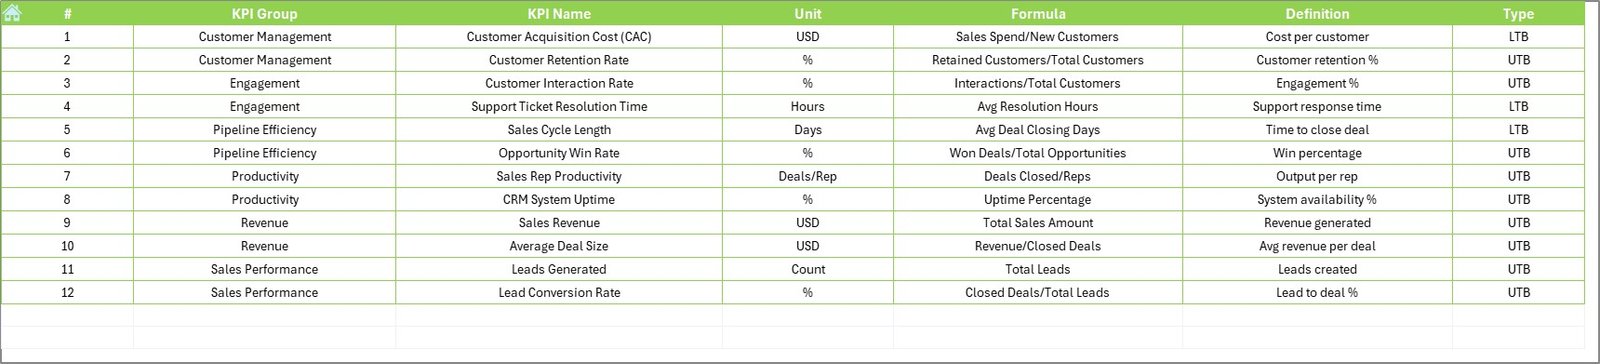
📘 KPI Definition Sheet – Define KPI Name, Group, Unit, Formula, and Type (LTB/UTB).
Because everything is interconnected, your reports update automatically when you select a different month.
📦 What’s Inside the CRM Development KPI Dashboard in Excel
This ready-to-use Excel file includes:
✔ Dynamic Month Selection (Cell D3)
✔ Automated MTD & YTD calculations
✔ Target vs Actual comparison
✔ Previous Year vs Actual comparison
✔ Up & Down arrow indicators for quick performance view
✔ Trend charts for deep KPI analysis
✔ Organized data entry sheets
✔ Fully customizable KPI framework
You don’t need complex BI tools. You only need Microsoft Excel.
🛠 How to Use the CRM Development KPI Dashboard in Excel
Using this dashboard is simple:
1️⃣ Enter the starting month in the Actual Input sheet (Cell E1).
2️⃣ Input MTD and YTD actual values monthly.
3️⃣ Enter target values in the Target Sheet.
4️⃣ Add previous year numbers for comparison.
5️⃣ Select the month from the drop-down in Cell D3.
The dashboard updates instantly.
For example:
If Lead Conversion Rate drops below target, the red arrow highlights it immediately.
If Customer Retention improves compared to last year, the green arrow confirms progress.
If Sales Pipeline Value grows month-over-month, the trend chart shows it clearly.
Because the system is automated, reporting becomes faster and more reliable.
👥 Who Can Benefit from This CRM Development KPI Dashboard in Excel
This dashboard is ideal for:
💼 CRM Development Teams
📊 CRM Analysts
📈 Sales Operations Managers
🚀 SaaS Companies
📣 Marketing Teams
🏢 Enterprise CRM Administrators
👨💼 Startup Founders
Whether you manage a growing startup or an enterprise CRM system, this dashboard brings structured KPI tracking without expensive software.
It improves:
✔ KPI visibility
✔ Accountability
✔ Target discipline
✔ Performance review meetings
✔ Long-term strategy planning
When CRM performance becomes measurable, improvement becomes inevitable.
💡 Why This Dashboard Improves CRM Performance
Performance improves when teams clearly see gaps.
This dashboard helps you:
-
Identify underperforming KPIs
-
Compare year-on-year growth
-
Monitor monthly trends
-
Conduct structured review meetings
-
Align KPIs with business goals
Instead of guessing, you manage with data.
And that changes everything.
Click hare to read the Detailed blog post
Visit our YouTube channel to learn step-by-step video tutorials