In the fast-evolving financial sector, credit unions must track their performance with accuracy, transparency, and speed. From monitoring loans and deposits to evaluating profitability and member growth, decision-makers need data they can trust — all in one place.
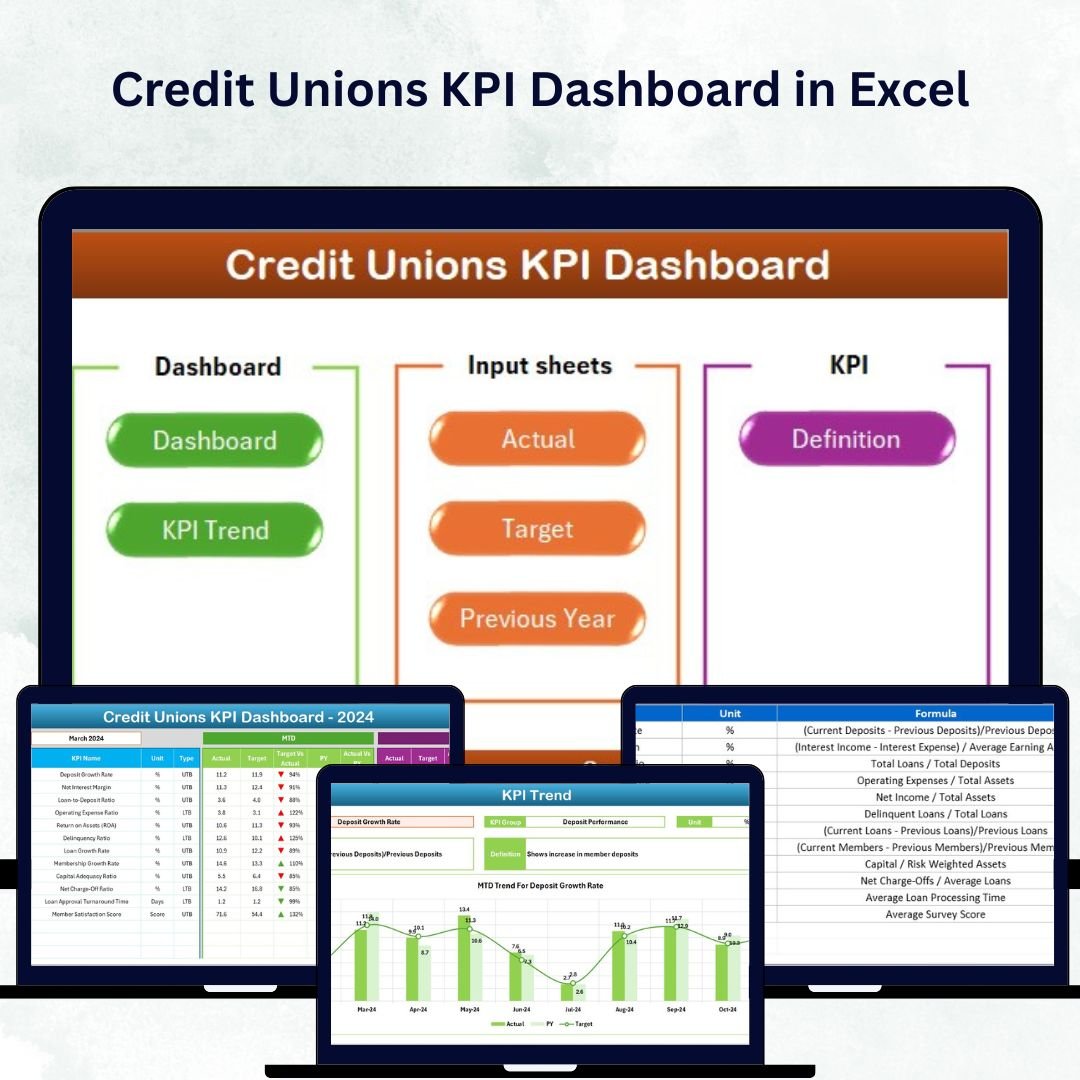
The Credit Unions KPI Dashboard in Excel is your all-in-one performance monitoring solution. Designed for credit union managers, CFOs, analysts, and operational teams, this Excel-based dashboard transforms raw data into meaningful insights with automated charts, trend visualizations, and month-by-month analysis 📊.
Built entirely in Microsoft Excel, it eliminates complex software dependencies — giving you a reliable, affordable, and customizable performance-tracking system tailored to your organization’s needs.
⚙️ Key Features of the Credit Unions KPI Dashboard in Excel
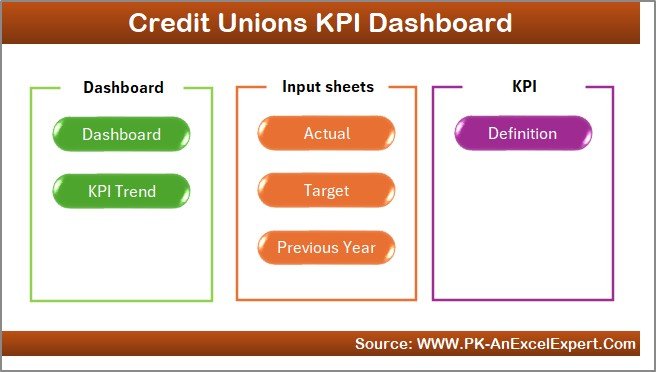
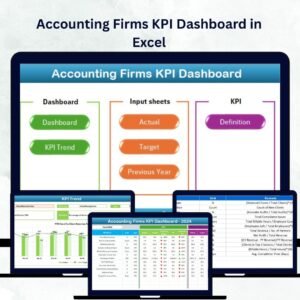
🏠 7 Organized Worksheets – Home, Dashboard, KPI Trend, Actual Numbers, Target, Previous Year, and KPI Definition.
📈 MTD & YTD Analysis – Monitor Month-to-Date and Year-to-Date results instantly.
🎯 Actual vs Target vs Previous Year – Measure progress and year-over-year improvement automatically.
📊 Dynamic Trend Charts – Visualize historical data for each KPI in line and bar formats.
🟢 Conditional Formatting Arrows – Green for improvement, red for decline — instant clarity.
📅 Month Selector (Cell D3) – Choose any month to update the entire dashboard in seconds.
💡 Auto Calculations – Variance and performance ratios update automatically.
💻 No Coding or Software Required – 100% Excel-powered and easy to share.
📦 What’s Inside the Dashboard
1️⃣ Home Sheet – Navigation Panel
Centralized menu with clickable buttons to access all key sections — Dashboard, Targets, Trends, and Definitions.
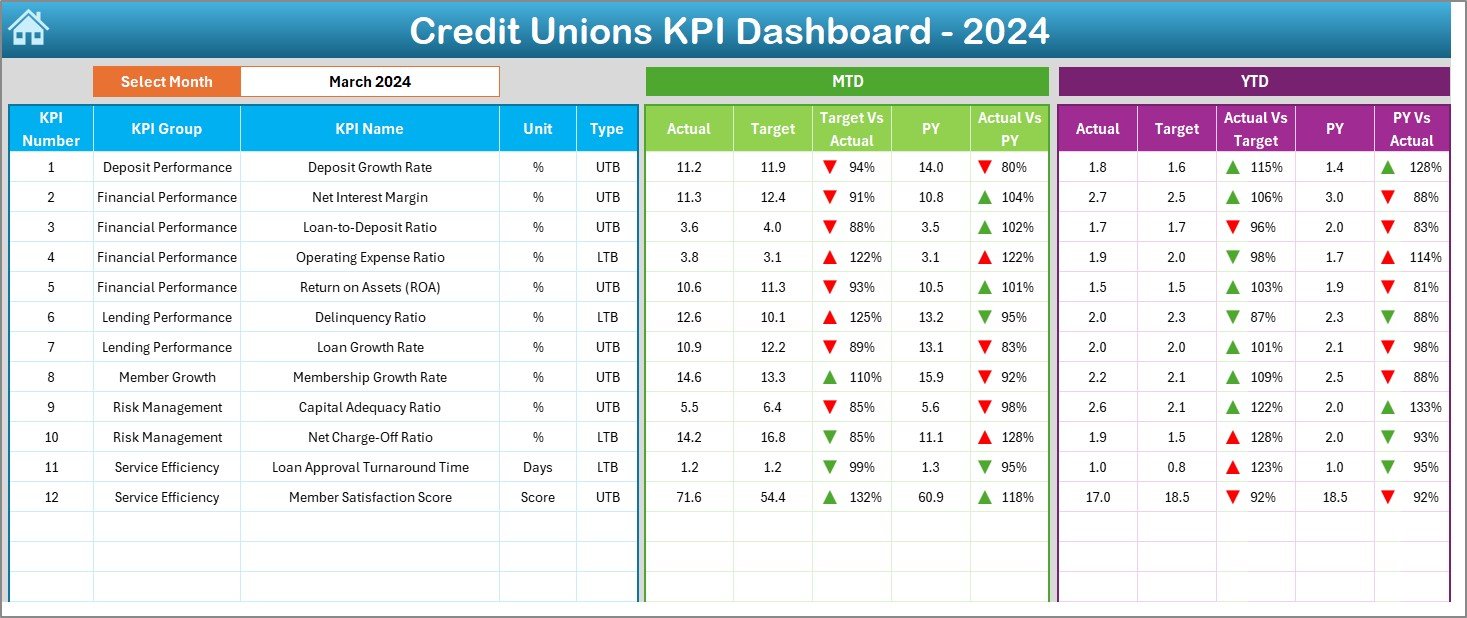
2️⃣ Dashboard Sheet – Main Control Center
-
Displays MTD & YTD data for Actual, Target, and Previous Year.
-
Auto-calculates Target vs Actual and YoY Variance.
-
Includes conditional icons (▲▼) for instant trend interpretation.
-
Provides a 360° view of financial and operational performance.
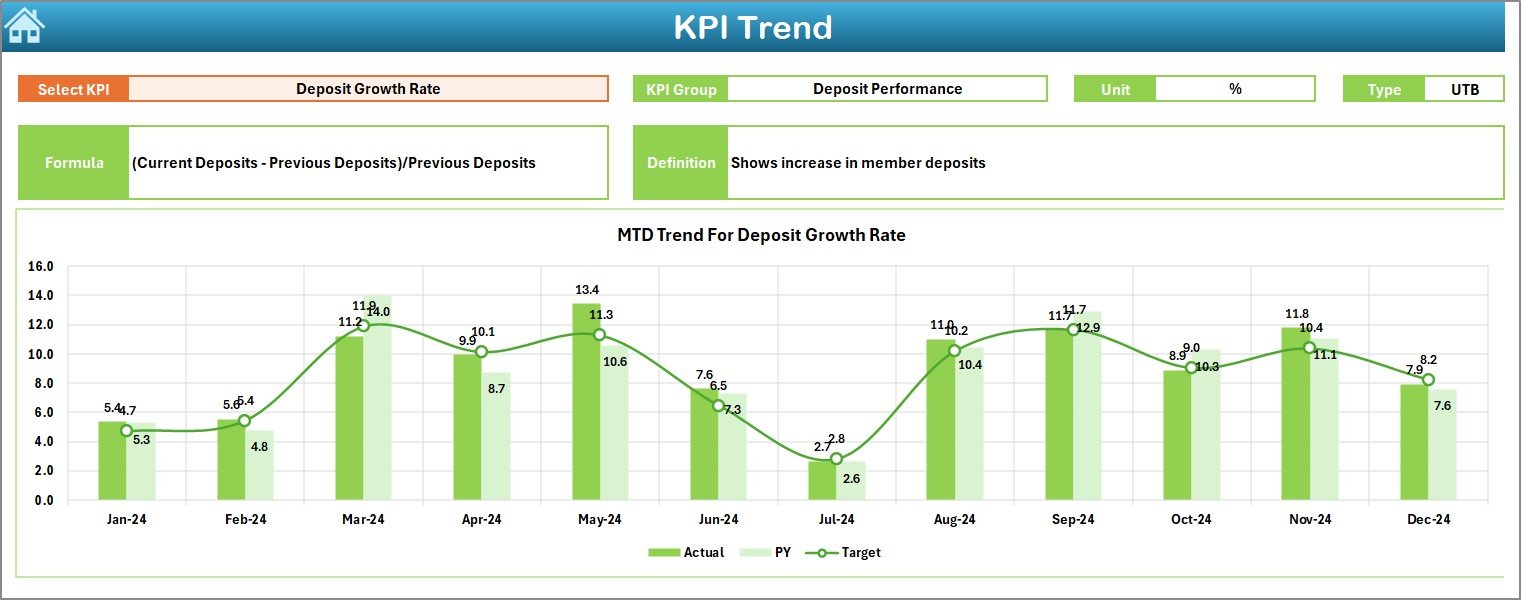
3️⃣ KPI Trend Sheet – Analyze Historical Performance
-
Select any KPI (cell C3) to view its Unit, Group, Type (LTB/UTB), Formula, and Definition.
-
Automatically generated MTD and YTD trend charts show Actual vs Target vs PY.
Perfect for management meetings and quarterly performance reviews.
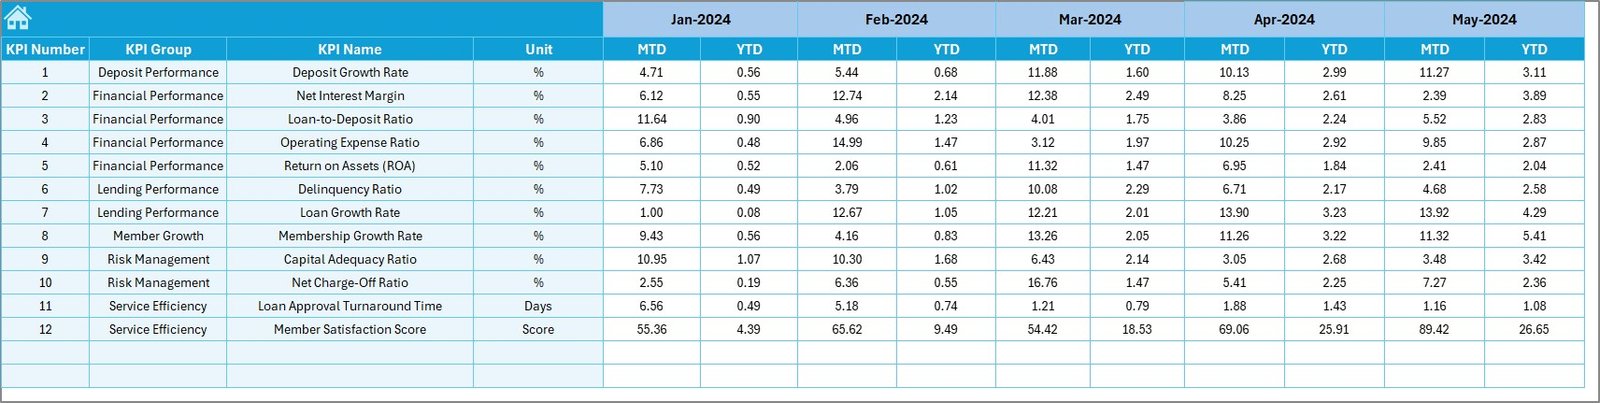
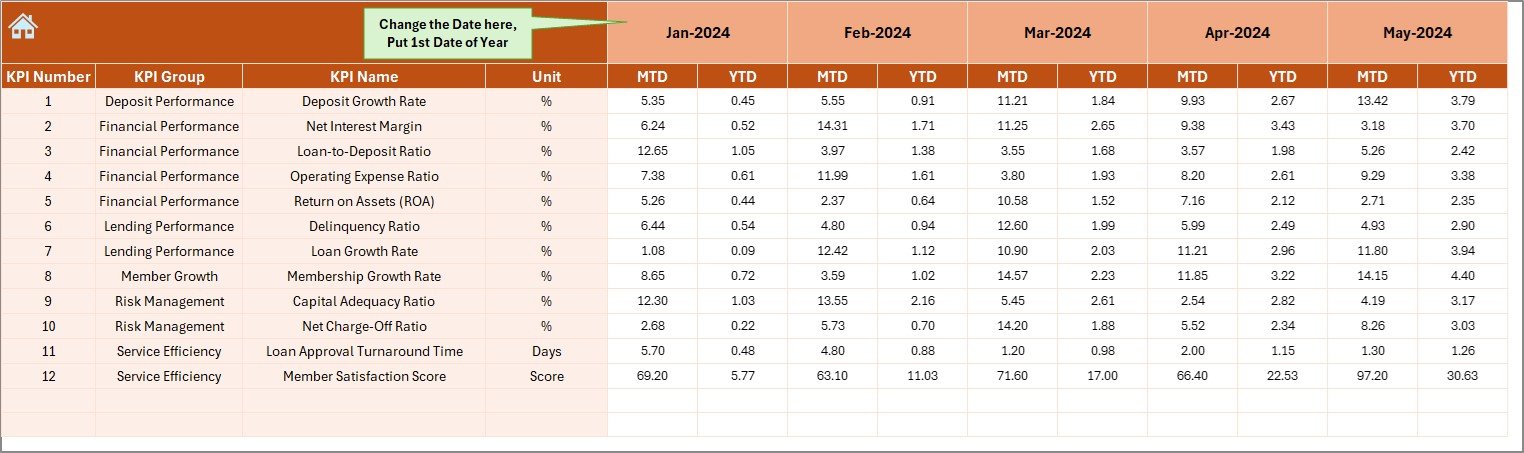
4️⃣ Actual Numbers Input Sheet – Data Entry Made Easy
-
Record MTD and YTD Actual data.
-
Change your fiscal-year start month (E1) anytime.
-
Dashboard updates instantly — no manual recalculations required.
5️⃣ Target Sheet – Define Your Goals
-
Set monthly and annual targets for each KPI.
-
Align every department with the organization’s strategic objectives.
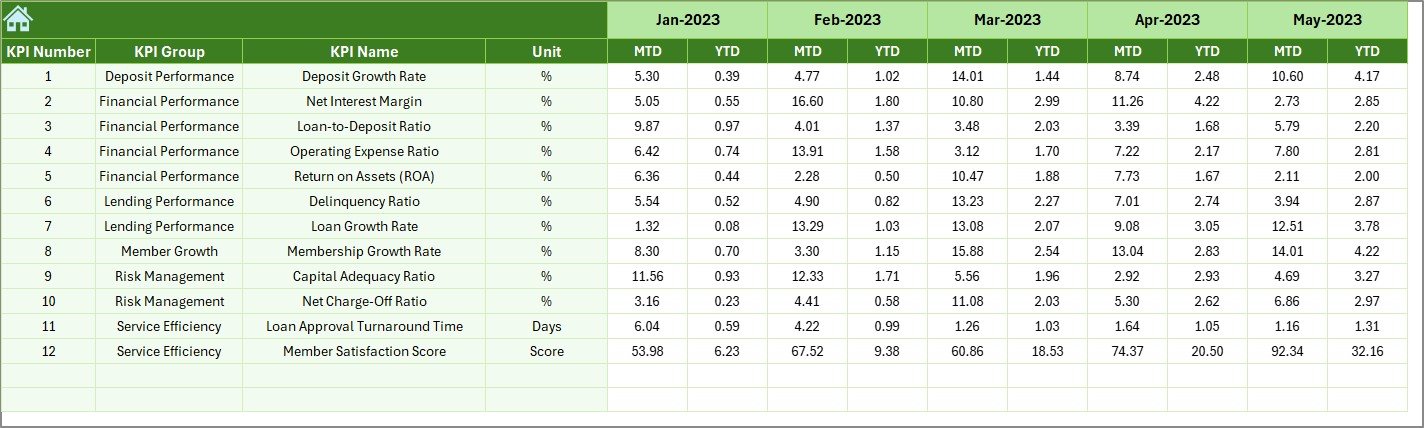
6️⃣ Previous Year Sheet – Track Growth Over Time
-
Enter prior year data for automatic YoY analysis and trend comparison.
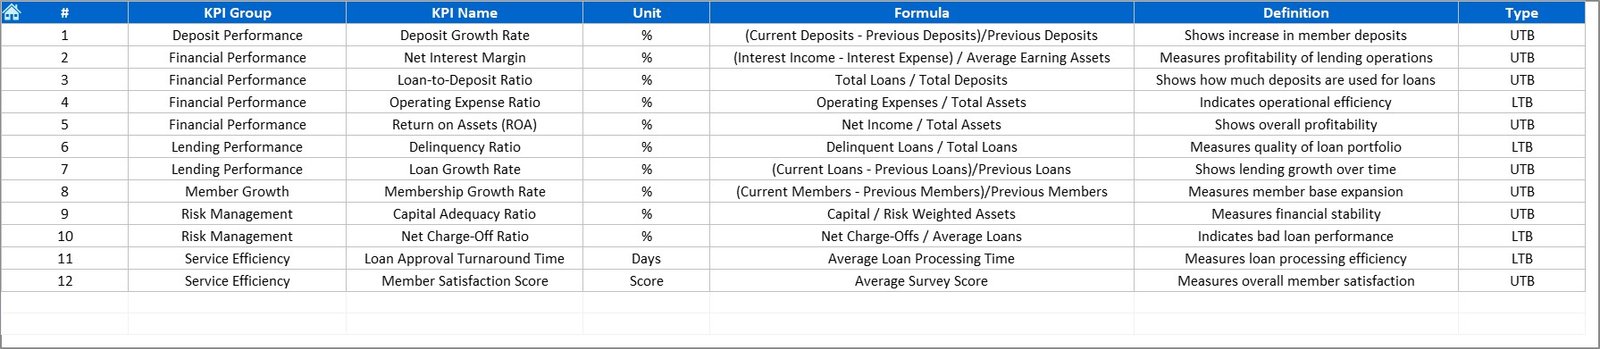
7️⃣ KPI Definition Sheet – Standardized Understanding
-
Lists all KPIs with Name, Group, Unit, Formula, and Definition.
-
Ensures transparency, clarity, and reporting consistency across teams.
💹 Example KPIs You Can Track
💰 Financial KPIs – Loan Growth Rate, Deposit Growth Rate, Net Interest Margin (NIM), Return on Assets (ROA), Capital Adequacy Ratio (CAR).
🏦 Operational KPIs – Loan-to-Share Ratio, Operating Expense Ratio, Productivity per Employee.
👥 Member KPIs – Member Growth Rate, Retention Rate, Delinquency Ratio.
These KPIs help credit unions assess financial stability, member satisfaction, and operational excellence — all in one place.
🌟 Advantages of the Credit Unions KPI Dashboard in Excel
✅ Centralized Data Visibility – View all KPIs in one file, eliminating data silos.
✅ Real-Time Insights – Automatic calculations give instant updates for fast decision-making.
✅ Error-Free Automation – Prebuilt Excel formulas reduce manual errors.
✅ Customizable & Scalable – Add new KPIs or departments easily.
✅ Cost-Effective – Skip expensive software; Excel handles everything.
✅ Professional Reports – Ideal for board meetings and financial presentations.
💡 Best Practices for Effective Use
-
📅 Update Actual and Target values monthly.
-
🎯 Refer to the KPI Definition sheet for consistent calculations.
-
📈 Compare both MTD and YTD to balance short- and long-term goals.
-
🧩 Involve all departments for holistic data insights.
-
🔒 Protect sensitive data using Excel’s password features.
-
🔁 Optionally, automate data imports via Power Query or VBA for advanced use.
When used regularly, this dashboard becomes your financial command center, ensuring transparency and precision across every branch and business unit.


Reviews
There are no reviews yet.