
Credit unions operate in a highly dynamic and regulated financial environment. Every day, leaders must balance member satisfaction, loan growth, delinquency risk, branch performance, and product profitability. However, when data remains scattered across spreadsheets, systems, and delayed reports, decision-making becomes slow and reactive.
The Credit Unions Dashboard in Power BI is a ready-to-use, interactive analytics solution designed to give credit unions real-time visibility and complete control over their operational and financial performance.
Instead of relying on static reports, this dashboard consolidates critical metrics into one powerful Power BI model. As a result, executives, managers, and analysts can identify risks early, track trends instantly, and make confident data-driven decisions—all while staying aligned with the member-first mission of credit unions.
🚀 Key Features of Credit Unions Dashboard in Power BI
📊 Real-Time Credit Union Performance Tracking
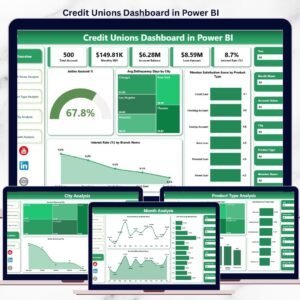
Monitor active accounts, loan amounts, EMIs, delinquency days, interest rates, and member satisfaction instantly.
🎯 Interactive Filters & Slicers
Analyze performance by branch name, product type, city, and month with seamless interactivity.
📈 Five Dedicated Analytical Pages
Overview, Branch Name Analysis, Product Type Analysis, City Analysis, and Month Analysis.
⚡ Automatic Data Refresh
Always work with the latest data without manual reporting delays.
🔍 Deep Drill-Down Analytics
Move from summary KPIs to detailed insights in seconds.
🔐 Enterprise-Grade Security
Role-based access and secure data handling through Power BI.
🎨 Professional & Executive-Ready Design
Clean visuals built for leadership reviews, audits, and strategy meetings.
📦 What’s Inside the Credit Unions Dashboard in Power BI
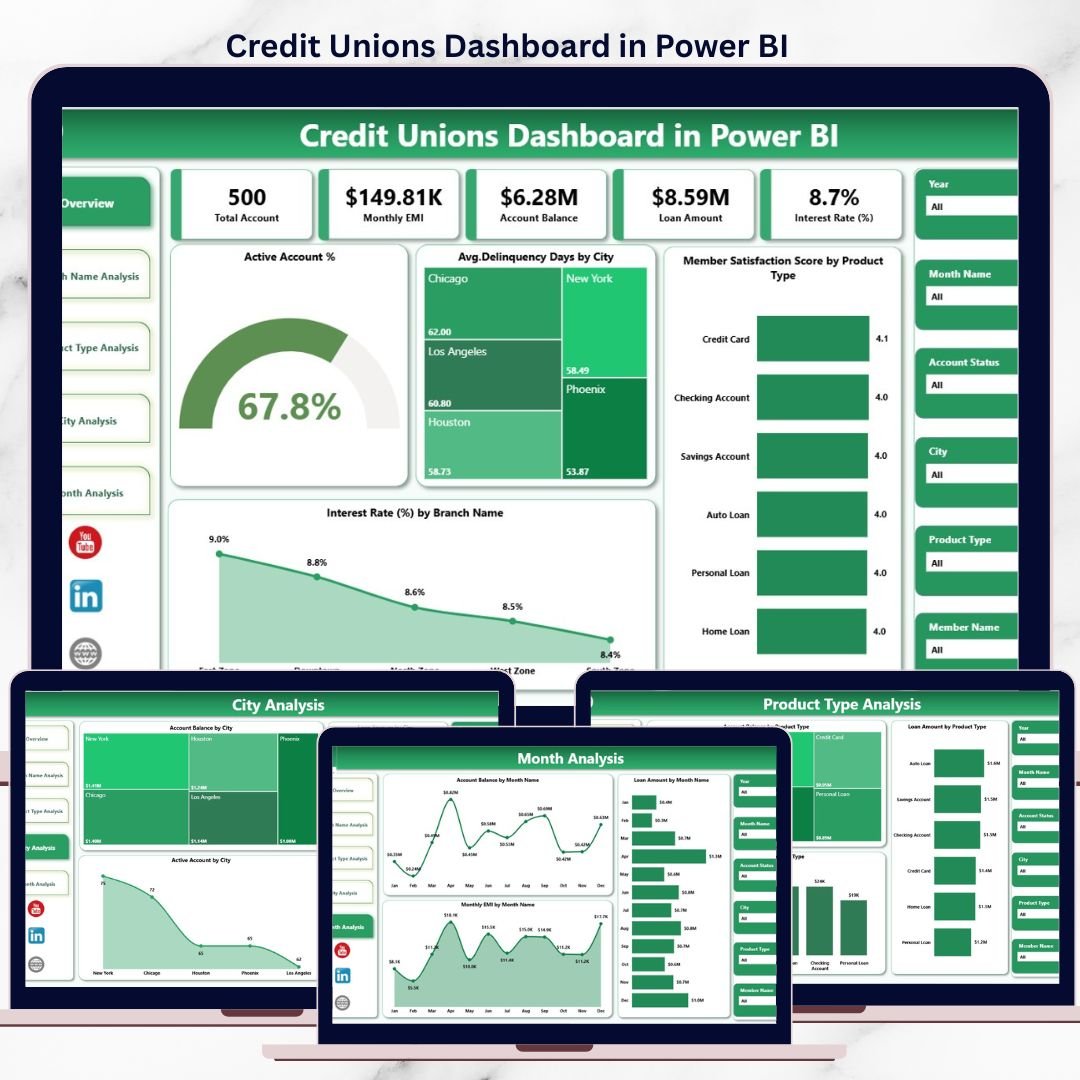
📁 Overview Page

High-level snapshot showing Active Account %, Average Delinquency Days by City, Member Satisfaction by Product Type, and Interest Rate by Branch Name.
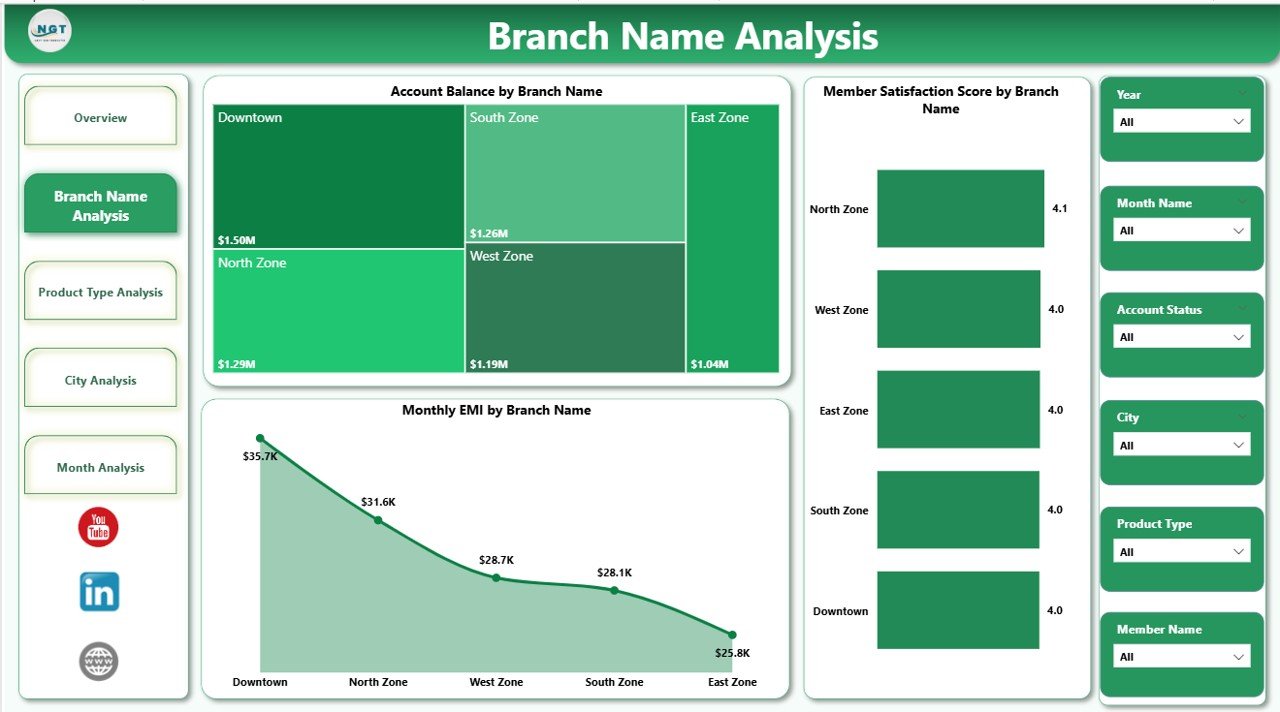
📁 Branch Name Analysis Page
Compare branch-wise satisfaction scores, account balances, and monthly EMI trends.
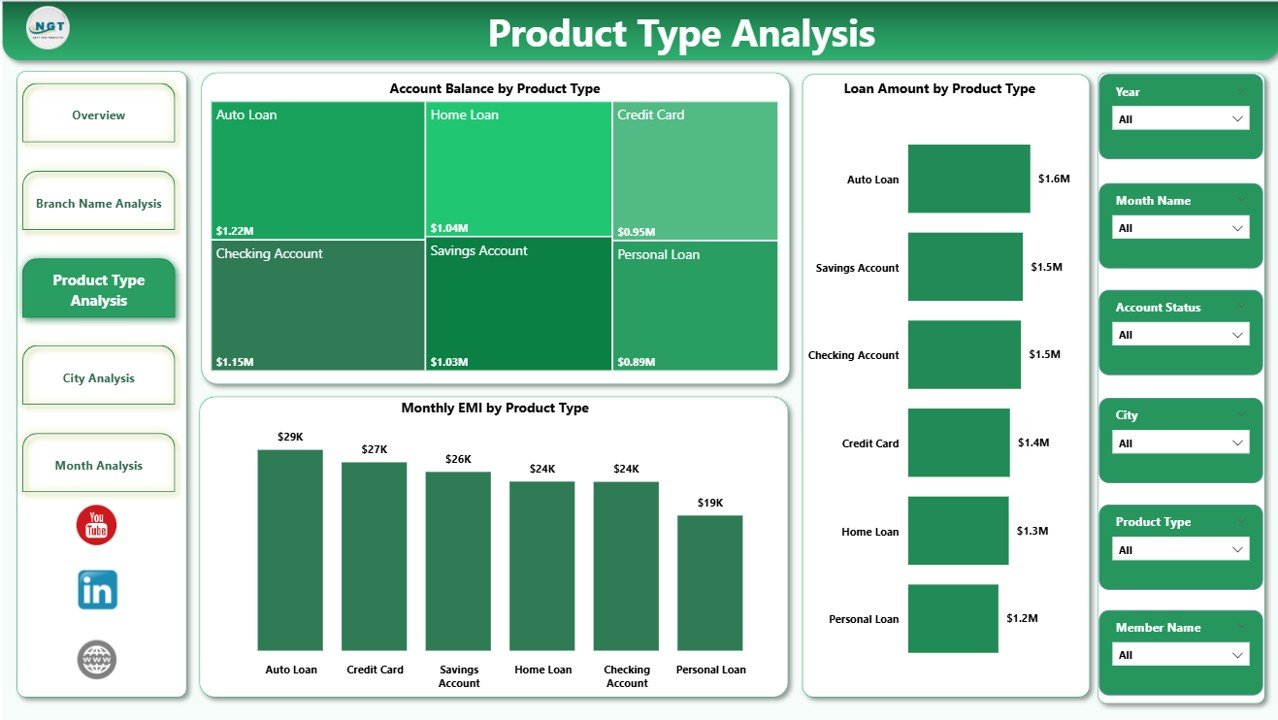
📁 Product Type Analysis Page
Evaluate account balances, loan amounts, and EMI behavior across product categories.
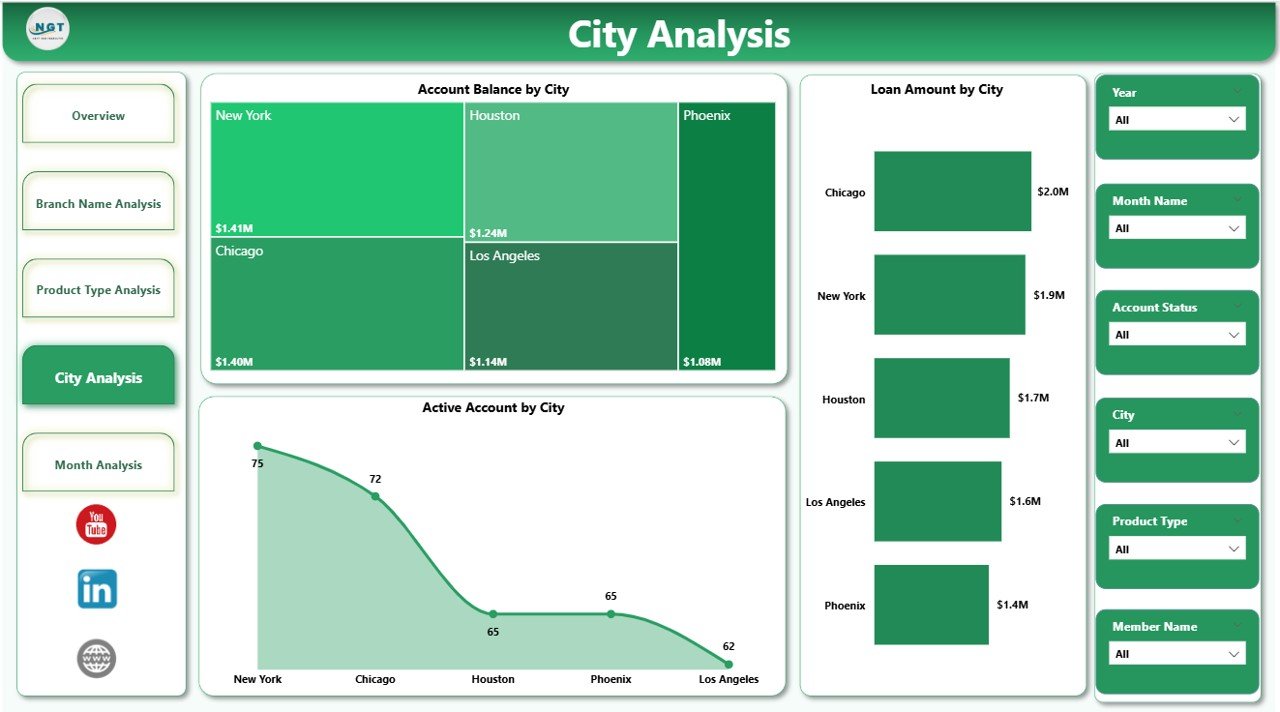
📁 City Analysis Page
Understand geographic performance with city-wise account balance, loan amount, and EMI insights.
📁 Month Analysis Page
Track time-based trends, seasonality, and growth patterns across months.
📁 Interactive Visuals & Slicers
Cards, charts, and filters that respond instantly to user selections.
🛠️ How to Use the Credit Unions Dashboard in Power BI
1️⃣ Connect your data sources (core banking systems, Excel files, CRM, or databases)
2️⃣ Refresh the Power BI dataset
3️⃣ Use slicers to filter by branch, city, product type, or month
4️⃣ Review KPIs and trends across all dashboard pages
5️⃣ Drill down to identify risks, opportunities, and performance gaps
6️⃣ Export insights for management reviews or compliance reporting
No coding skills required—Power BI’s intuitive interface makes adoption easy.
👥 Who Can Benefit from This Credit Unions Dashboard
🏦 Credit Union Executives – Gain instant visibility into performance and risks
📊 Branch Managers – Compare branch efficiency and member satisfaction
💼 Finance & Loan Teams – Monitor balances, EMIs, and loan trends
⚠️ Risk & Compliance Teams – Identify delinquency and exposure early
📈 Product & Strategy Teams – Optimize product offerings using real data
If your credit union uses data to drive decisions, this dashboard becomes essential.
📘 Click here to read the Detailed blog post
🎥 Visit our YouTube channel to learn step-by-step video tutorials
👉 Youtube.com/@PKAnExcelExpert


Reviews
There are no reviews yet.