In today’s fast-moving financial landscape, credit card companies manage thousands of transactions, approvals, risks, and customer interactions every single day. However, when performance data remains scattered across multiple spreadsheets, reports, and systems, leaders lose visibility, speed, and control. That is exactly why the Credit Card Companies KPI Dashboard in Excel becomes a game-changing solution 🚀.
This powerful, ready-to-use Excel dashboard transforms complex operational and financial data into clear, actionable insights. Instead of spending hours preparing reports, teams can instantly track performance, identify risks early, and make confident, data-driven decisions—all from one structured Excel file.
Designed for simplicity and impact, this dashboard delivers enterprise-level insights without expensive BI tools or technical complexity.
## 🔑 Key Features of Credit Card Companies KPI Dashboard in Excel
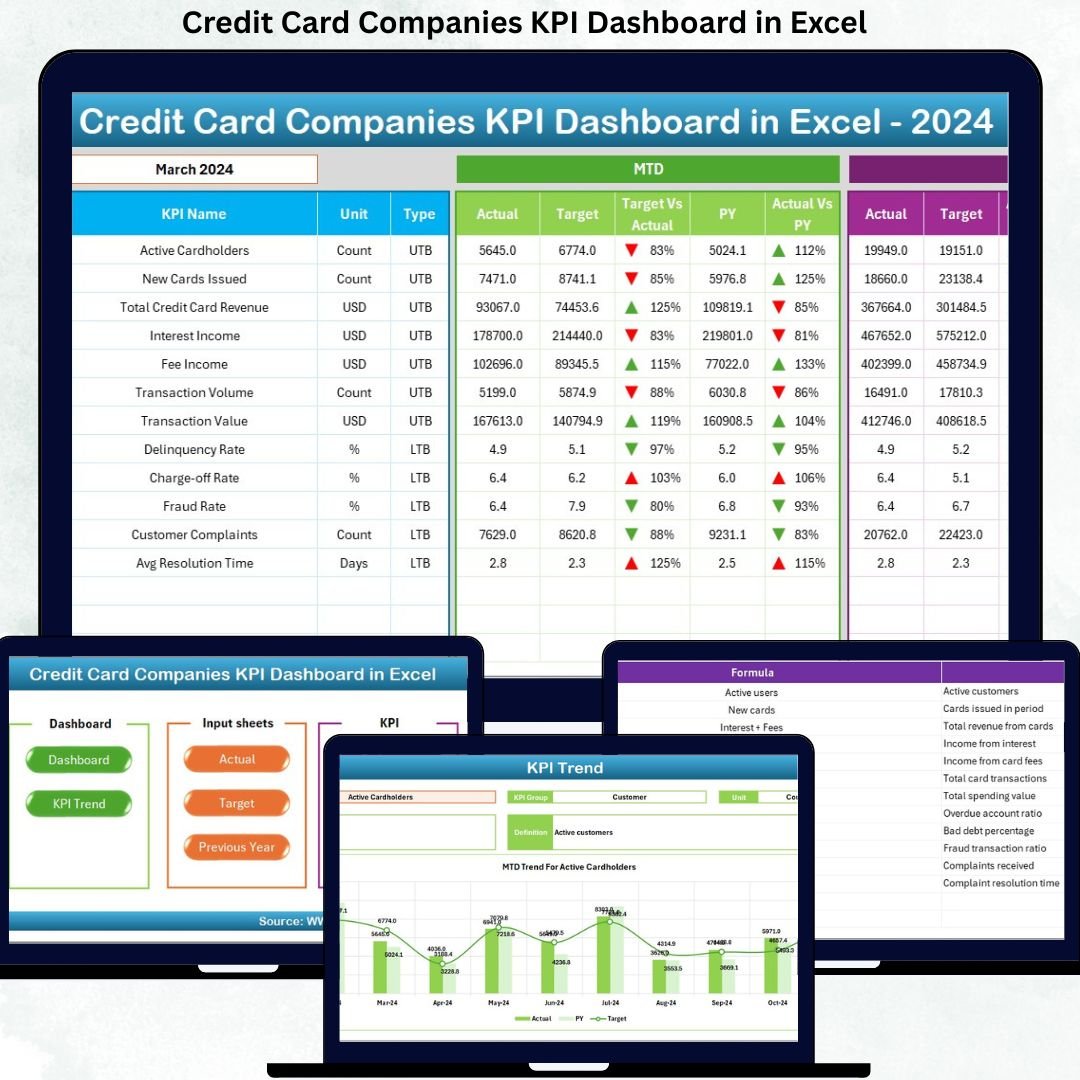
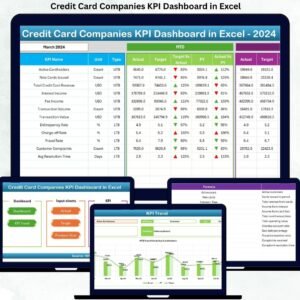
📊 Centralized KPI Monitoring – Track financial, customer, risk, and operational KPIs from a single dashboard
🎯 MTD & YTD Performance Tracking – Monitor month-to-date and year-to-date performance effortlessly
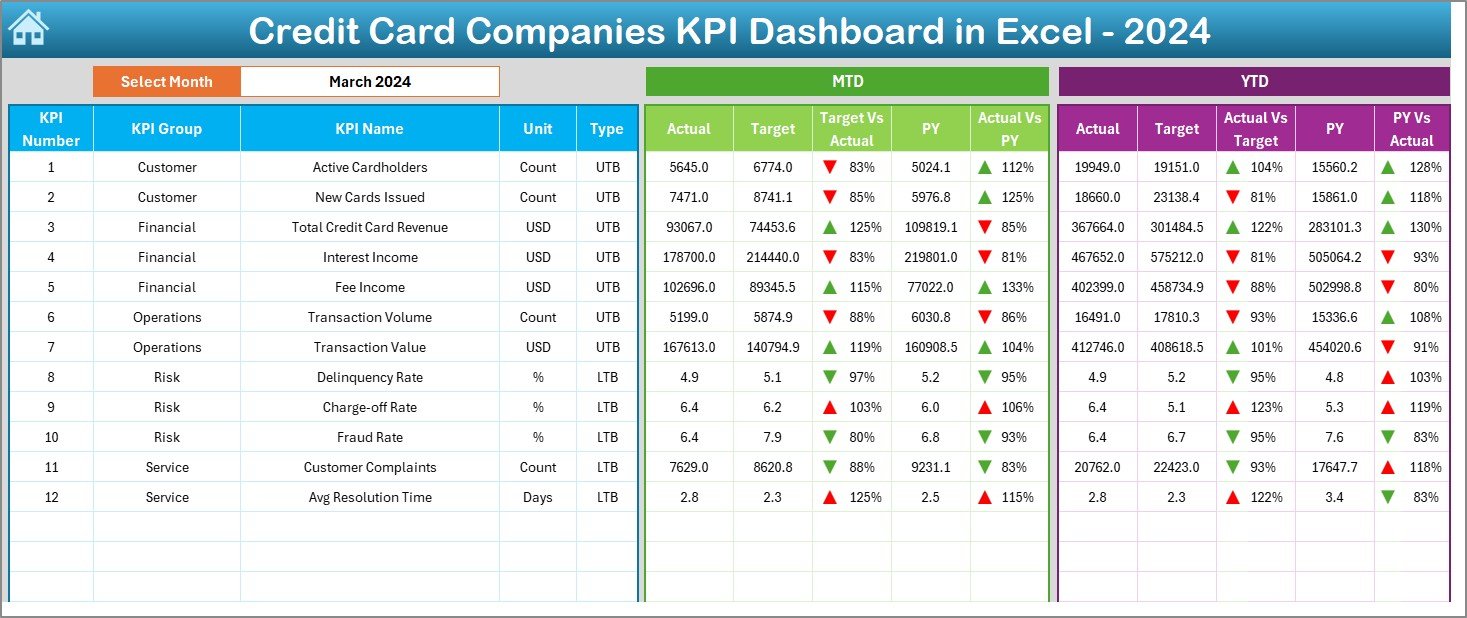
📈 Target vs Actual Comparison – Instantly identify gaps using visual indicators
🔁 Previous Year Comparison – Measure growth and decline with clear year-over-year analysis
⚡ Interactive Month Selection – Change months dynamically using dropdowns
🚦 Smart Conditional Formatting – Up and down arrows highlight performance trends instantly
🧠 User-Friendly Excel Design – No coding, macros, or advanced tools required
Each feature is built to save time, reduce errors, and improve decision quality.
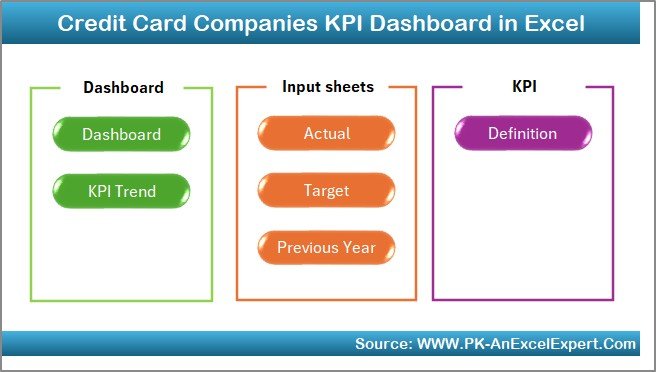
## 📂 What’s Inside the Credit Card Companies KPI Dashboard in Excel
This dashboard includes 7 professionally designed worksheets, each serving a specific analytical purpose:
📌 Summary Page – Acts as the navigation hub with six clickable buttons for quick access
📌 Dashboard Sheet – Displays MTD & YTD Actual, Target, and Previous Year values with performance indicators
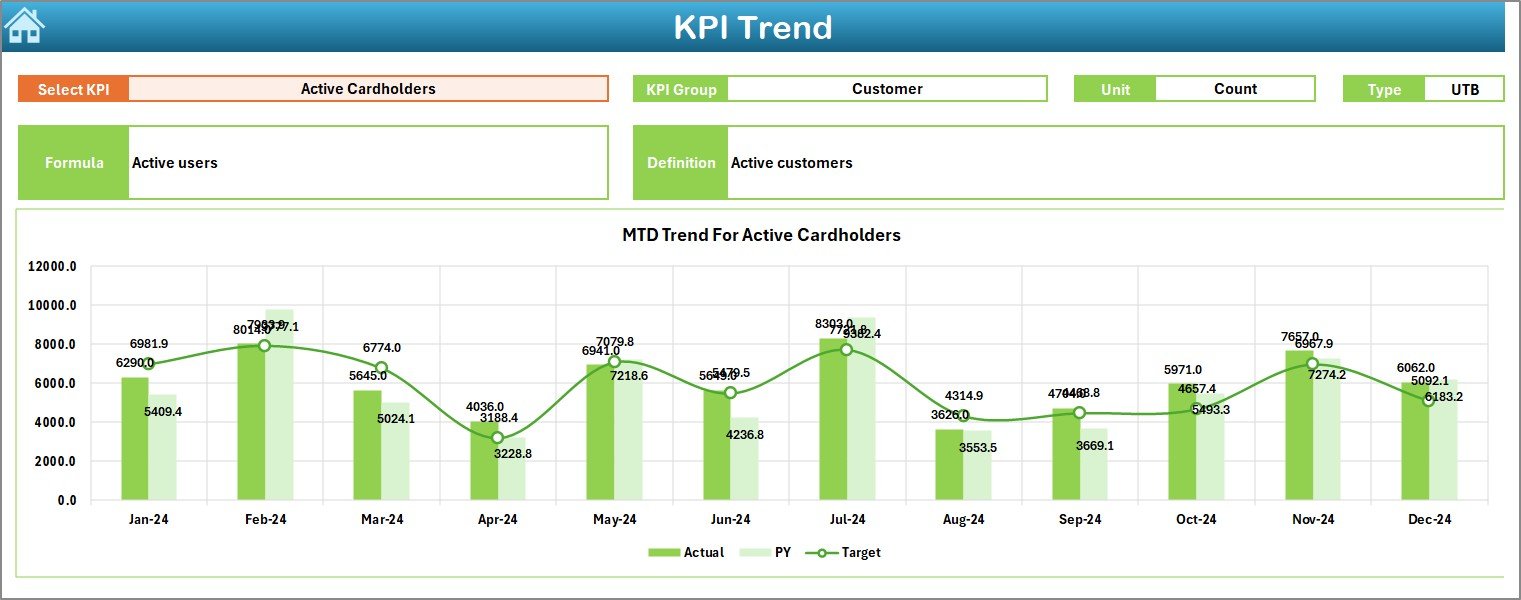
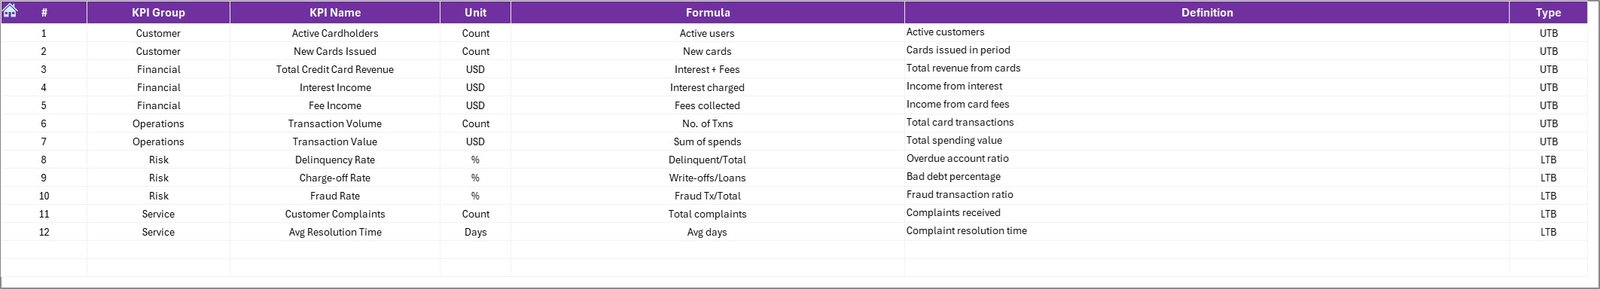
📌 Trend Sheet – Shows KPI trends with detailed information such as KPI group, unit, type, formula, and definition
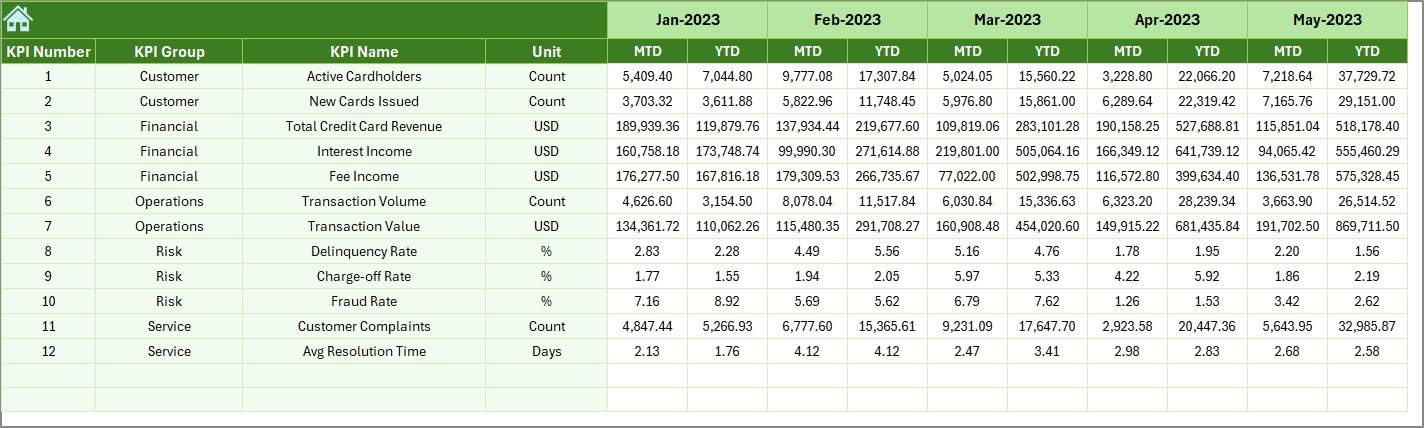
📌 Actual Numbers Input Sheet – Enter real MTD and YTD performance data easily
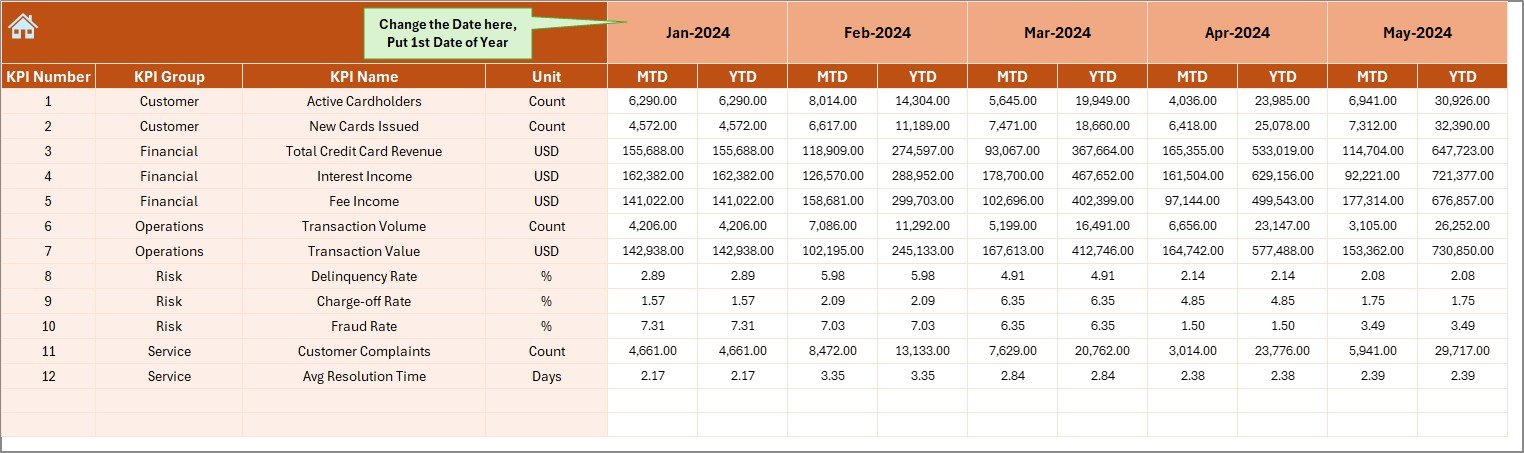
📌 Target Sheet – Define monthly and yearly targets for every KPI
📌 Previous Year Numbers Sheet – Capture historical data for year-over-year comparison
📌 KPI Definition Sheet – Maintain consistent understanding with clear KPI definitions and formulas
Together, these sheets create a complete performance tracking ecosystem.
## 🛠 How to Use the Credit Card Companies KPI Dashboard in Excel
Using this dashboard is simple and intuitive:
1️⃣ Enter actual performance data in the Actual Numbers sheet
2️⃣ Define targets in the Target Sheet
3️⃣ Input last year’s data in the Previous Year Sheet
4️⃣ Select the desired month from cell D3
5️⃣ Instantly view refreshed KPIs, comparisons, and trends
Because the dashboard updates automatically, teams focus on insights instead of manual work.
## 👥 Who Can Benefit from This Credit Card Companies KPI Dashboard in Excel
This dashboard is ideal for:
🏦 Credit Card Operations Teams
📊 Finance & Revenue Analysts
🛡 Risk & Compliance Managers
📉 Fraud Monitoring Teams
📈 Strategy & Leadership Teams
💼 Small, mid-size, and large credit card organizations
Whether you manage approvals, profitability, customer growth, or risk exposure, this dashboard supports smarter decisions at every level.
Click here to read the Detailed blog post
Watch the step-by-step video tutorial:
Visit our YouTube channel to learn step-by-step video tutorials
YouTube.com/@PKAnExcelExpert


Reviews
There are no reviews yet.