


Creative agencies juggle multiple clients, tight deadlines, creative teams, and profitability goals every single day. However, when performance data stays scattered across spreadsheets and reports, agencies lose clarity and control. That is exactly where the Creative Agencies KPI Dashboard in Excel becomes a game-changer.
This ready-to-use Excel dashboard transforms raw agency data into clear, visual, and actionable insights. Instead of guessing performance, you track productivity, profitability, utilization, and delivery accuracy in one centralized dashboard. As a result, agency leaders make faster, smarter, and more confident decisions—without using expensive software.
Designed specifically for creative agencies, this dashboard combines automation, simplicity, and powerful visuals to help you scale operations while staying profitable and client-focused.
🚀 Key Features of Creative Agencies KPI Dashboard in Excel
✨ All KPIs in One View – Track productivity, financial, and delivery KPIs in a single interactive dashboard
📅 Dynamic Month Selection – Change the month from a dropdown and instantly update the entire dashboard
📊 MTD & YTD Performance Tracking – Monitor Month-to-Date and Year-to-Date results effortlessly
🎯 Target vs Actual Analysis – Instantly spot gaps with automatic variance calculations
📈 Previous Year Comparison – Analyze year-over-year growth and trends
🔼 Visual Performance Indicators – Conditional formatting arrows highlight overperformance and risks
⚙️ Fully Automated Calculations – No manual formulas or complex setup required
📂 100% Excel-Based Solution – Works smoothly without any external tools or add-ins

📦 What’s Inside the Creative Agencies KPI Dashboard in Excel
This dashboard comes with 7 professionally designed worksheets, each built for a specific purpose:
🗂️ Summary Page – A clean index page with navigation buttons to access all sheets instantly
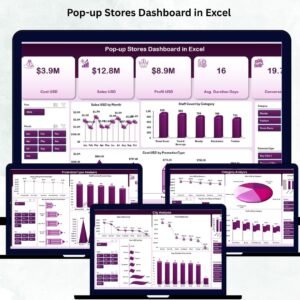
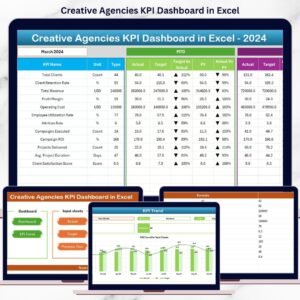
📊 Dashboard Sheet – The main performance view showing all KPIs with MTD & YTD metrics
📈 KPI Trend Sheet – Analyze KPI trends over time with interactive charts
✍️ Actual Numbers Input Sheet – Enter real performance data easily
🎯 Target Sheet – Store monthly and yearly KPI targets
📆 Previous Year Numbers Sheet – Enable year-over-year performance comparison
📘 KPI Definition Sheet – Document KPI names, units, formulas, and definitions clearly
This structure ensures clarity, accuracy, and ease of use for everyone in your agency.
🧭 How to Use the Creative Agencies KPI Dashboard in Excel
Using this dashboard is simple—even if you are not an Excel expert:
1️⃣ Enter actual performance data in the Actual Numbers sheet
2️⃣ Define monthly and yearly targets in the Target sheet
3️⃣ Add previous year values for historical comparison
4️⃣ Select the desired month from the dropdown
5️⃣ Instantly view updated KPIs, trends, and performance indicators
Because calculations are automated, you focus on insights—not formulas.
👥 Who Can Benefit from This Creative Agencies KPI Dashboard in Excel
This dashboard is ideal for:
🎨 Creative Agency Owners – Gain complete visibility into agency performance
📊 Operations Managers – Improve productivity and resource utilization
💰 Finance Teams – Monitor margins, costs, and revenue efficiency
📋 Project Managers – Track delivery timelines and utilization rates
📈 Strategy Consultants – Support data-driven growth decisions
Whether you run a small boutique agency or a large creative firm, this dashboard adapts to your needs.
Click here to read the Detailed Blog Post
Watch the step-by-step video tutorial:
Visit our YouTube channel to learn step-by-step video tutorials


Reviews
There are no reviews yet.