
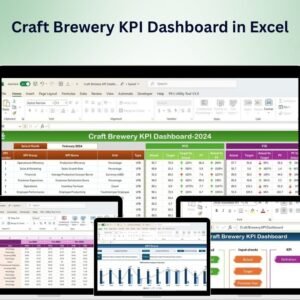
The Craft Brewery KPI Dashboard in Excel is a powerful tool designed for craft brewery owners, managers, and business analysts to track and monitor key performance indicators (KPIs) related to brewery operations. Whether you run a small, local craft brewery or a larger-scale production facility, this dashboard provides a clear and interactive overview of essential metrics that drive the success of your brewery business.
With customizable features and real-time tracking, this dashboard helps you monitor production efficiency, sales performance, inventory levels, and financial metrics, enabling you to make informed decisions that enhance profitability and streamline brewery operations.
Key Features of the Craft Brewery KPI Dashboard in Excel:
🍺 Production Monitoring
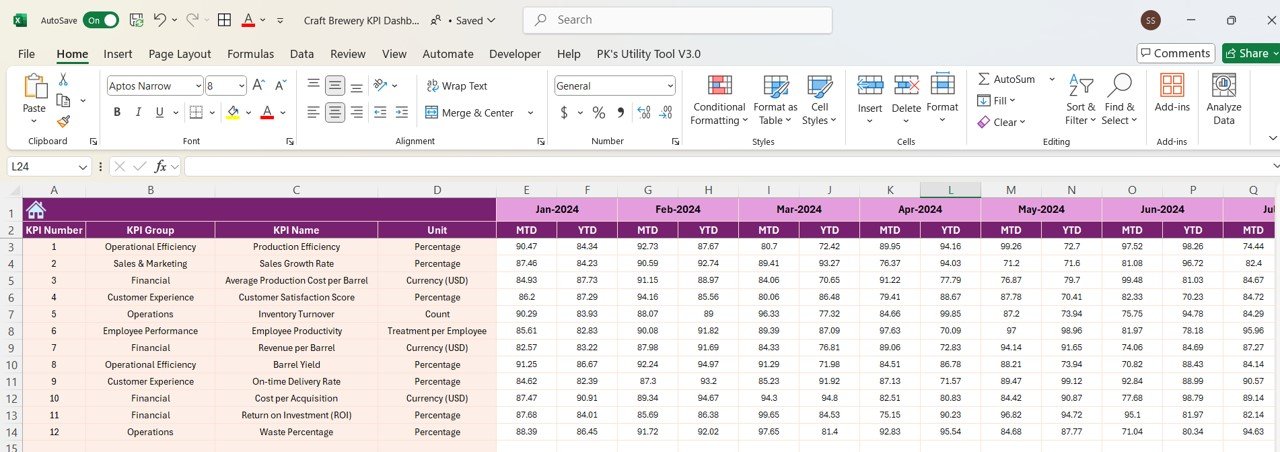
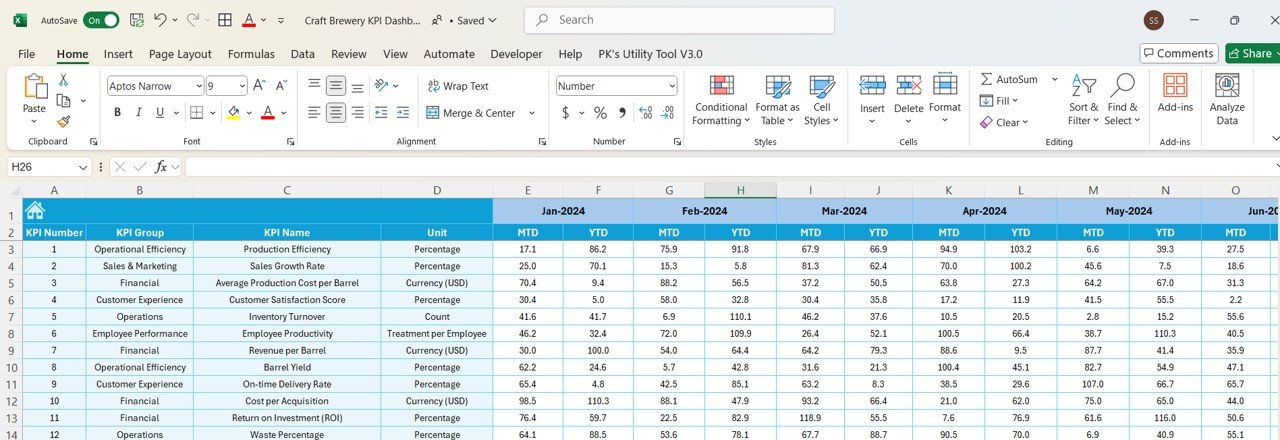
Track the number of batches produced, production time, and efficiency to ensure that your brewing process runs smoothly and efficiently.
💰 Sales and Revenue Tracking
Monitor sales performance, revenue by product, and profitability to ensure that your brewery is meeting its financial targets and identifying opportunities for growth.
📦 Inventory Management
Track raw materials, finished goods, and inventory turnover rates to ensure that your brewery maintains optimal stock levels and avoids overstocking or stockouts.
📊 Customer Satisfaction and Feedback
Analyze customer reviews, ratings, and feedback to evaluate the quality of your products and identify areas for improvement in your brewing process.
💼 Operational Efficiency
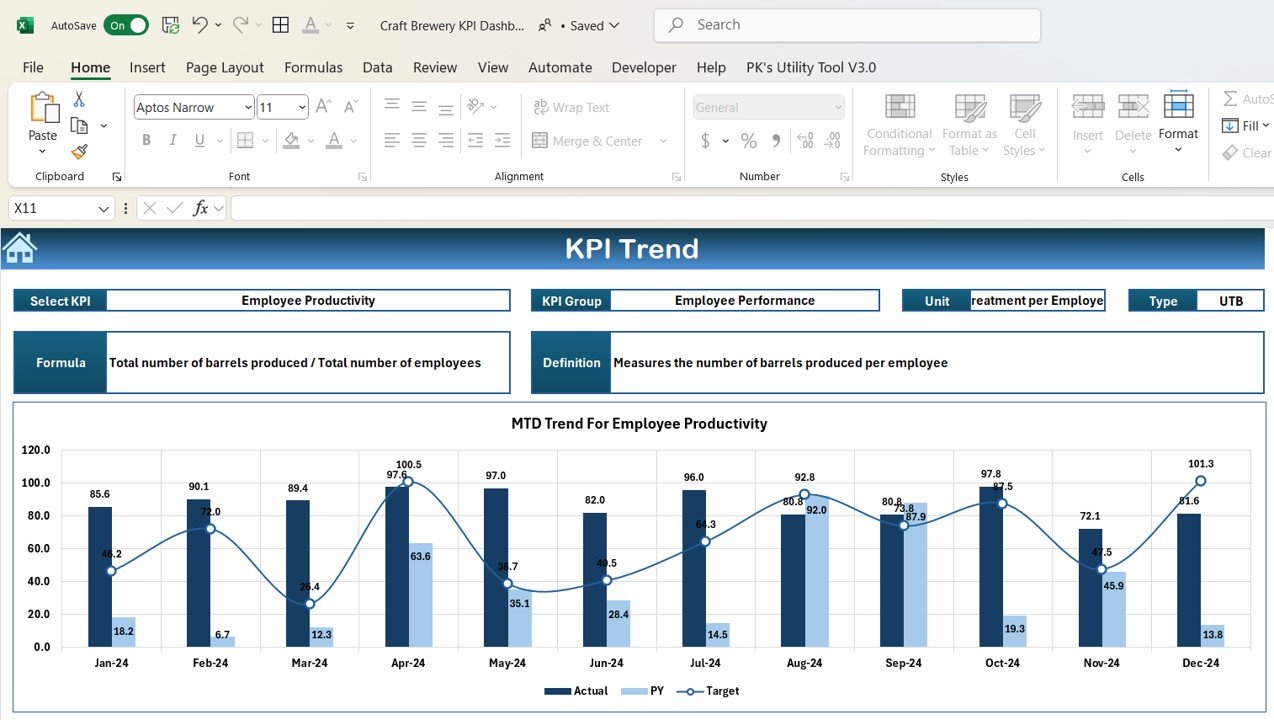
Track key operational metrics such as production costs, equipment maintenance, and employee productivity to ensure your brewery is running at peak efficiency.
🚀 Why You’ll Love the Craft Brewery KPI Dashboard in Excel:
✅ Monitor Brewing Efficiency – Track the number of batches produced, production time, and process efficiency to improve brewing operations.
✅ Maximize Sales and Profitability – Track sales by product and revenue generation to identify trends and maximize profits.
✅ Optimize Inventory Levels – Monitor raw material and finished goods inventory to ensure you maintain optimal stock levels.
✅ Enhance Customer Satisfaction – Track customer feedback and satisfaction ratings to continually improve the quality of your products.
✅ Improve Operational Efficiency – Monitor operational costs, equipment maintenance, and staff productivity to reduce costs and improve overall performance.
✅ Fully Customizable and Interactive – Tailor the dashboard to your specific brewery needs, with interactive features and real-time tracking for better decision-making.
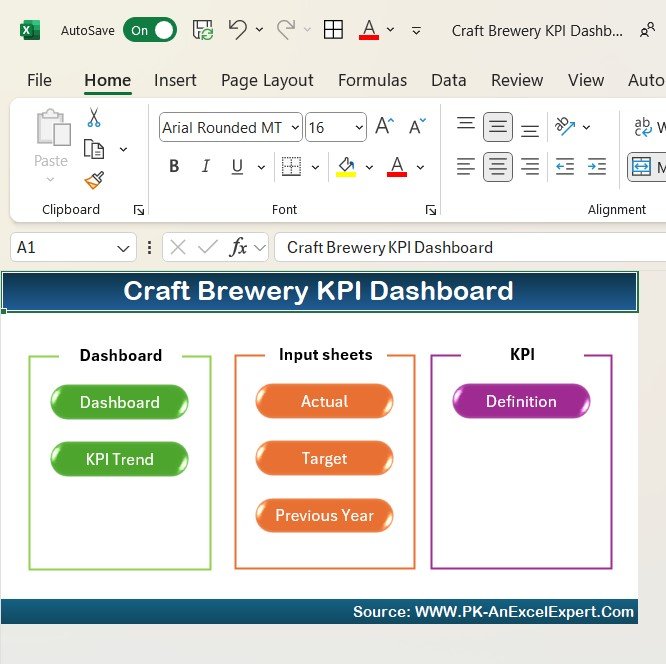
What’s Inside the Craft Brewery KPI Dashboard in Excel:
-
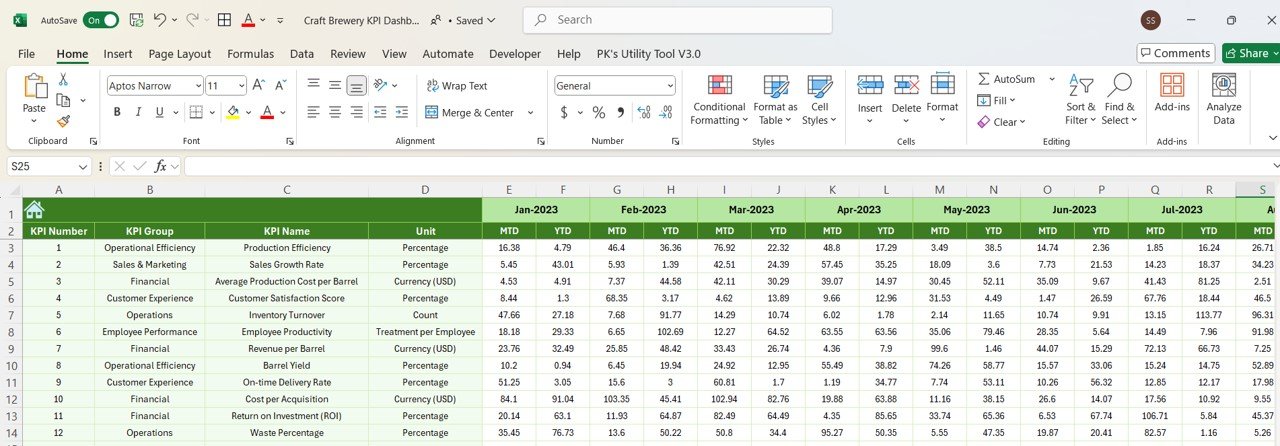
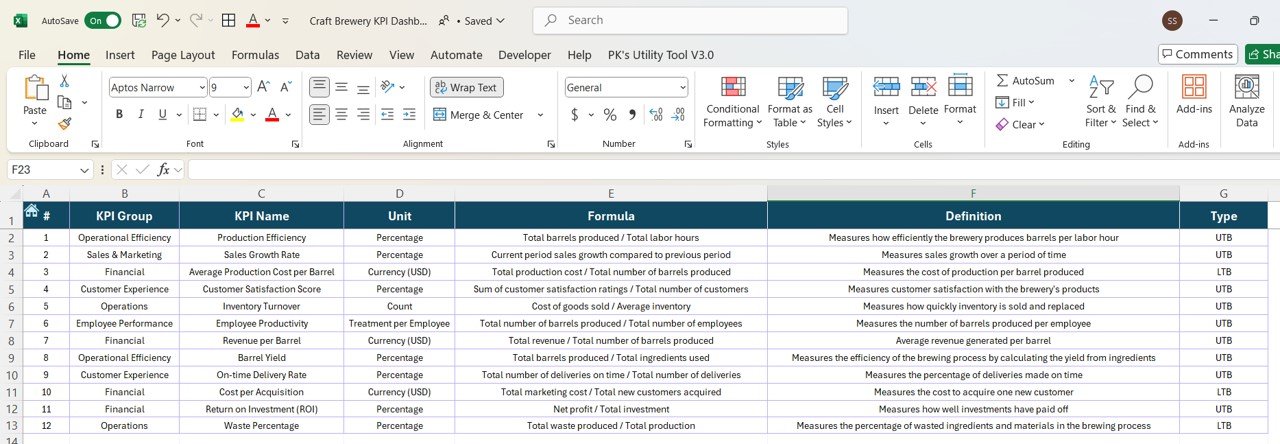
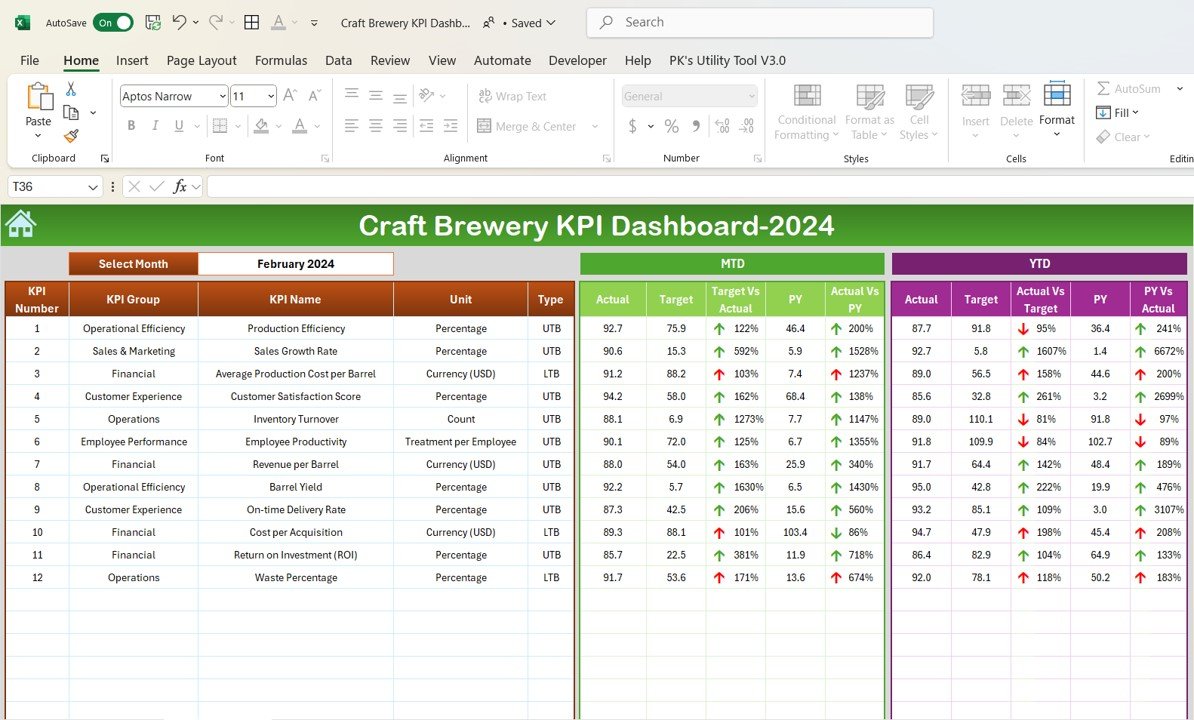
Production Tracking: Track the number of batches brewed, production time, and overall efficiency of your brewing process.
-
Sales and Revenue Monitoring: Monitor sales by product, region, and channel to assess financial performance and growth opportunities.
-
Inventory Management: Track raw materials, stock levels, and finished goods inventory to optimize brewery supply chain management.
-
Customer Feedback: Monitor customer reviews and satisfaction ratings to evaluate product quality and improve brewing practices.
-
Operational Efficiency: Track production costs, maintenance schedules, and employee productivity to improve overall operational efficiency.
-
Custom Reports: Generate reports that summarize key metrics such as production efficiency, sales performance, and operational costs for better decision-making.
How to Use the Craft Brewery KPI Dashboard in Excel:
1️⃣ Download the Template – Instantly access your Excel file upon purchase.
2️⃣ Input Production and Sales Data – Enter brewing, sales, and inventory data to start tracking KPIs.
3️⃣ Monitor Key Metrics – Use the dashboard to track production efficiency, sales, customer satisfaction, and operational performance in real-time.
4️⃣ Analyze Financials – Track revenue, costs, and profitability for each product to ensure the financial health of your brewery.
5️⃣ Generate Reports – Create custom reports summarizing key metrics for strategic decision-making and operational optimization.
Who Can Benefit from the Craft Brewery KPI Dashboard in Excel:
-
Craft Brewery Owners and Managers
-
Production Managers
-
Sales and Marketing Teams
-
Inventory and Supply Chain Managers
-
Financial Analysts in the Brewery Industry
-
Customer Service Teams
-
Business Analysts
-
Operational Managers
The Craft Brewery KPI Dashboard in Excel is the ideal tool for managing and optimizing your brewery operations. With its ability to track production efficiency, sales, inventory, customer satisfaction, and financial metrics, this dashboard ensures that your brewery runs efficiently and profitably.
Click here to read the Detailed blog post
https://www.pk-anexcelexpert.com/craft-brewery-kpi-dashboard-in-excel/
Visit our YouTube channel to learn step-by-step video tutorials
Youtube.com/@PKAnExcelExpert


Reviews
There are no reviews yet.