Corporate training plays a critical role in building a skilled, productive, and future-ready workforce. Organizations invest heavily in leadership development, technical training, compliance programs, onboarding, and employee development initiatives. However, without proper analytics and reporting tools, measuring the real impact of these training programs becomes difficult.
That is why modern training providers and HR departments rely on data-driven solutions to monitor learning outcomes and performance metrics. A powerful KPI dashboard can transform scattered training data into actionable insights that support better decision-making.
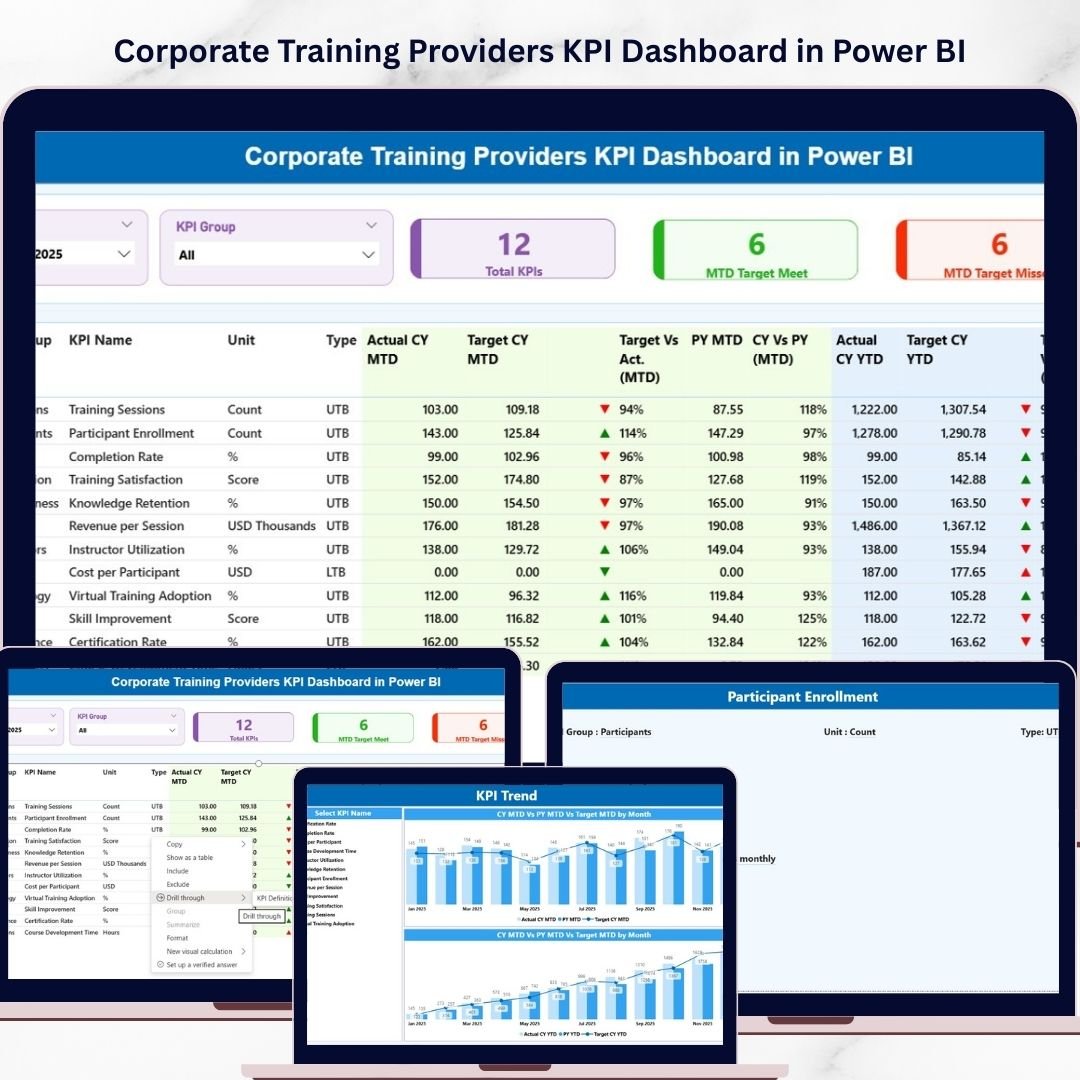
The Corporate Training Providers KPI Dashboard in Power BI is a professionally designed analytics solution that helps organizations track training effectiveness, evaluate trainer performance, monitor learning engagement, and measure program outcomes.
This dashboard converts raw training data into meaningful visual insights using interactive charts, KPI indicators, slicers, and performance comparisons. As a result, training managers, HR leaders, and corporate learning teams can easily analyze training performance and identify opportunities for improvement.
With dynamic filtering, automated KPI comparisons, and powerful visual analytics, this dashboard makes corporate training performance monitoring easier and more effective than ever before.
🚀 Key Features of Corporate Training Providers KPI Dashboard in Power BI
📊 Interactive KPI Monitoring Dashboard
Track training performance using dynamic visuals, KPI indicators, and real-time insights.
📅 Month and KPI Group Slicers
Quickly filter dashboard data by month and KPI category to analyze performance efficiently.
📈 MTD and YTD Performance Tracking
Monitor both Month-to-Date and Year-to-Date performance against targets.
📉 Target vs Actual Performance Comparison
Instantly identify whether KPIs are meeting targets using visual indicators.
🔄 Previous Year Comparison
Compare current training performance with previous year results to identify improvement trends.
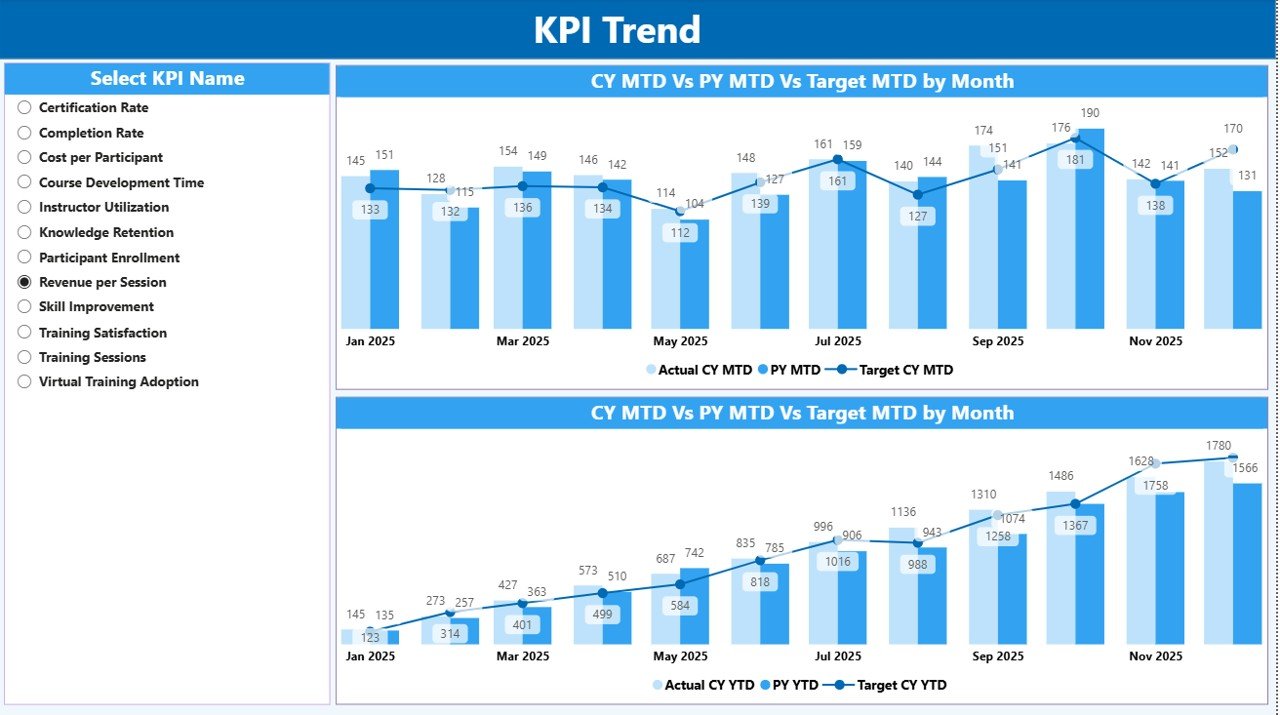
📊 KPI Trend Analysis Charts
Analyze long-term KPI performance trends using interactive combo charts.
🎯 Performance Indicators with Visual Icons
Green and red arrow indicators quickly highlight performance achievements and gaps.
🔎 Drill-Through KPI Definition Page
Understand the logic behind each KPI with detailed definitions, formulas, and measurement units.
📊 What’s Inside the Corporate Training Providers KPI Dashboard in Power BI
This Power BI solution includes three powerful analytical pages designed to help training providers monitor performance from multiple perspectives.
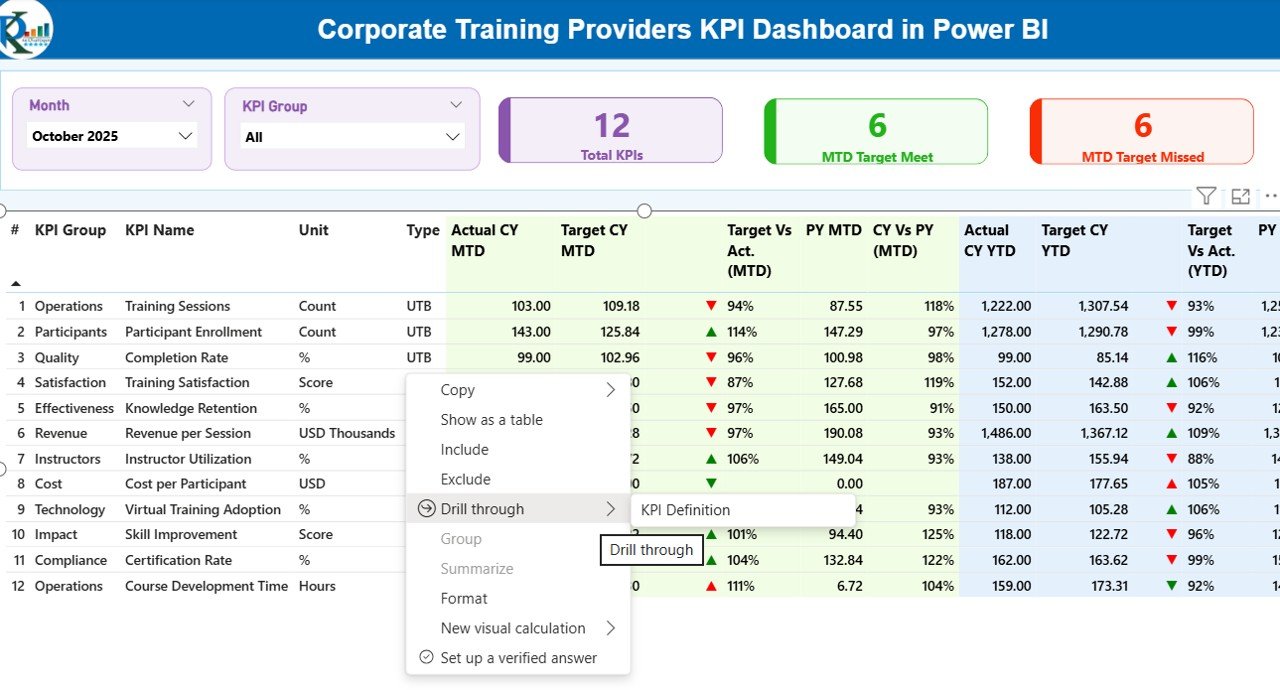
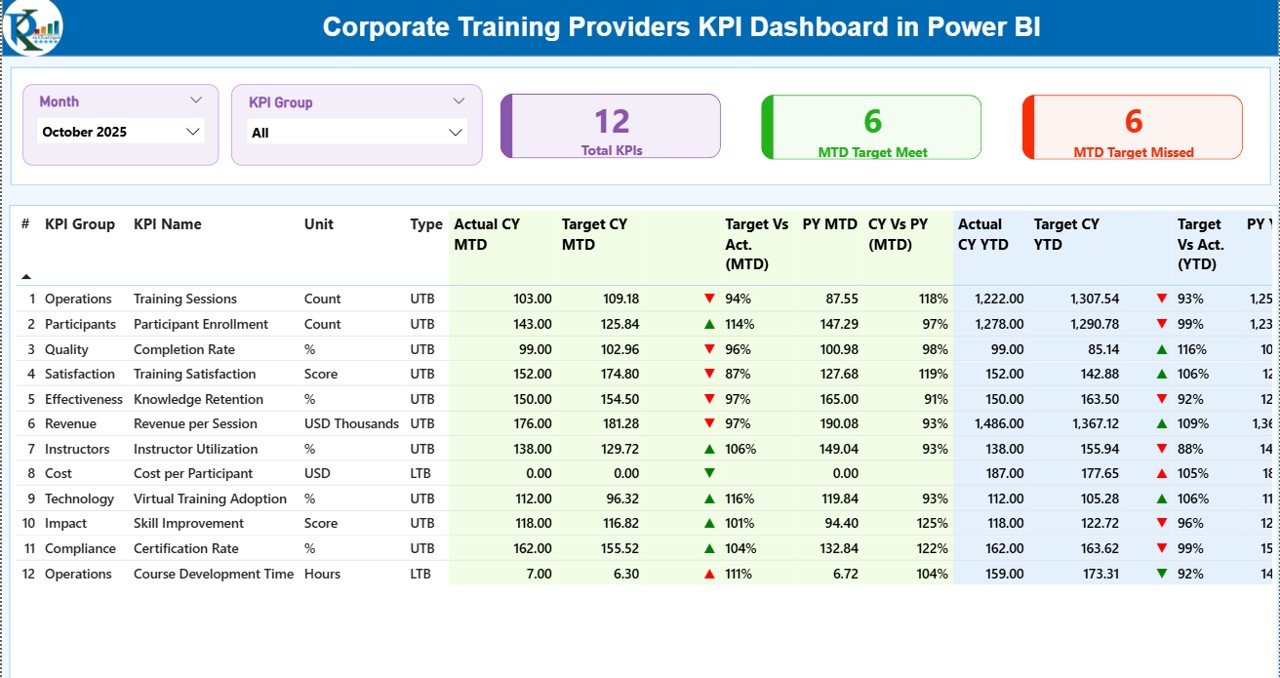
1️⃣ Summary Page – Main KPI Monitoring Dashboard
This page provides a complete overview of training KPIs. It includes:
-
KPI cards showing total KPIs tracked
-
MTD Target Met KPI count
-
MTD Target Missed KPI count
-
Detailed KPI performance table
-
Month slicer and KPI group slicer for filtering data
The detailed KPI table displays important information such as KPI name, KPI group, unit of measurement, KPI type, actual performance, target performance, and comparison indicators.
2️⃣ KPI Trend Page – Performance Trend Analysis
This page helps users analyze performance trends over time using interactive charts.
Users can analyze:
-
Current Year KPI performance
-
Previous Year KPI performance
-
Target performance trends
-
MTD and YTD performance comparisons
A KPI Name slicer allows managers to analyze individual KPI trends such as training completion rates, feedback scores, or engagement metrics.
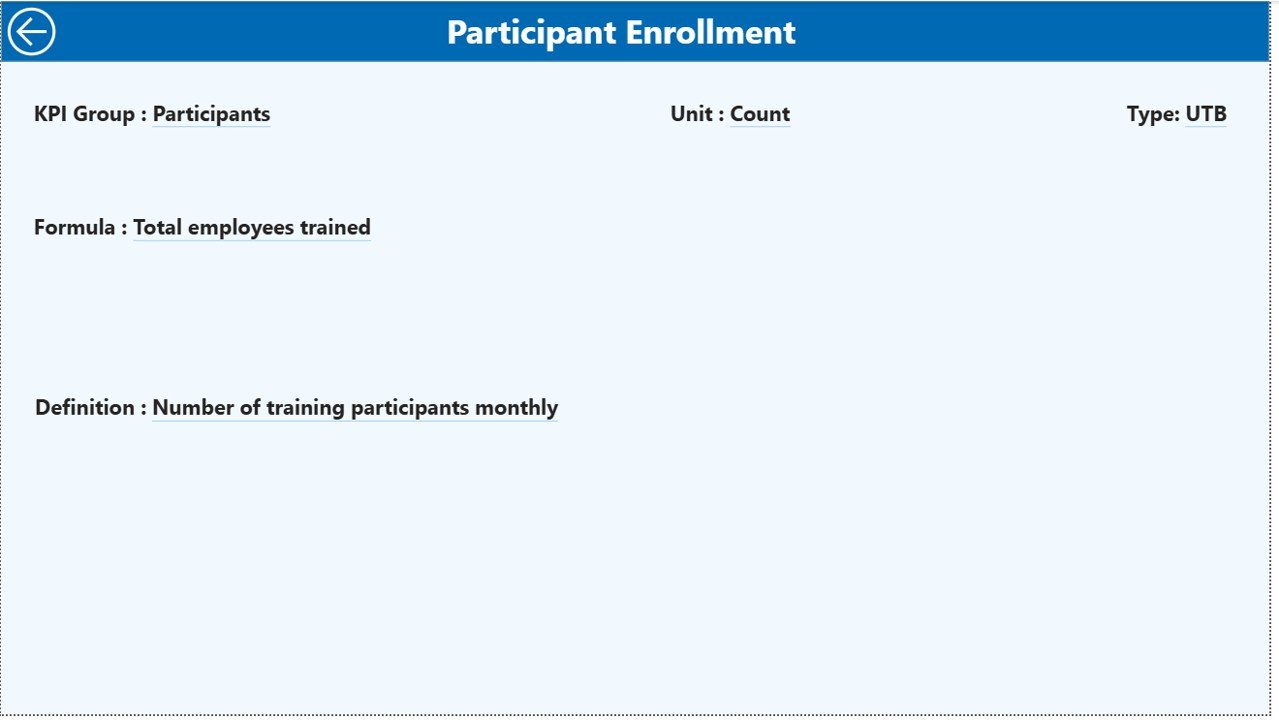
3️⃣ KPI Definition Page – Drill-Through KPI Insights
This page provides deeper understanding of each KPI.
It includes:
-
KPI definition
-
KPI formula
-
KPI measurement unit
-
KPI type (LTB or UTB)
Users can access this page through drill-through functionality directly from the Summary Page.
⚙️ How to Use the Corporate Training Providers KPI Dashboard in Power BI
Using this dashboard is simple and efficient.
Step 1: Update KPI performance data in the Excel input file.
Step 2: Refresh the Power BI dashboard to load updated data.
Step 3: Use slicers to filter KPIs by month or KPI group.
Step 4: Analyze performance using charts, KPI cards, and comparison metrics.
Step 5: Drill through to KPI definitions for deeper insights.
The Excel data source includes three sheets:
-
Input_Actual Sheet – stores actual KPI values
-
Input_Target Sheet – stores target KPI values
-
KPI Definition Sheet – stores KPI master data and definitions
Because Power BI integrates seamlessly with Excel, updating the dashboard becomes quick and easy.
🎯 Who Can Benefit from This Corporate Training Providers KPI Dashboard
This dashboard is ideal for professionals and organizations involved in corporate training and learning management.
It is especially useful for:
👨💼 Corporate training providers
👩💻 HR and learning & development teams
🏢 Corporate training departments
📊 Training managers and program coordinators
🎓 Corporate learning consultants
📈 Business analysts tracking training performance
🏫 Professional training institutes
Organizations that want to improve training effectiveness, measure ROI, and monitor learning outcomes will find this dashboard extremely valuable.
Click here to read the Detailed blog post
Watch the step-by-step video tutorial:


