In today’s competitive corporate environment, employee training is no longer optional — it’s a strategic investment. Yet, many organizations still rely on manual spreadsheets and disconnected reports, making it hard to measure training effectiveness, cost, and ROI.
That’s where the Corporate Training Dashboard in Excel becomes a complete game-changer.
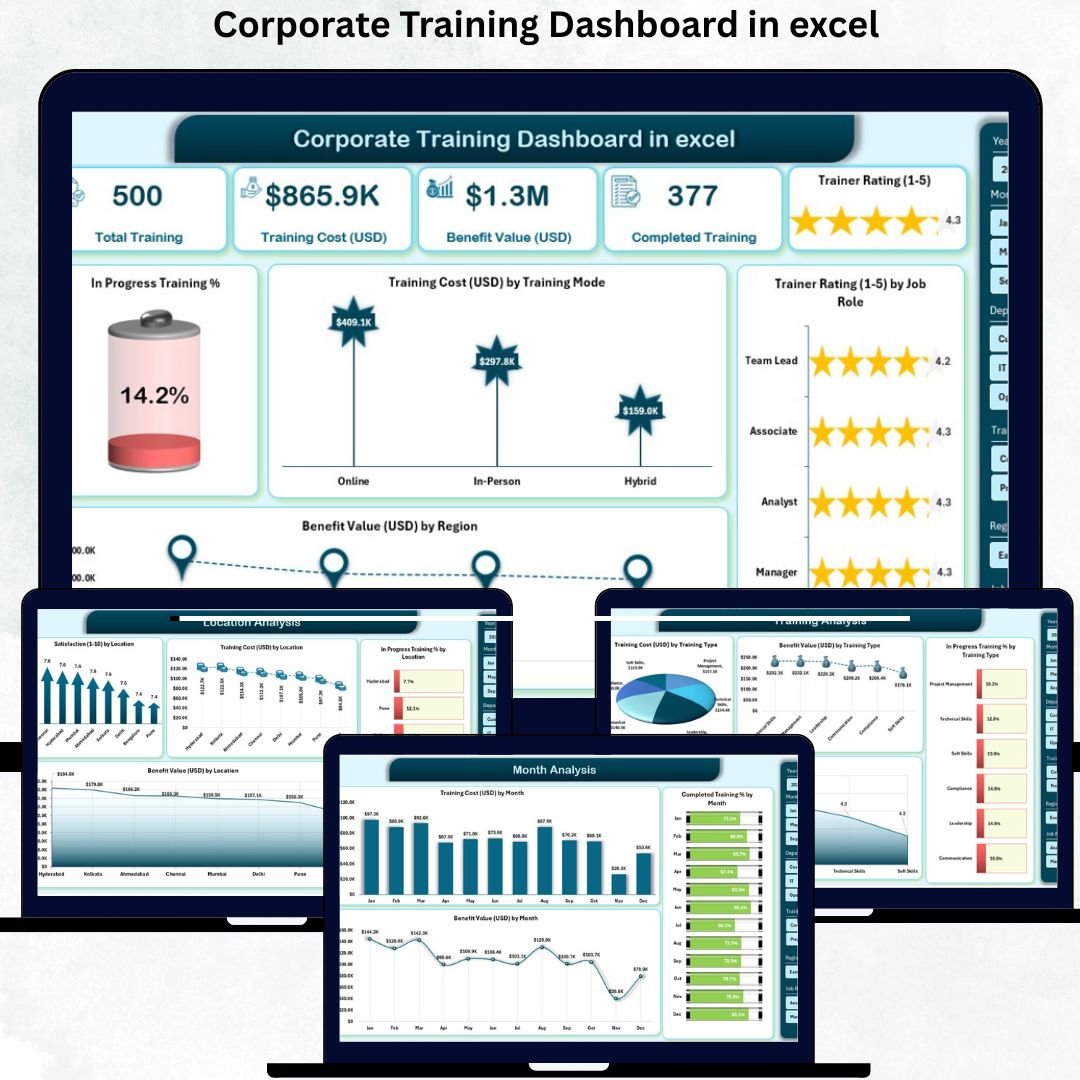
This ready-to-use Excel dashboard template empowers HR, L&D teams, and business leaders to monitor training performance, track costs, evaluate trainer ratings, and measure employee satisfaction — all in one clean, automated file. Built with pivot tables, slicers, and visual KPIs, this dashboard converts training data into actionable insights, without requiring any coding or advanced tools. 📊✨
🌟 Key Features of the Corporate Training Dashboard in Excel
🧭 1️⃣ Page Navigator – Simplified Navigation
Located on the left panel, the Page Navigator allows users to switch between pages effortlessly.
Quickly jump to:
-
Overview Page
-
Training Analysis
-
Department Analysis
-
Location Analysis
-
Month Analysis
💡 Purpose: Makes report navigation fast and intuitive — perfect for busy HR teams and managers.
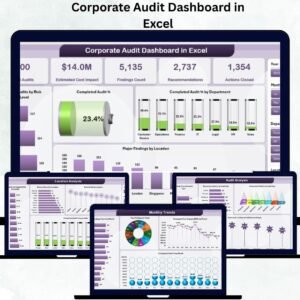
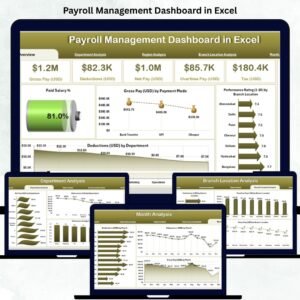
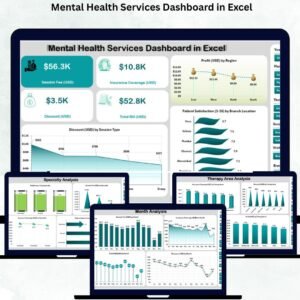
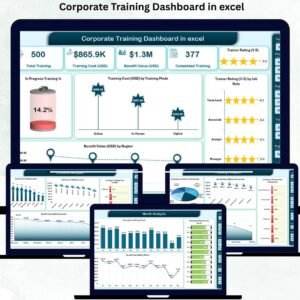
🏠 2️⃣ Overview Page – Training Summary Dashboard
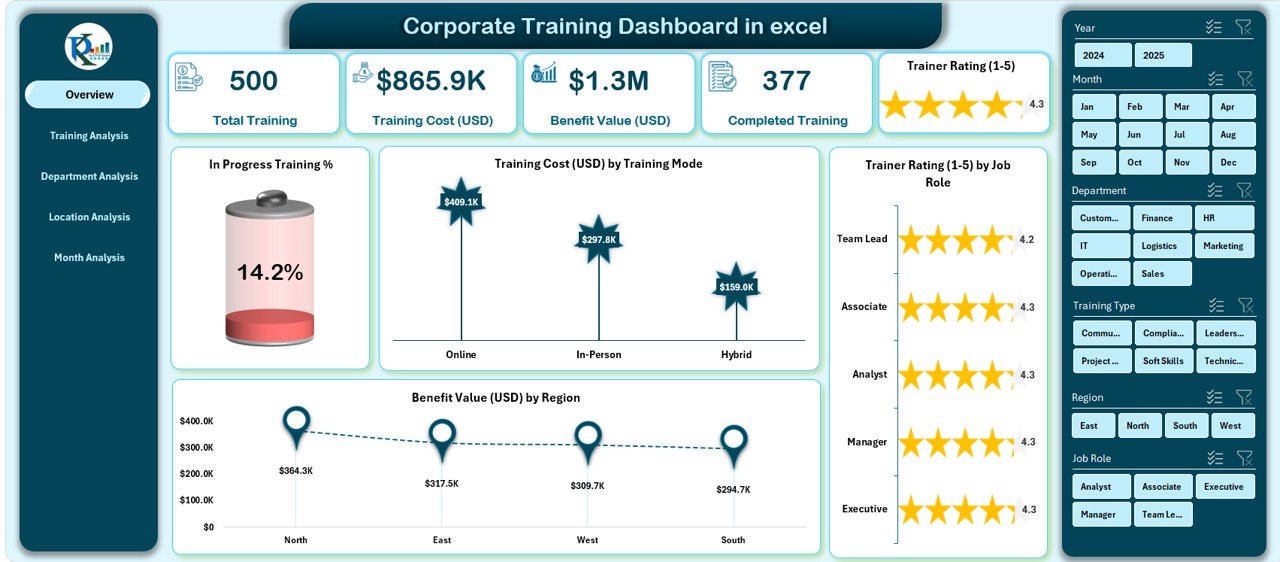
The Overview Page gives a bird’s-eye view of your entire corporate training performance.
Includes:
-
🧮 Five KPI Cards showing key stats like:
-
Total Training Count
-
Completed Training %
-
In Progress Training %
-
Total Training Cost (USD)
-
Total Benefit Value (USD)
-
-
📊 Four Charts:
-
In Progress Training %
-
Training Cost (USD) by Mode
-
Trainer Rating by Job Role
-
Benefit Value (USD) by Region
-
🎯 Outcome: Instantly understand progress, cost efficiency, and training impact across your organization.
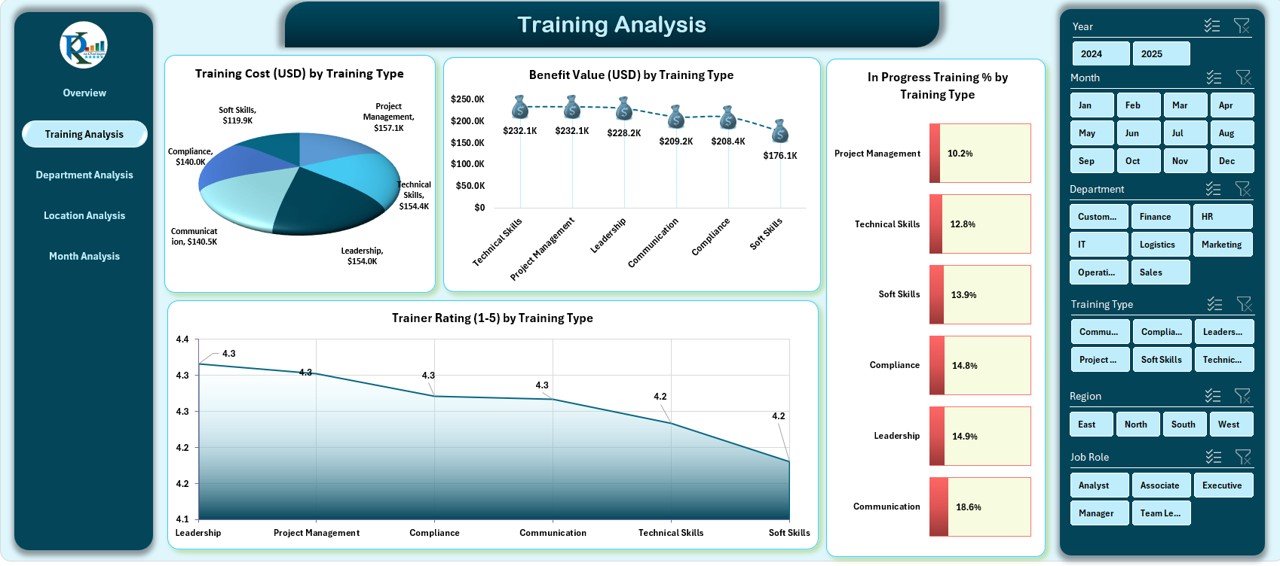
📘 3️⃣ Training Analysis Page – Deep Dive by Training Type
Get a detailed breakdown of your training activities by type.
Charts Displayed:
-
Training Cost (USD) by Training Type
-
Benefit Value (USD) by Training Type
-
In Progress Training % by Type
-
Trainer Rating by Type
📈 Benefit: Identify which training programs deliver the highest ROI and which need improvement.
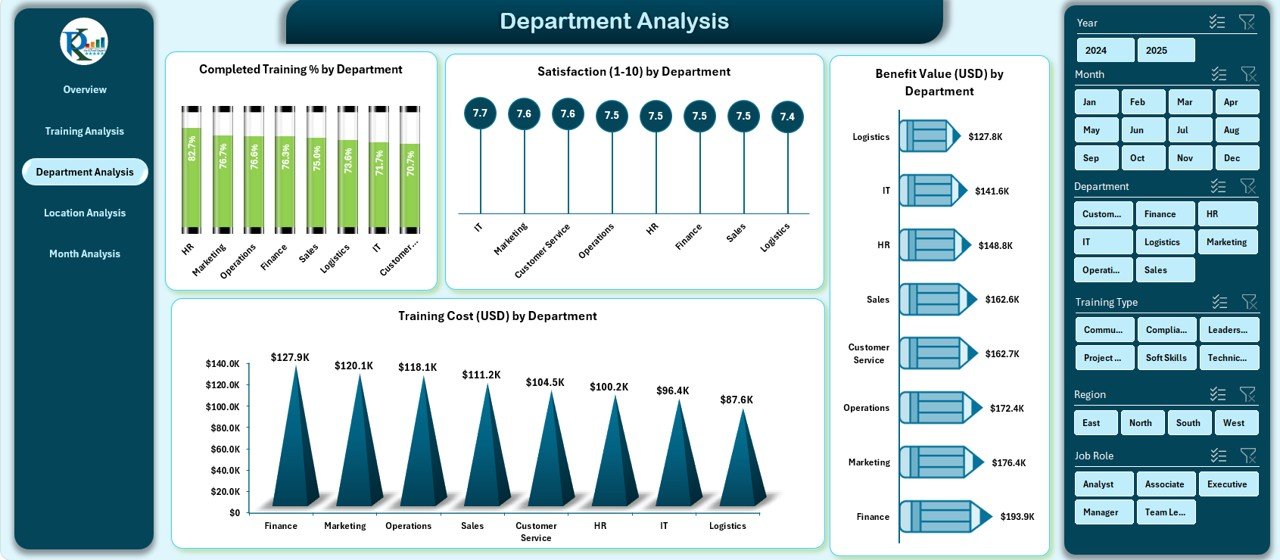
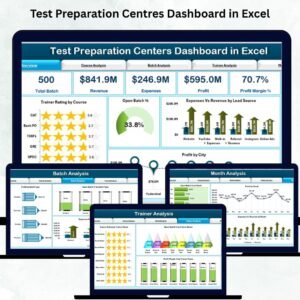
🧩 4️⃣ Department Analysis Page – Department-Wise Insights
Compare training results across all departments to ensure balanced growth.
Includes:
-
Completed Training % by Department
-
Satisfaction by Department
-
Benefit Value (USD) by Department
-
Training Cost (USD) by Department
💼 Use Case: Find top-performing departments and highlight areas needing additional support or resources.
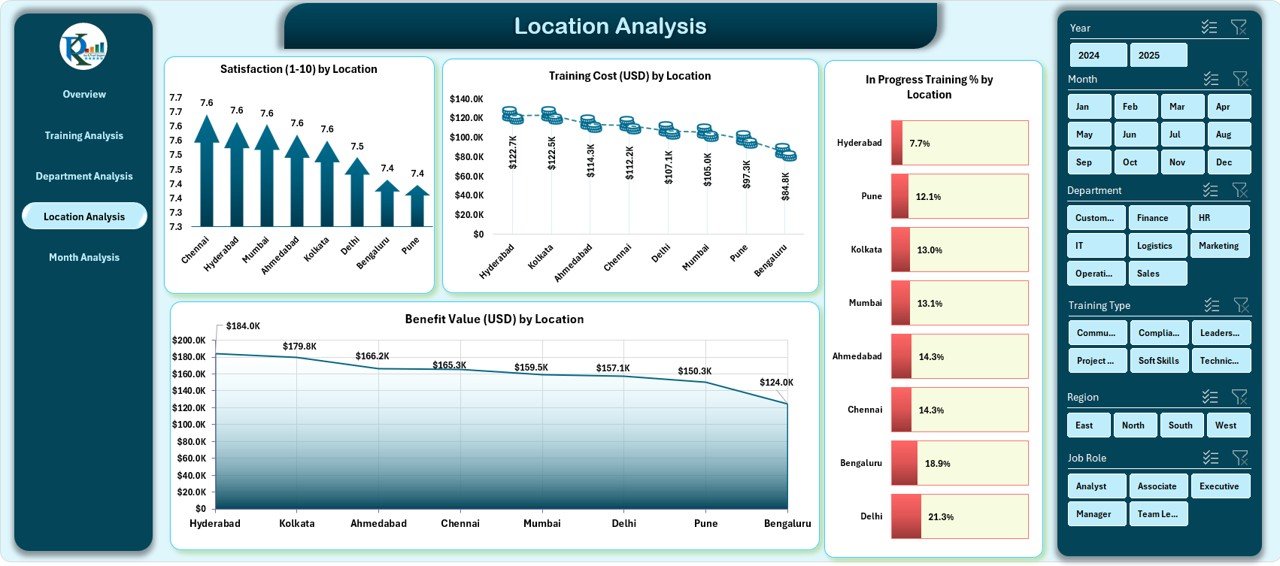
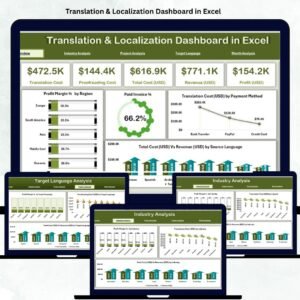
🌍 5️⃣ Location Analysis Page – Regional Comparison
Ideal for multi-location companies.
Visuals Include:
-
Satisfaction by Location
-
Training Cost (USD) by Location
-
In Progress Training % by Location
-
Benefit Value (USD) by Location
📊 Outcome: Understand regional trends and optimize budget allocation across branches or countries.
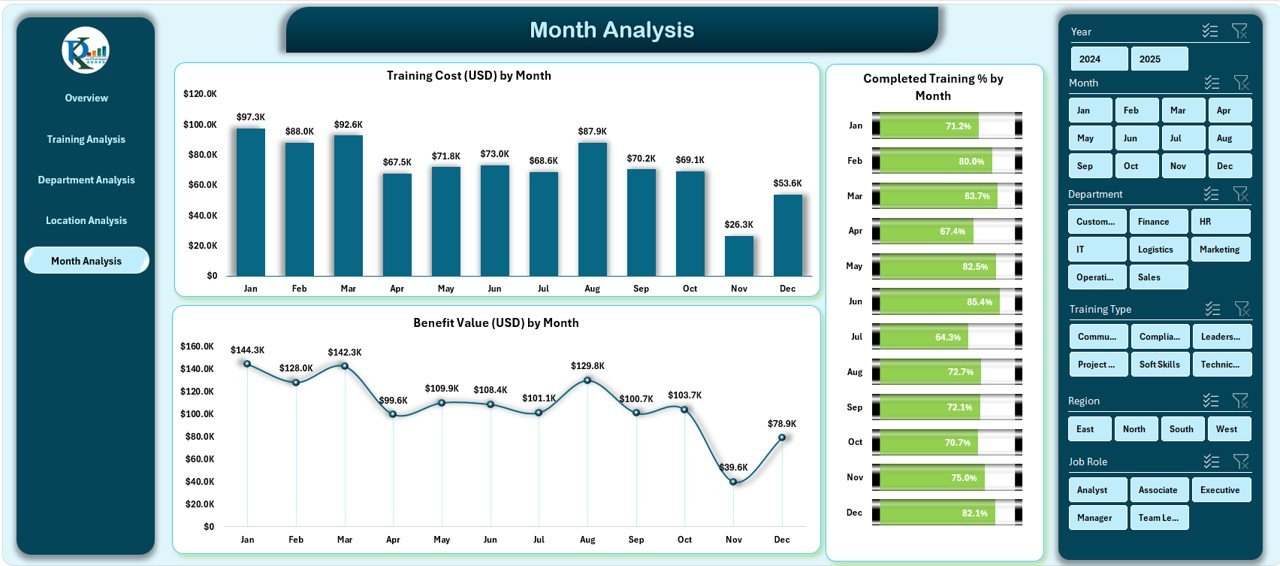
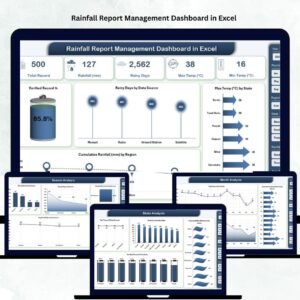
📅 6️⃣ Month Analysis Page – Trend Tracking Over Time
Monitor performance month-over-month.
Charts Include:
-
Training Cost (USD) by Month
-
Completed Training % by Month
-
Benefit Value (USD) by Month
🧭 Purpose: Identify seasonal trends, monitor progress, and plan future training calendars effectively.
⚙️ Support & Data Sheets
-
Support Sheet: Backend logic with pivot tables for automated visuals.
-
Data Sheet: Structured table containing all raw data — simply update it and refresh!
💼 Advantages of the Corporate Training Dashboard
✅ Centralized Data View: All metrics in one visual dashboard.
✅ Automated Insights: Refresh data to update charts instantly.
✅ Improved Decision-Making: See what’s working — and where to improve.
✅ Saves Time: No more manual chart creation or report formatting.
✅ Visual Storytelling: Beautiful, presentation-ready visuals for leadership reports.
✅ ROI Measurement: Compare training cost vs. benefit value for true business impact.
✅ Customizable Design: Add KPIs, modify slicers, or tailor color schemes easily.
🧠 How to Use the Dashboard
1️⃣ Open the Excel file.
2️⃣ Update your Data Sheet with the latest training details.
3️⃣ Avoid blank rows and keep column headers unchanged.
4️⃣ Click Refresh All to update charts automatically.
5️⃣ Use slicers to filter data by department, location, or trainer.
That’s it — your professional Corporate Training Dashboard is ready!
🧩 Best Practices
✅ Keep data clean and standardized.
✅ Refresh regularly to maintain real-time accuracy.
✅ Use consistent department/training names for better visuals.
✅ Protect formula and pivot sheets to prevent accidental edits.
✅ Compare Benefit Value vs. Training Cost monthly to track ROI.
🏁 Conclusion
The Corporate Training Dashboard in Excel is more than a spreadsheet — it’s a performance powerhouse.
From HR executives to department heads, anyone can use this dashboard to visualize progress, monitor ROI, and improve decision-making. With interactive visuals, dynamic filters, and automated analytics, it simplifies how companies manage training programs at every level.
📈 Streamline your corporate learning analytics today — exclusively at NextGenTemplates.com.


Reviews
There are no reviews yet.