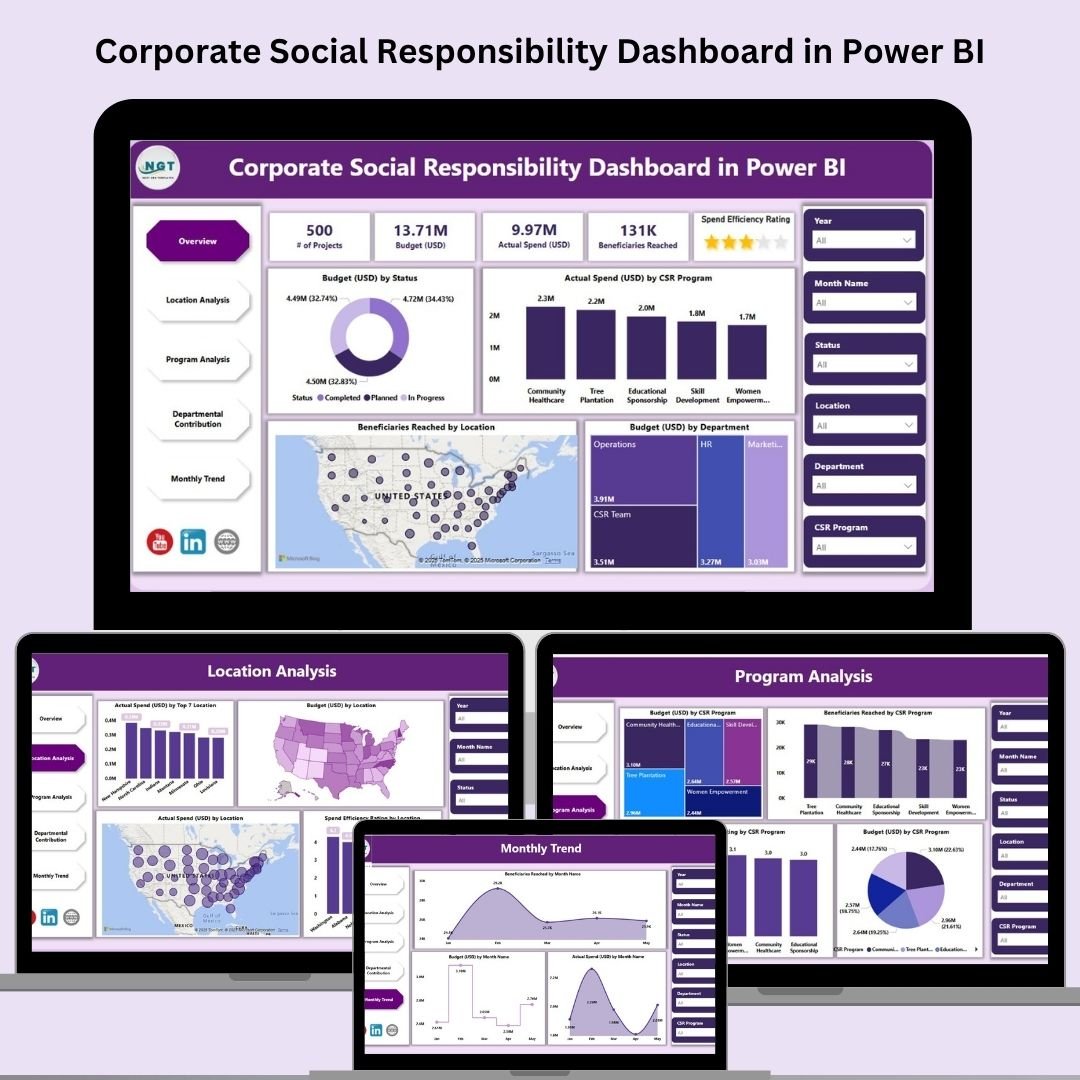
In the modern corporate world, CSR isn’t optional—it’s essential. But are you tracking your CSR initiatives effectively? With our Corporate Social Responsibility Dashboard in Power BI, you can move from scattered spreadsheets to crystal-clear, data-driven insights that drive real impact. 📊✨
This ready-to-use dashboard transforms your CSR metrics into powerful visuals so you can track budgets, monitor beneficiaries, and evaluate performance—all in one dynamic platform.
🔧 Key Features of Corporate Social Responsibility Dashboard
💼 5 Powerful Pages to Track Every CSR Metric
Our dashboard comes with 5 interactive pages, tailored for complete CSR analysis:
-
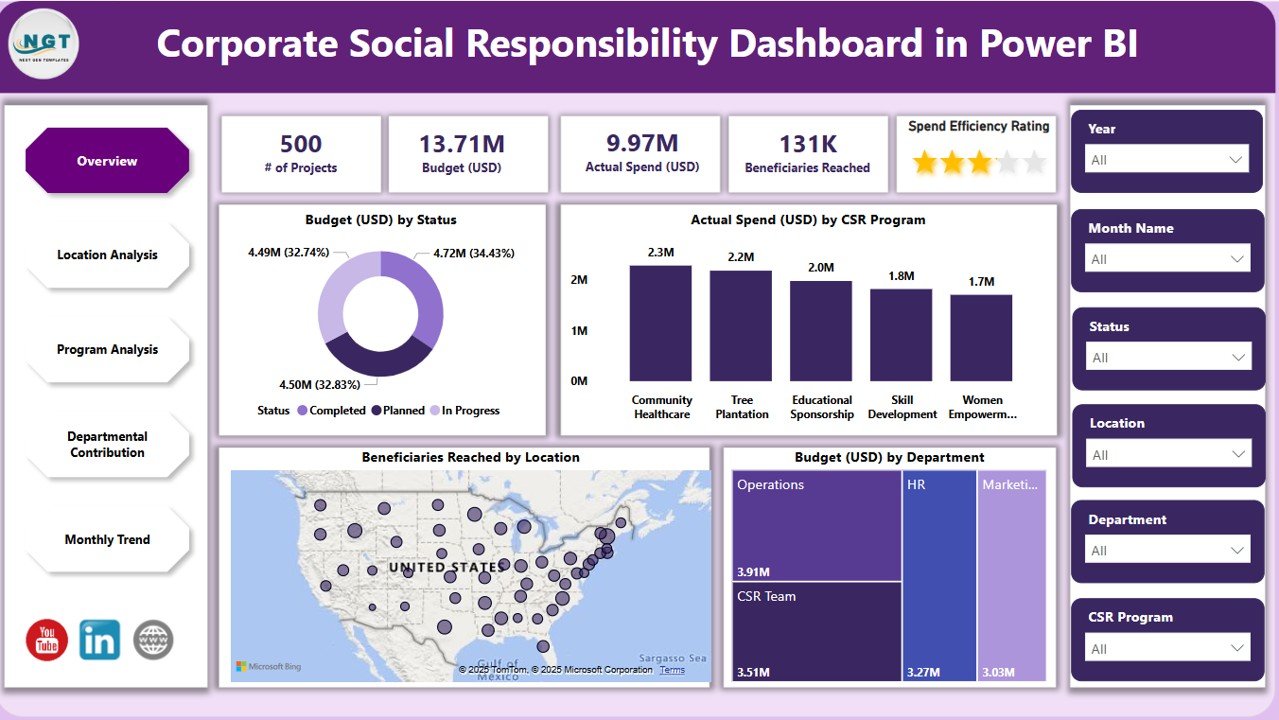
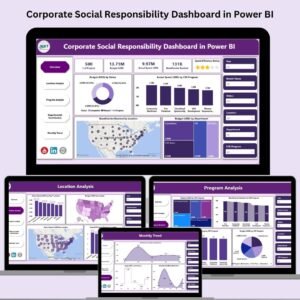
Overview Page: A snapshot of budgets, spending, and impact
-
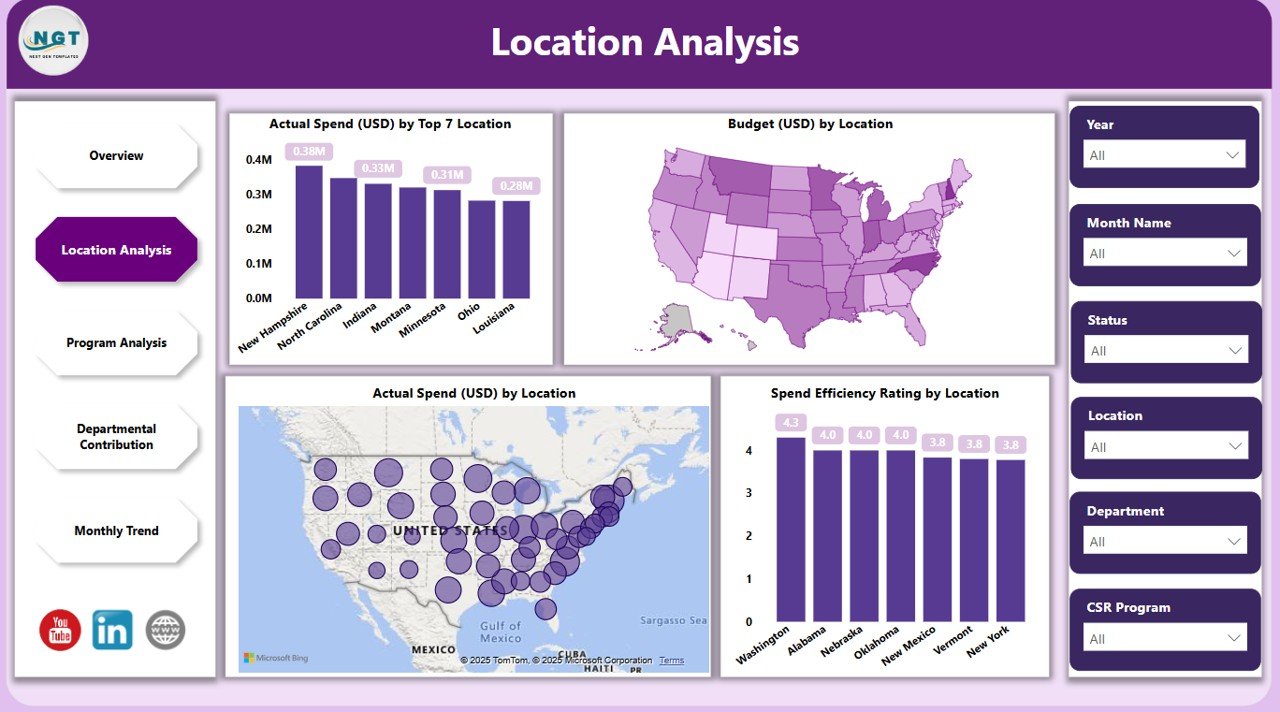
Location Analysis: Understand where your efforts are reaching
-
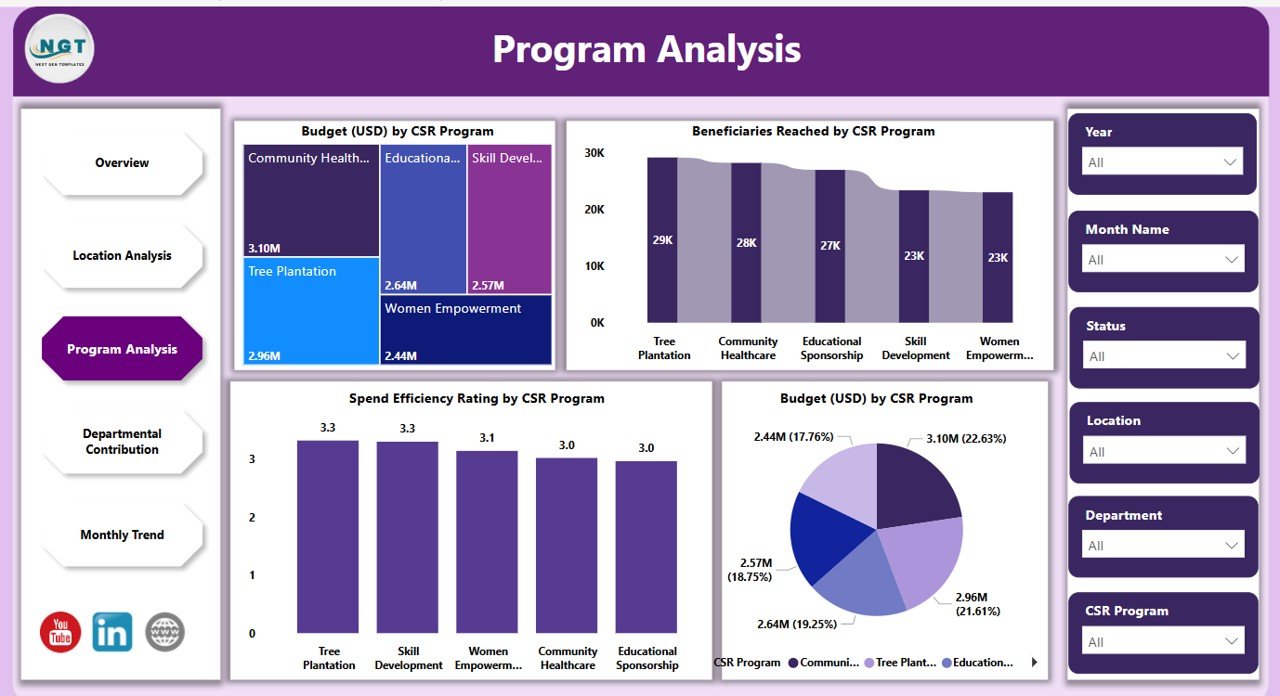
Program Analysis: Compare efficiency and impact across CSR initiatives
-
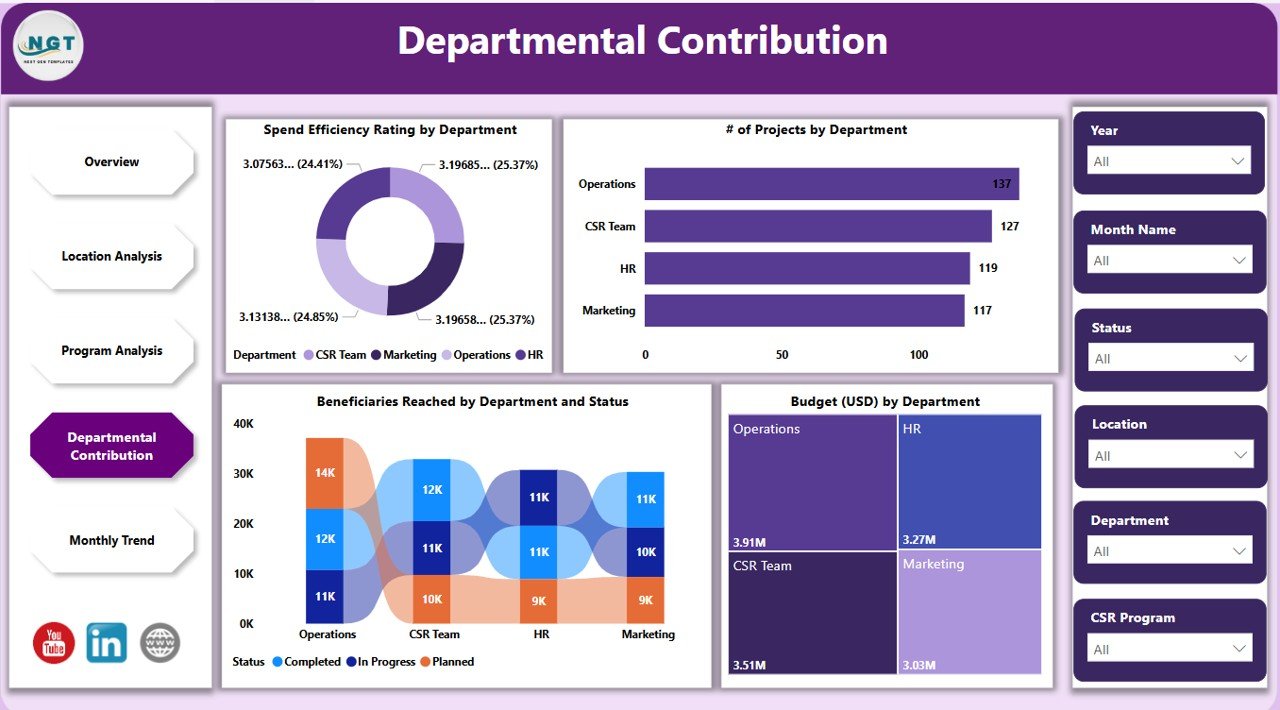
Departmental Contribution: Measure internal participation and accountability
-
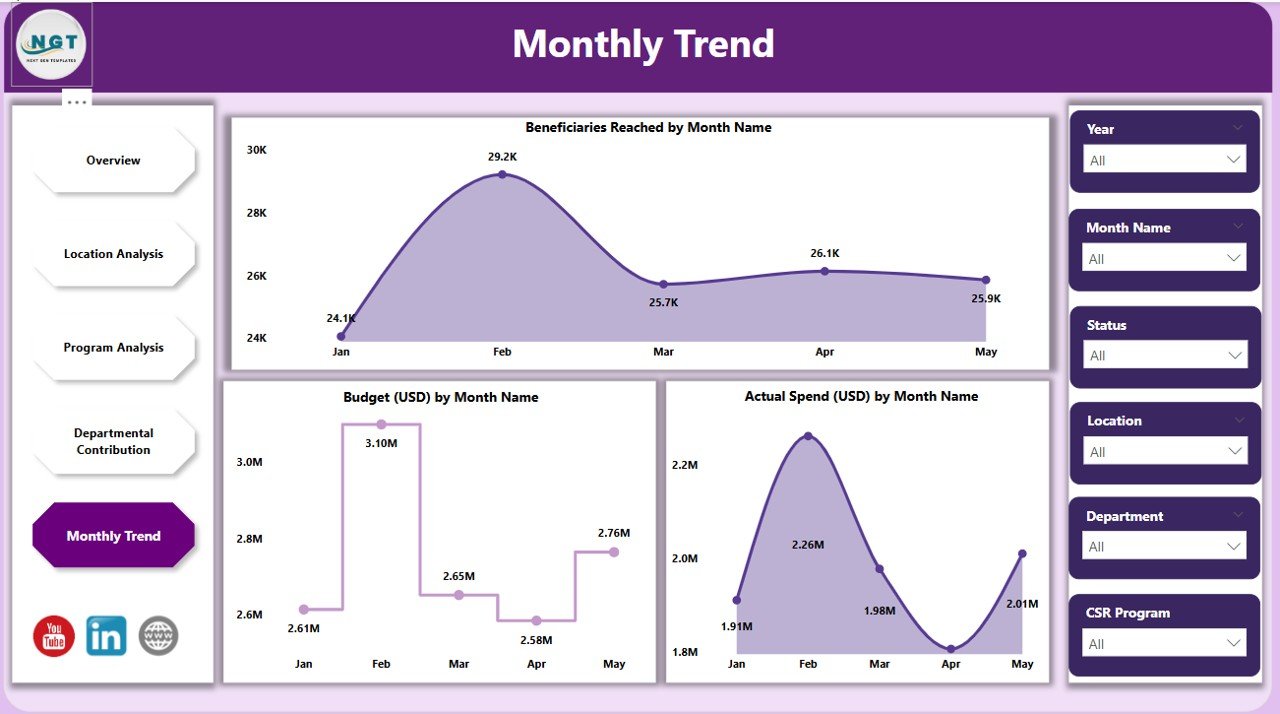
Monthly Trend: Track your progress over time
🎯 Insightful KPI Cards & Visual Charts
Stay on top of your goals with:
-
Budget vs. Actual Spend
-
Beneficiaries Reached
-
Spend Efficiency by Department/Location/Program
-
Monthly budget trends and usage summaries
🧩 Dynamic Slicers for In-Depth Filtering
Each page includes 6 slicers to easily filter by:
-
Year
-
Department
-
Location
-
CSR Program
-
Budget Status
-
Month
You can drill down to exactly the data you need—no manual digging required.
📂 What’s Inside the Corporate Social Responsibility Dashboard
With this tool, you’ll receive:
✅ A fully formatted Power BI dashboard (.pbix)
✅ Sample Excel data to plug in your own numbers
✅ 5 fully built pages with DAX-powered KPIs
✅ Predefined slicers, filters, and drill-downs
✅ Editable visuals and card elements
✅ Structured data model linked to your Excel source
✅ Designed for both internal reviews and public reporting
Whether you’re a CSR manager or a finance executive, this dashboard helps you track, explain, and improve your corporate contributions.
🛠️ How to Use the Corporate Social Responsibility Dashboard
1️⃣ Open Power BI Desktop
Download and open the dashboard file in Power BI Desktop (free version supported).
2️⃣ Replace with Your Data
Connect your Excel file containing CSR data like programs, budgets, spend, departments, and locations.
3️⃣ Hit Refresh
Visuals, cards, and charts will auto-update to reflect your latest numbers.
4️⃣ Filter as Needed
Use the 6 slicers on each page to zoom into location-specific or department-wise CSR performance.
5️⃣ Share with Stakeholders
Export visuals, share via Power BI Service (Pro), or use in annual CSR reports.
👥 Who Can Benefit from This Dashboard
This tool is ideal for:
🌟 CSR Managers – Track real-time impact and efficiency
📊 Finance Teams – Monitor budget vs actual spend across projects
🏢 Executives – See high-level CSR performance at a glance
📣 PR & Communications Teams – Share transparent reports with the public
🧩 Operations Leaders – Spot low-performing initiatives and optimize
Whether you’re running community programs or sustainability initiatives, this dashboard helps you tell a compelling, data-backed story.
✅ Click here to read the Detailed blog post
🔗 Visit our YouTube channel to learn step-by-step video tutorials


Reviews
There are no reviews yet.