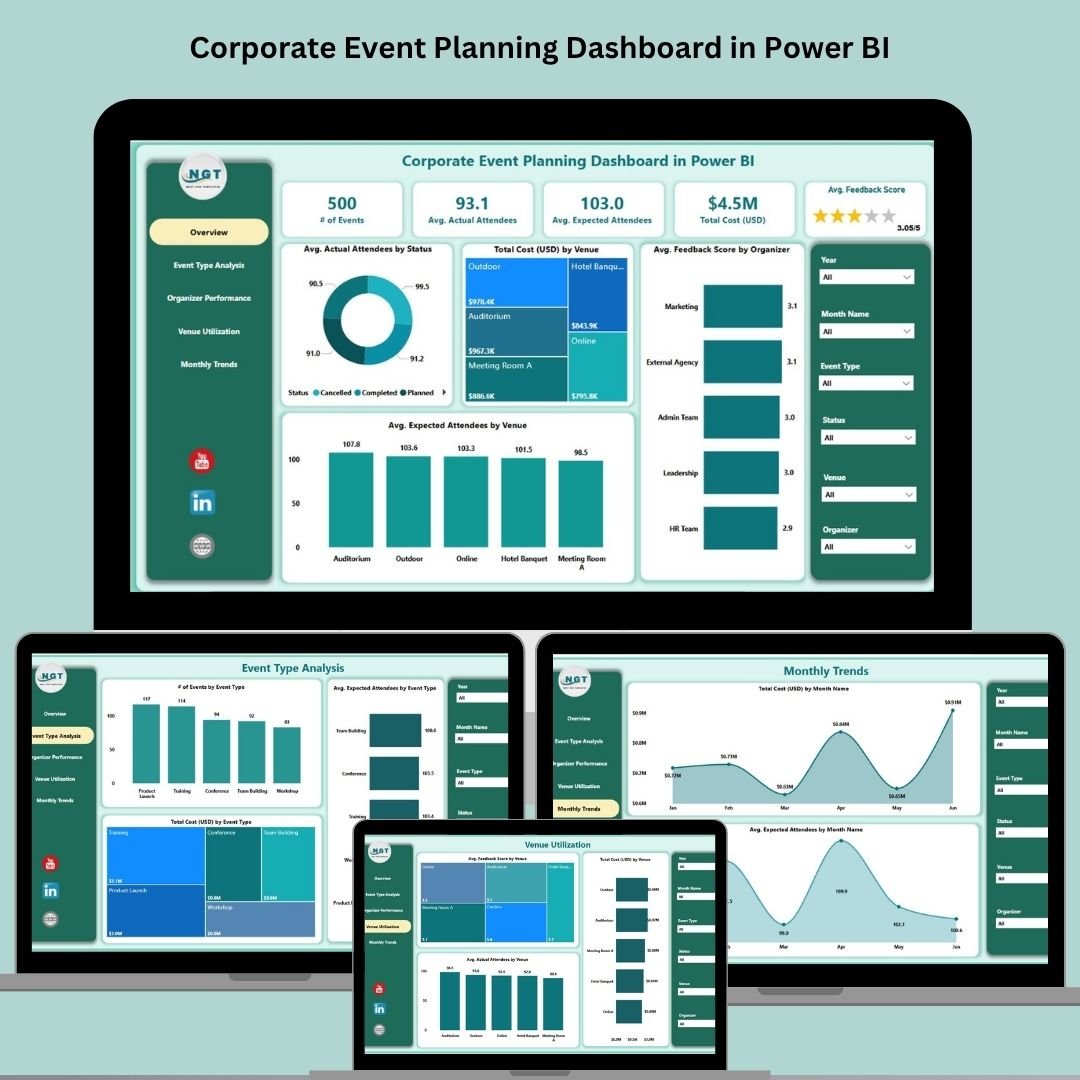
Planning corporate events can be chaotic — juggling attendee numbers, costs, venues, and feedback is no small feat. That’s where our Corporate Event Planning Dashboard in Power BI steps in. 🎉 This ready-to-use, fully interactive dashboard helps you manage everything — from budgeting and scheduling to organizer performance and attendee engagement — with just a few clicks. 📊
Whether you’re organizing leadership summits, workshops, conferences, or internal team-building events, this dashboard is your one-stop solution for streamlined event planning, analytics, and reporting.
✨ Key Features of Corporate Event Planning Dashboard
🧭 Multi-Page Dashboard Layout
Power BI brings your event data to life across 5 powerful tabs:
-
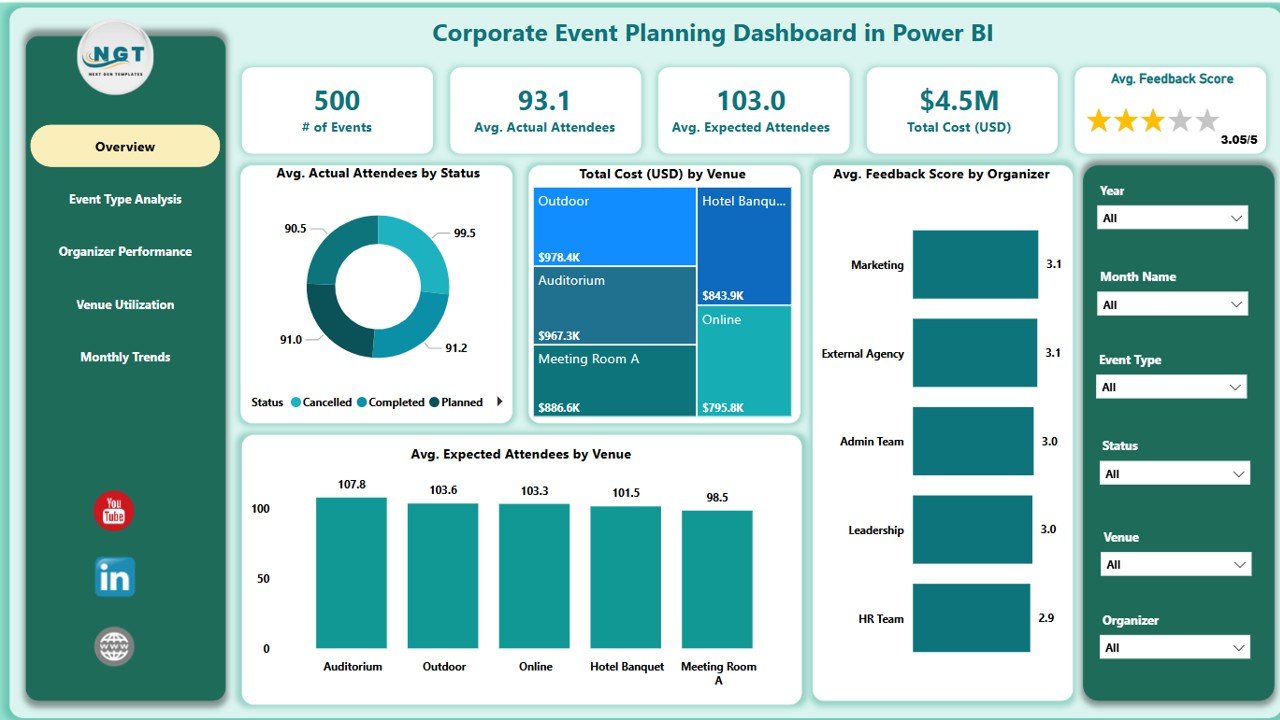
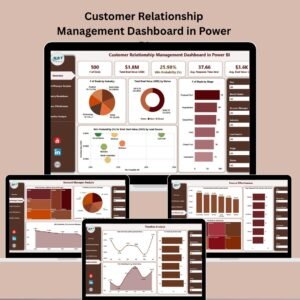
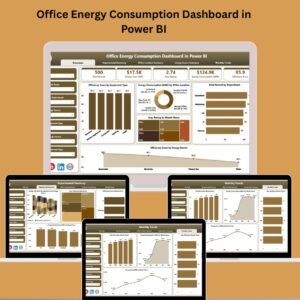
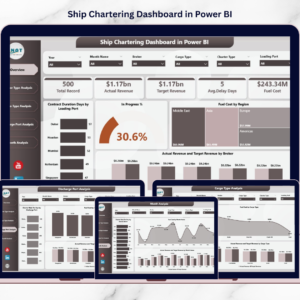
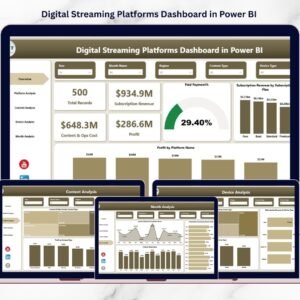
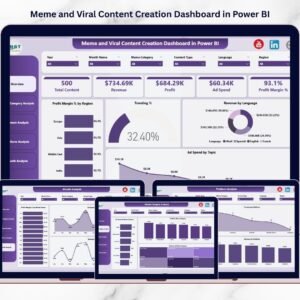
Overview Page – Total Events, Attendees, Cost & Feedback KPIs
-
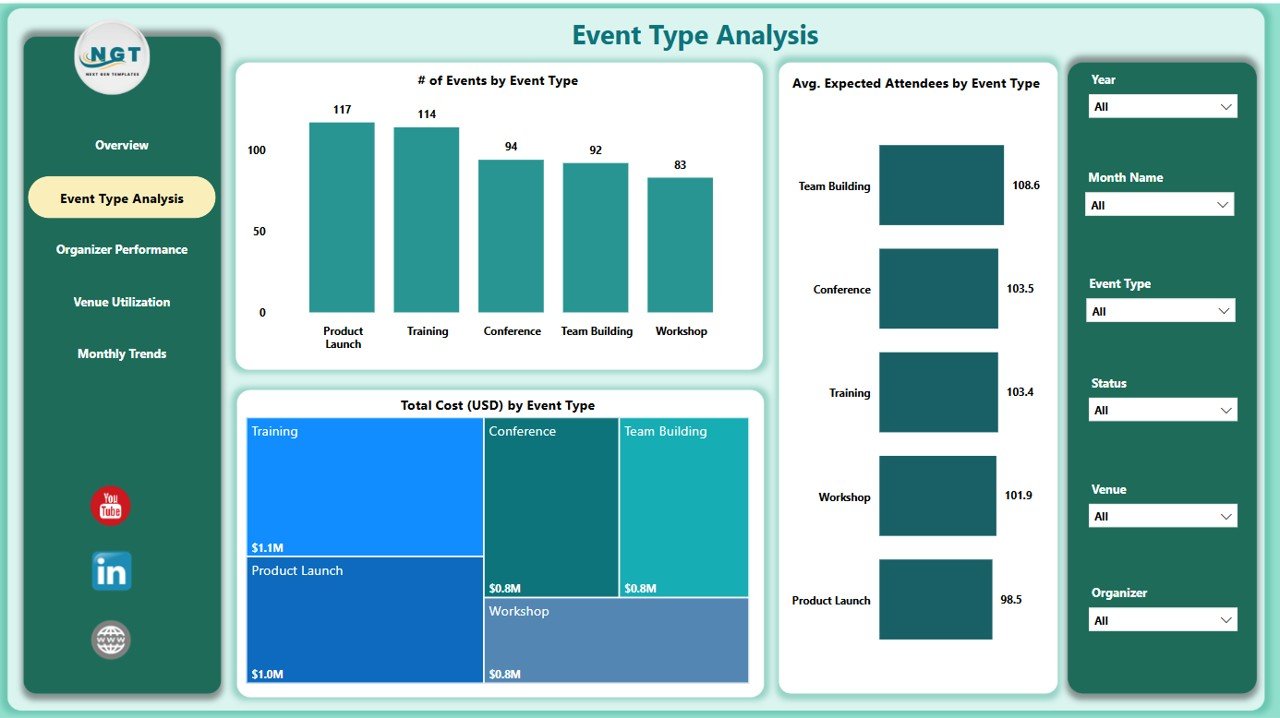
Event Type Analysis – Visualize event popularity and efficiency
-
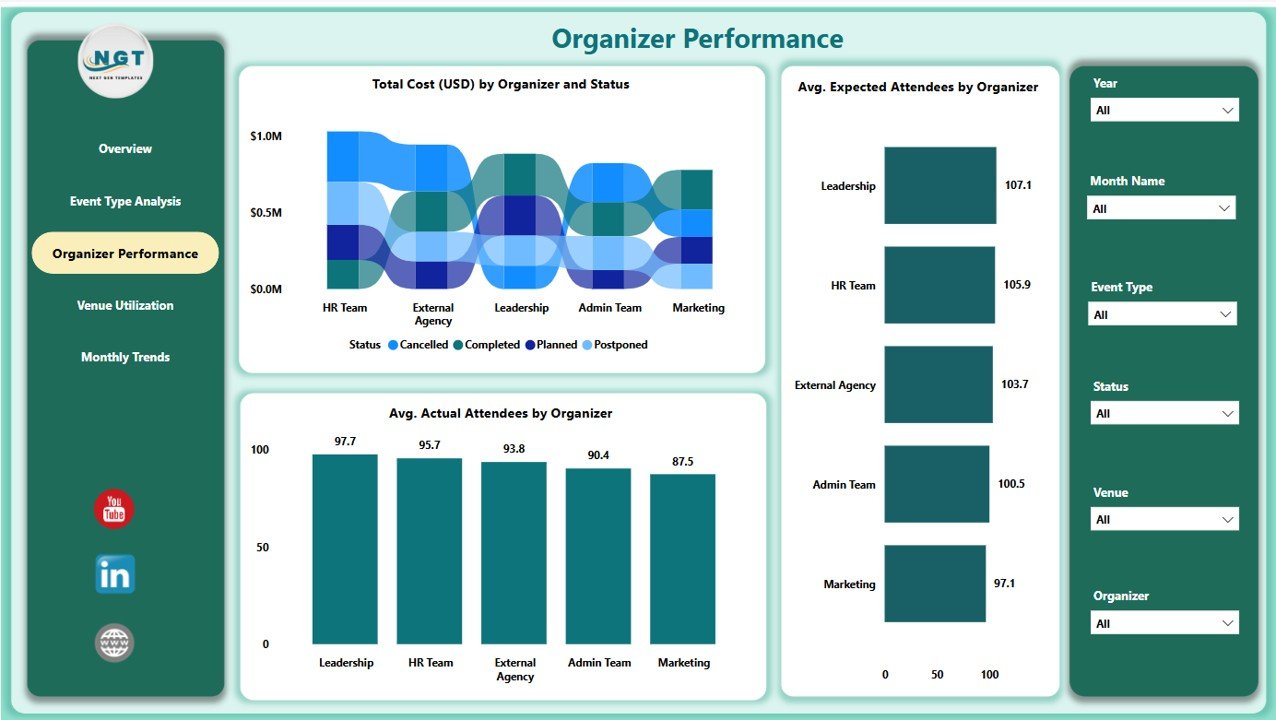
Organizer Performance – Compare results across planners
-
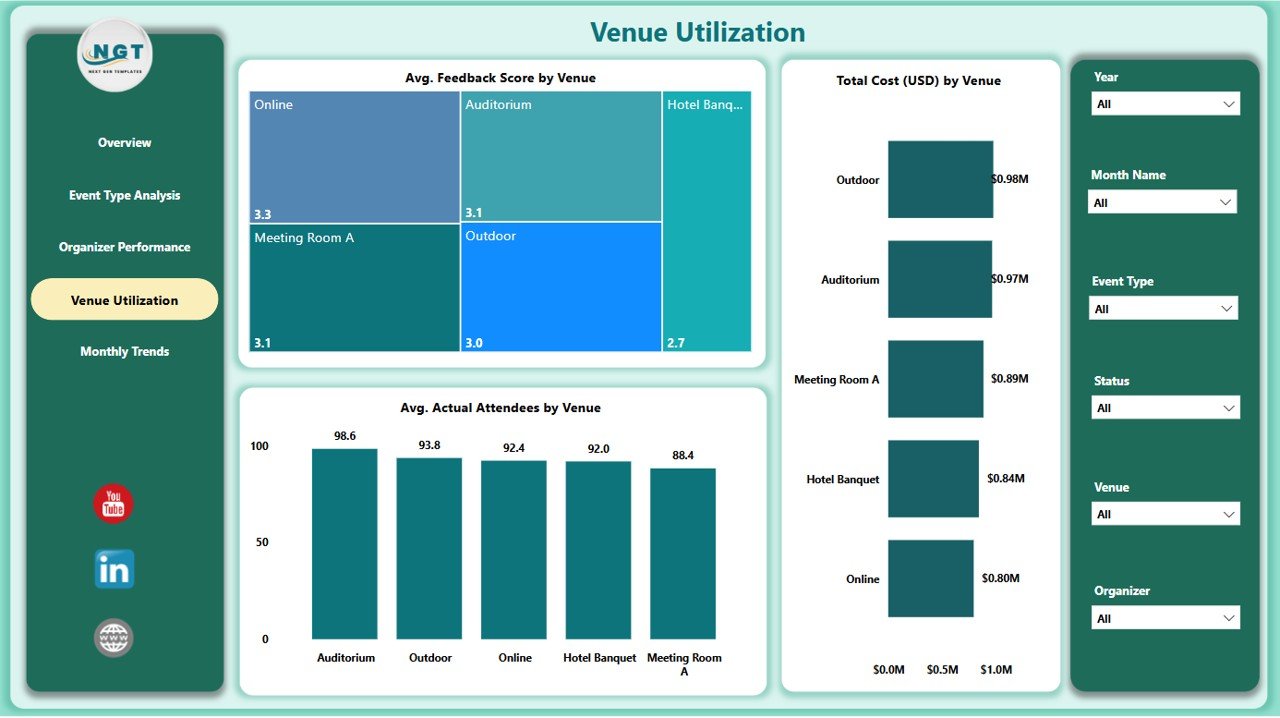
Venue Utilization – Identify the most effective venues
-
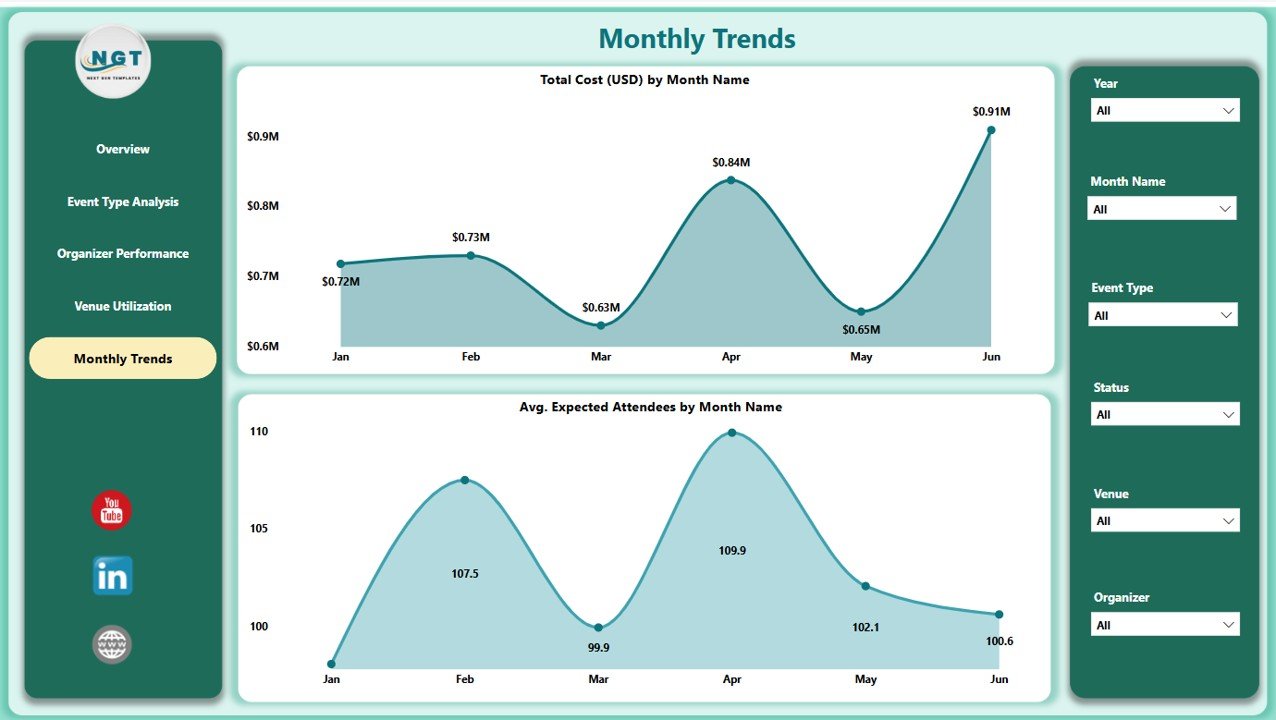
Monthly Trends – Monitor performance over time
🎛️ Dynamic Filters and Slicers
Every page includes 6 interactive slicers — filter by:
-
Event Status
-
Date Range
-
Organizer
-
Venue
-
Event Type
…and more!
💹 Smart Visuals and KPIs
-
KPI Cards (Total Events, Expected/Actual Attendees, Avg. Feedback)
-
Trendline charts by month
-
Bar and column charts comparing cost, attendance, and satisfaction
-
Color-coded metrics for quick insights
📦 What’s Inside the Dashboard?
Inside the Power BI file (.pbix), you get:
✅ 5 Pre-built Analysis Pages
✅ Auto-calculating KPI Cards
✅ Clickable Slicers
✅ Visual Breakdown by Organizer, Venue & Event Type
✅ Month-wise Trends and ROI Indicators
✅ Seamless Excel Data Integration
✅ Clean, User-Friendly Layout
All visuals are editable, and the dashboard is plug-and-play with your Excel event log.
🛠️ How to Use the Dashboard
1️⃣ Prepare Your Data
Set up your Excel file with event name, date, organizer, venue, cost, and feedback.
2️⃣ Connect to Power BI
Import your file and update the Power BI dashboard using built-in queries.
3️⃣ Use Slicers to Filter Views
Filter by month, organizer, venue, or event type in seconds.
4️⃣ Review Key Metrics
Spot performance patterns and identify what’s working (or not).
5️⃣ Share & Export
Publish it to Power BI Service and export visuals as needed.
🎯 Who Can Benefit from This Dashboard?
👥 Event Managers – Monitor event health and logistics
📢 Marketing Teams – Analyze event campaign results
🏢 HR Departments – Track internal event success
📊 CXOs & Admins – Evaluate ROI and team performance
🧠 Business Analysts – Make data-backed planning decisions
This dashboard gives visibility, accountability, and control to all stakeholders in your organization.
✅ Click here to read the Detailed blog post
🔗 Visit our YouTube channel to learn step-by-step video tutorials


Reviews
There are no reviews yet.