Managing a content marketing agency means handling multiple campaigns, platforms, budgets, and client expectations—often at the same time. Without a structured reporting system, teams waste countless hours preparing Excel sheets, comparing results, and trying to understand what’s working. This leads to confusion, missed opportunities, slow decision-making, and reduced profitability.
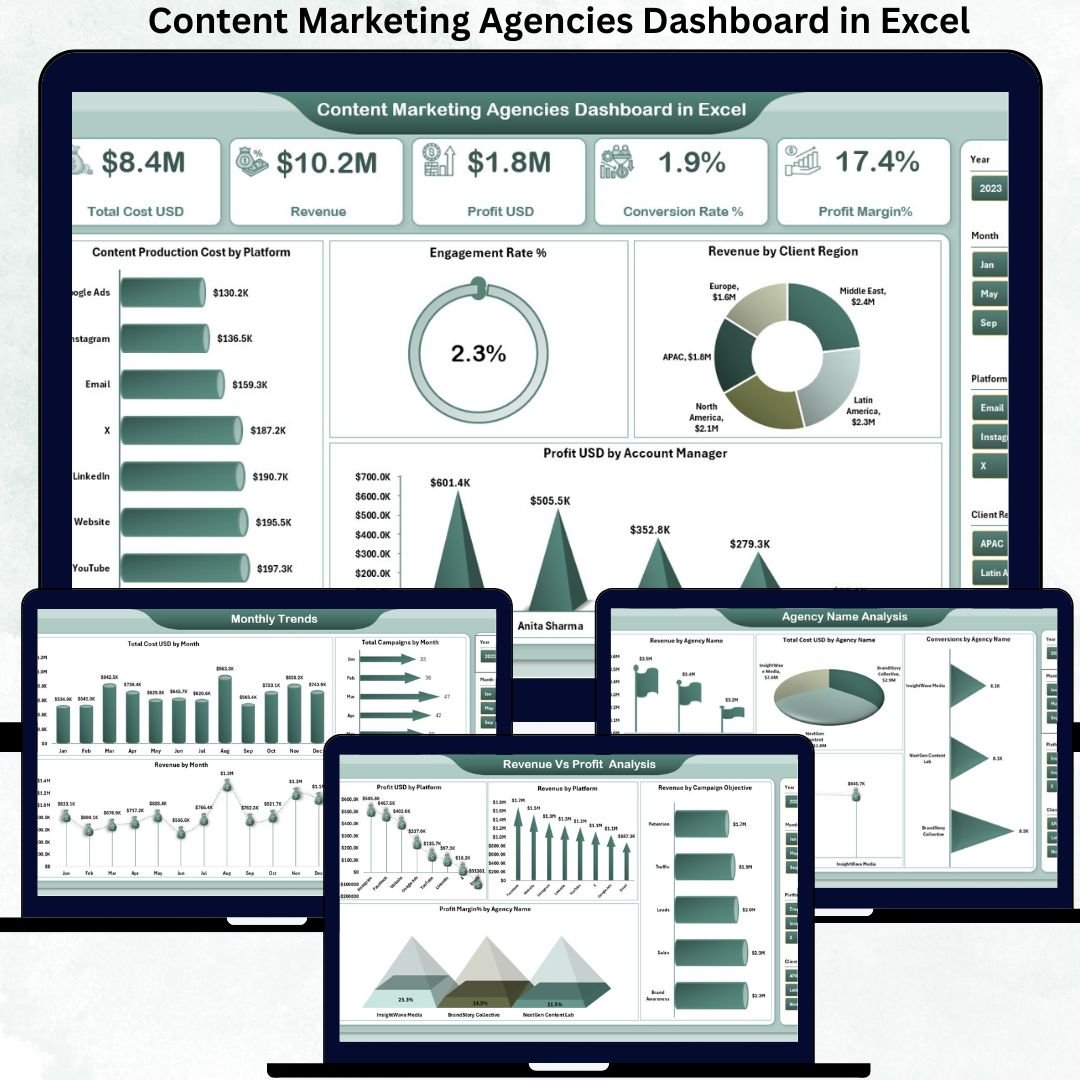
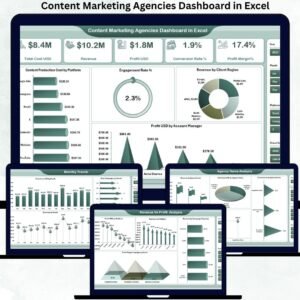
The Content Marketing Agencies Dashboard in Excel solves all these problems instantly. This powerful, ready-to-use dashboard gives you a complete 360° view of cost, revenue, profit, conversion rate, engagement, and performance across agencies, platforms, campaigns, and regions. Designed for modern marketing teams, this dashboard brings clarity, saves time, and improves the way agencies manage their operations.
With five intelligent analytical pages, automated KPI cards, interactive slicers, and clean visuals, this dashboard becomes the backbone of your agency’s reporting and performance tracking system. Everything works automatically—update the data sheet and your dashboard refreshes with fresh insights in seconds. No complex formulas. No manual effort. Just fast, accurate, decision-ready reports. 🚀
Key Features of the Content Marketing Agencies Dashboard in Excel
Your dashboard comes with a rich set of features built specifically for marketing teams:
✨ 5 Insightful Analytical Pages – Overview, Agency Analysis, Revenue vs Profit, Cost Analysis & Monthly Trends
📊 Interactive KPI Cards – Track revenue, profit, cost, conversion, and margin instantly
🖥️ Clean & Professional Visuals – Charts that simplify complex data into actionable insights
🎯 Right-Side Slicer Panel – Filter by Agency, Platform, Client Region, Campaign Objective, and more
💰 Budgeting & Cost Control Tools – Identify where money is spent and where savings are possible
📈 Performance Heat Maps – Compare account managers, agencies, and platforms easily
📝 Completely Automated – Just update the data sheet and the dashboard refreshes
This dashboard brings clarity to every marketing activity—something every agency needs.
What’s Inside the Content Marketing Agencies Dashboard in Excel
Inside the file, you get a complete reporting system that includes:
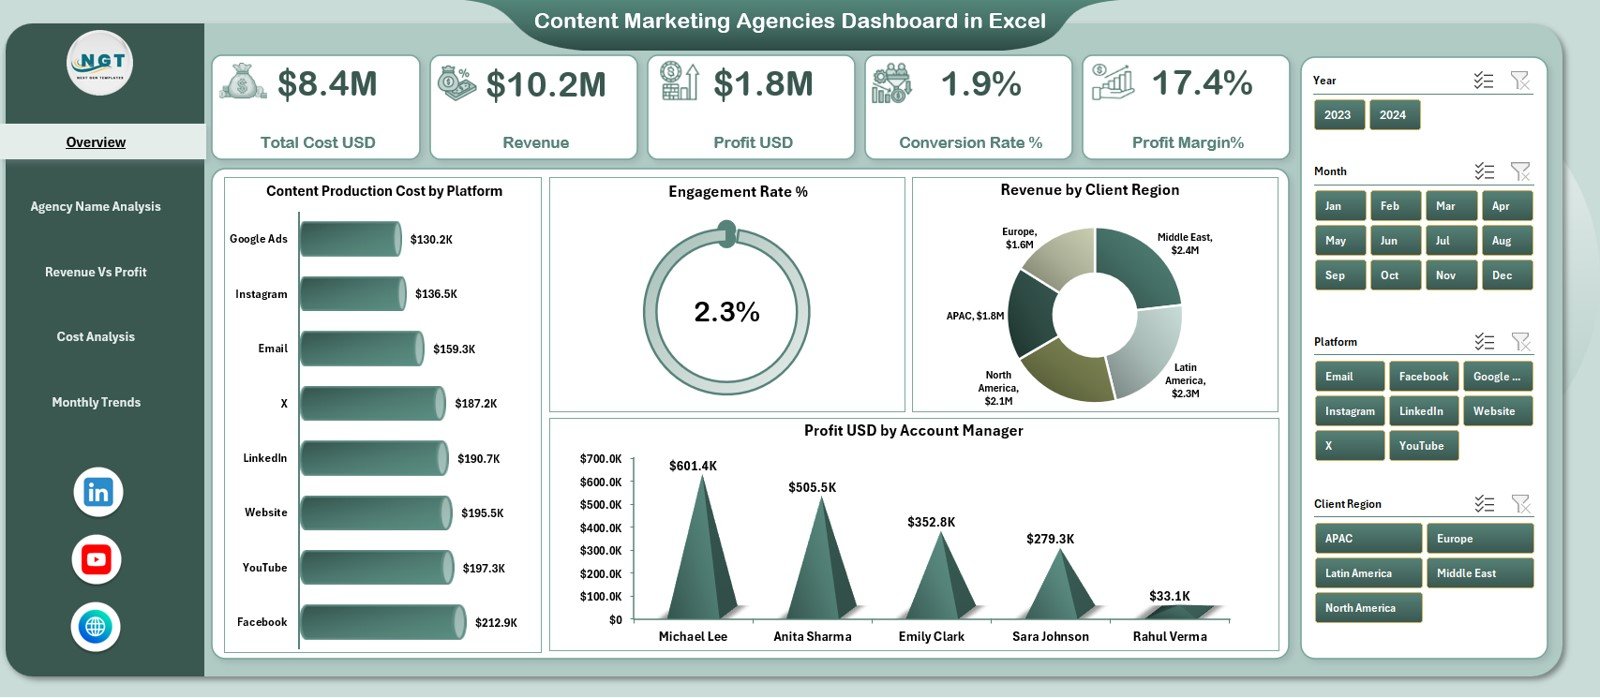
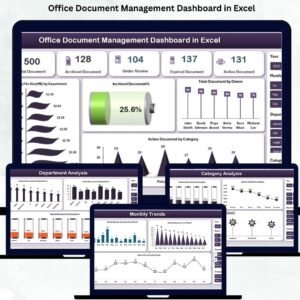
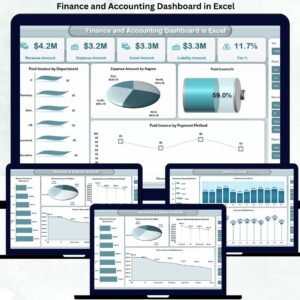
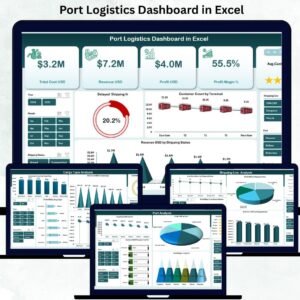
📌 Overview Page – View total cost, revenue, engagement, and profit at a glance
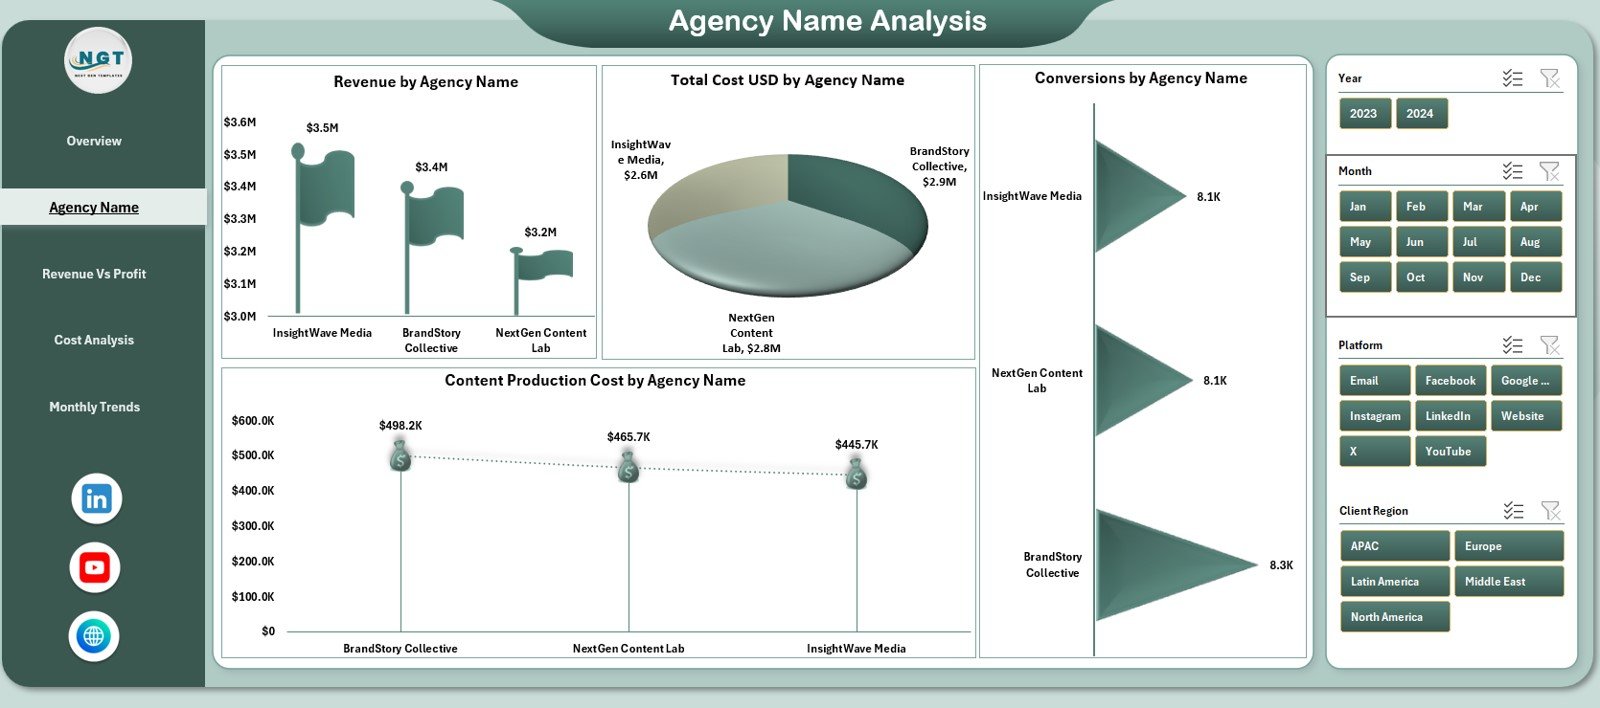
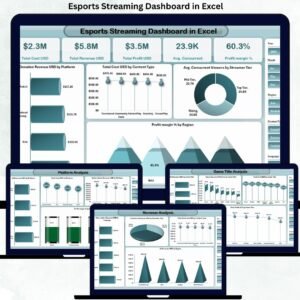
📌 Agency Name Analysis – Compare KPIs across agencies using revenue, conversion, and cost visuals
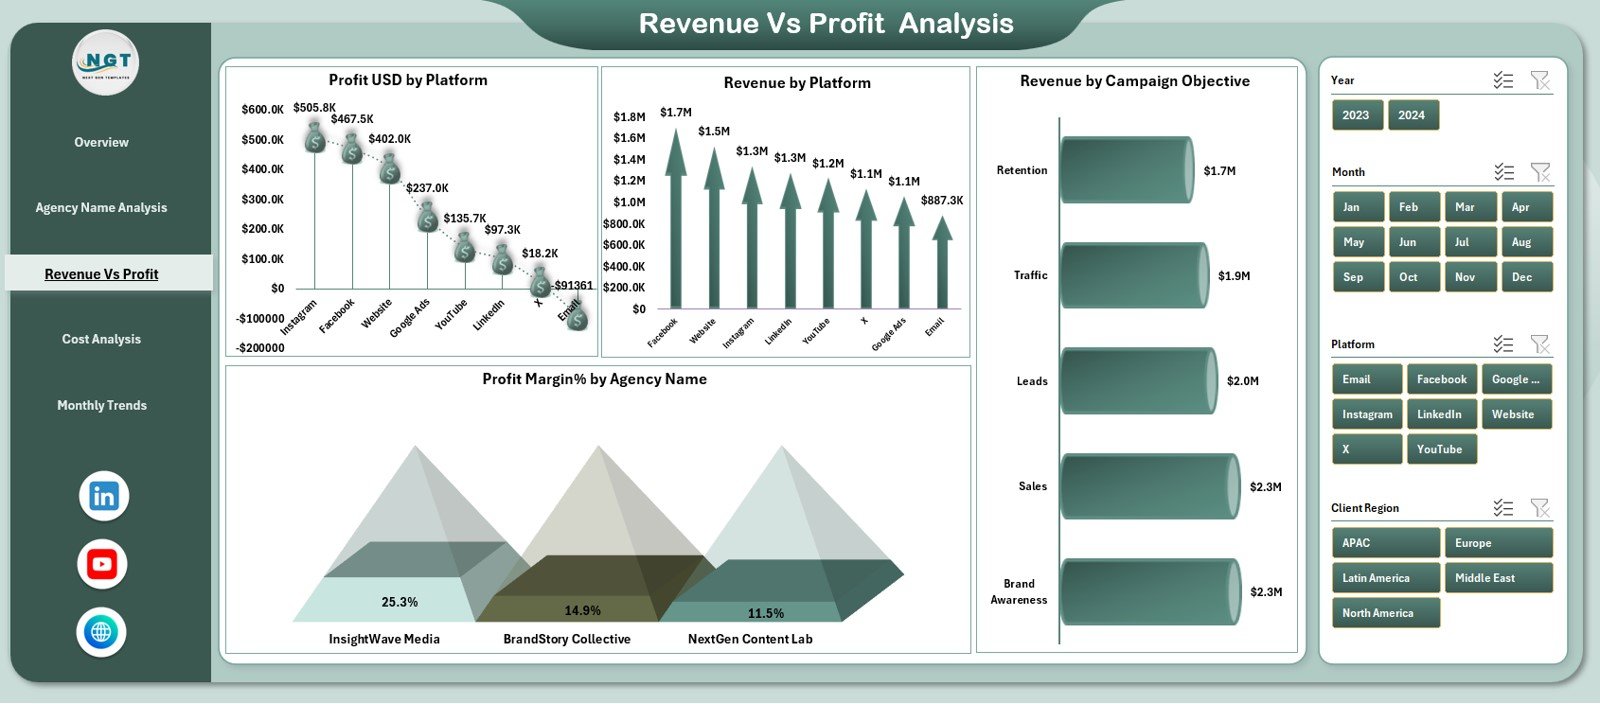
📌 Revenue vs Profit Analysis – Identify top-performing platforms, campaign objectives, and profit centers
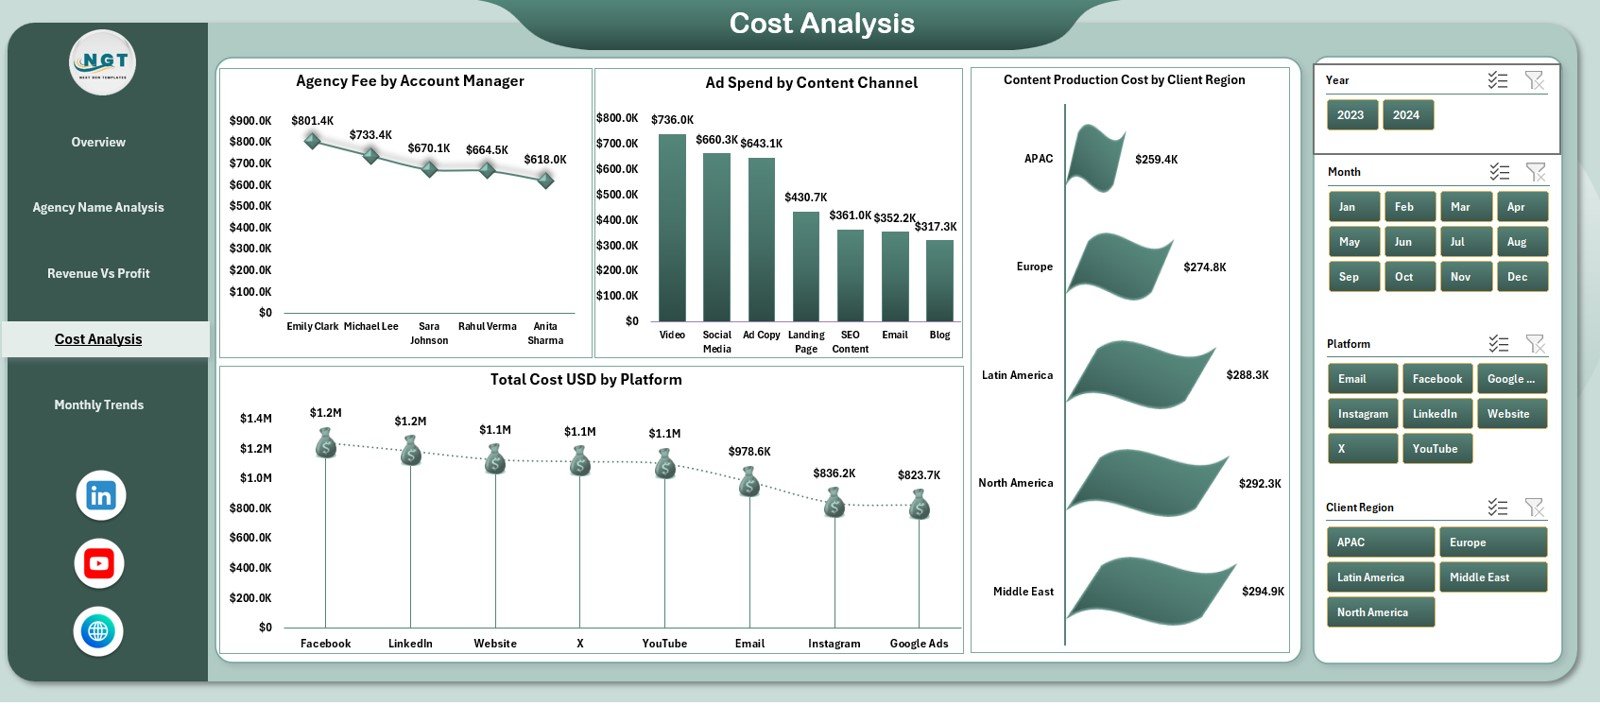
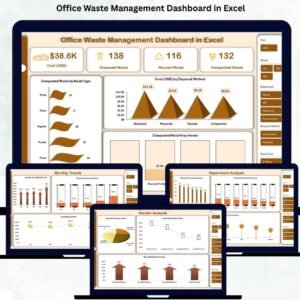
📌 Cost Analysis Page – Track production cost, ad spend, region-wise cost, and manager-wise fee distribution
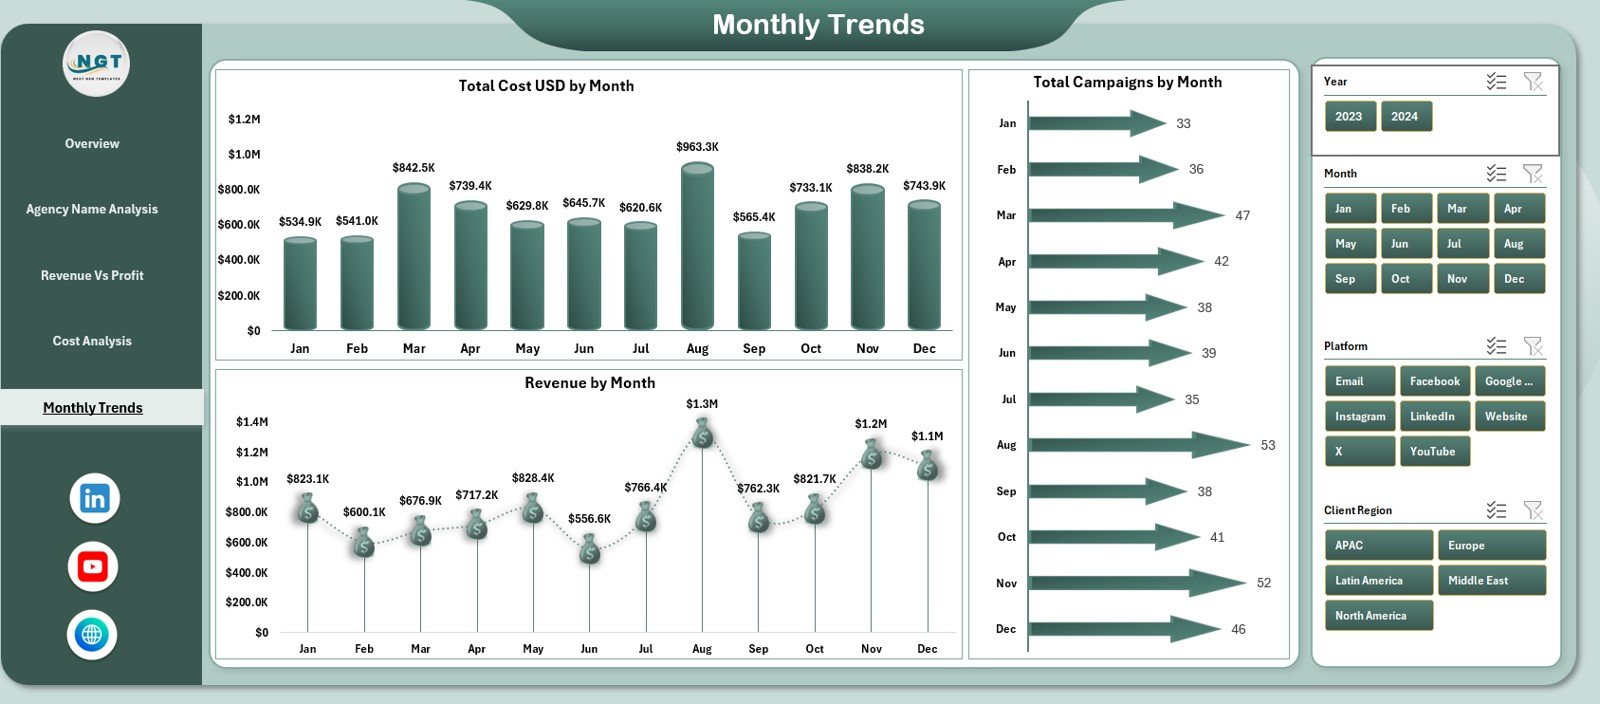
📌 Monthly Trends Page – Understand seasonality, campaign cycles, and revenue movement
📌 Data Sheet (Editable) – Update campaign data anytime
📌 Support Sheet – Auto-calculates KPIs and feeds the dashboard
This structure provides the full analytical power agencies need to improve performance.
How to Use the Content Marketing Agencies Dashboard in Excel
Using the dashboard is extremely simple—even for beginners:
1️⃣ Step 1: Open the Data Sheet
2️⃣ Step 2: Enter or paste your campaign numbers
3️⃣ Step 3: Refresh the pivot tables (or save the file—Excel updates automatically)
4️⃣ Step 4: Review insights using the slicer panel
5️⃣ Step 5: Present clean visuals to clients or internal teams
Everything is designed for speed, clarity, and efficiency. No technical skills required. ⚡
Who Can Benefit from This Dashboard?
This dashboard is perfect for anyone involved in content marketing or agency operations:
🎯 Content Marketing Agencies – Track multiple clients, campaigns, and teams
📈 Digital Marketing Managers – Understand platform-wise performance
💼 Agency Owners – Make faster and more profitable decisions
🧮 Finance & Budget Teams – Control cost and improve ROI
📊 Marketing Analysts – Generate reports instantly
🤝 Account Managers – Track engagement, revenue, and client performance easily
If your agency wants better visibility, faster reporting, and stronger results—this dashboard is exactly what you need.


Reviews
There are no reviews yet.