


Construction Project Cost Dashboard in Excel is a comprehensive, pivot-driven analytics template designed for construction project managers, contractors, cost engineers, and stakeholders who need to monitor project budgets, track actual costs, analyze cost variances, and manage resources efficiently. This Excel dashboard template includes 5 interactive dashboard pages plus a dedicated data sheet and support sheet — all powered by pivot tables and slicers for instant, dynamic filtering.
This template tracks 5 key performance indicators including Total Budget, Total Actual Cost, Total Cost Variance, Total Records, and Budget Utilization %. With interactive slicers and multiple analysis pages, you can quickly drill down into specific phases, cost categories, contractors, regions, project managers, and time periods. Whether you manage residential, commercial, or industrial construction projects, this dashboard gives you the financial clarity you need to control costs and deliver projects on budget.
🔑 Key Features of Construction Project Cost Dashboard in Excel
📊 5 Interactive Dashboard Pages – Overview, Cost Analysis, Project Tracking, Timeline Trend, and Resource Allocation pages deliver a 360-degree view of your construction project cost performance across every dimension.
📈 5 High-Level KPI Cards – Instantly track Total Budget, Total Actual Cost, Total Cost Variance, Total Records, and Budget Utilization % on the Overview page for a quick executive summary of project financial health.
🔍 Dynamic Slicers and Filters – Apply multiple slicers across the dashboard to filter by Phase, Cost Category, Contractor, Region, Project Manager, Status, Priority, and Project Type with a single click for targeted cost analysis.
📉 Budget vs Actual Cost Comparison – Compare planned budgets against actual costs by phase and cost category to detect overruns early and take corrective action before they impact project delivery.
🏗️ Contractor and Regional Analysis – Analyze total actual cost by contractor, cost variance by category, and total budget by region to identify spending patterns and optimize contractor performance.
📅 Timeline Trend Analysis – Track actual cost vs budget by year, labor hours by month and phase, and change orders by month to spot trends and forecast future spending accurately.
👷 Resource Allocation Insights – Monitor labor hours by contractor, budget by project type, and labor hours by project name to optimize workforce deployment and resource utilization.
⚙️ Pivot-Powered Auto-Refresh – The entire dashboard is built on pivot tables stored in the Support sheet. Simply update your data and click Refresh All in Excel to update every chart and KPI instantly.
📦 What’s Inside the Construction Project Cost Dashboard in Excel
This ready-to-use Excel template contains 7 professionally designed worksheets:
📊 Overview Page — Your command center for construction cost monitoring. At the top, 5 KPI cards display Total Budget, Total Actual Cost, Total Cost Variance, Total Records, and Budget Utilization %. Below, interactive charts present Total Budget Vs Total Actual Cost by Phase comparing planned versus actual spending across construction stages, and Total Actual Cost by Cost Category showing how expenses are distributed across material, labor, equipment, and other categories. Multiple slicers let you filter the entire dashboard instantly.
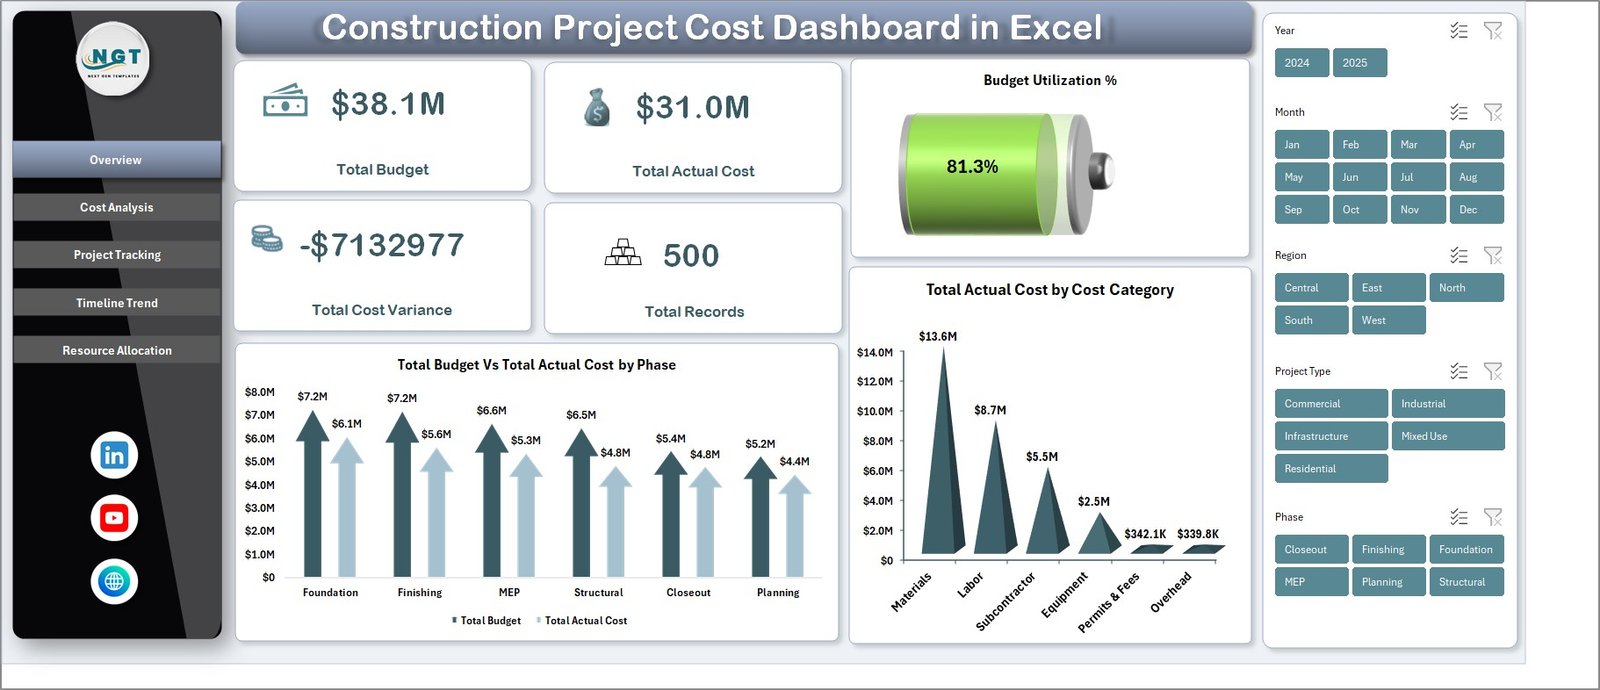 Construction Project Cost Dashboard in Excel
💰 Cost Analysis Page — Dive deep into spending patterns with charts for Total Actual Cost by Contractor revealing which contractors consume the most budget, Total Cost Variance by Cost Category highlighting where overruns or savings occur, and Total Budget by Region comparing geographic spending distribution across your project portfolio.
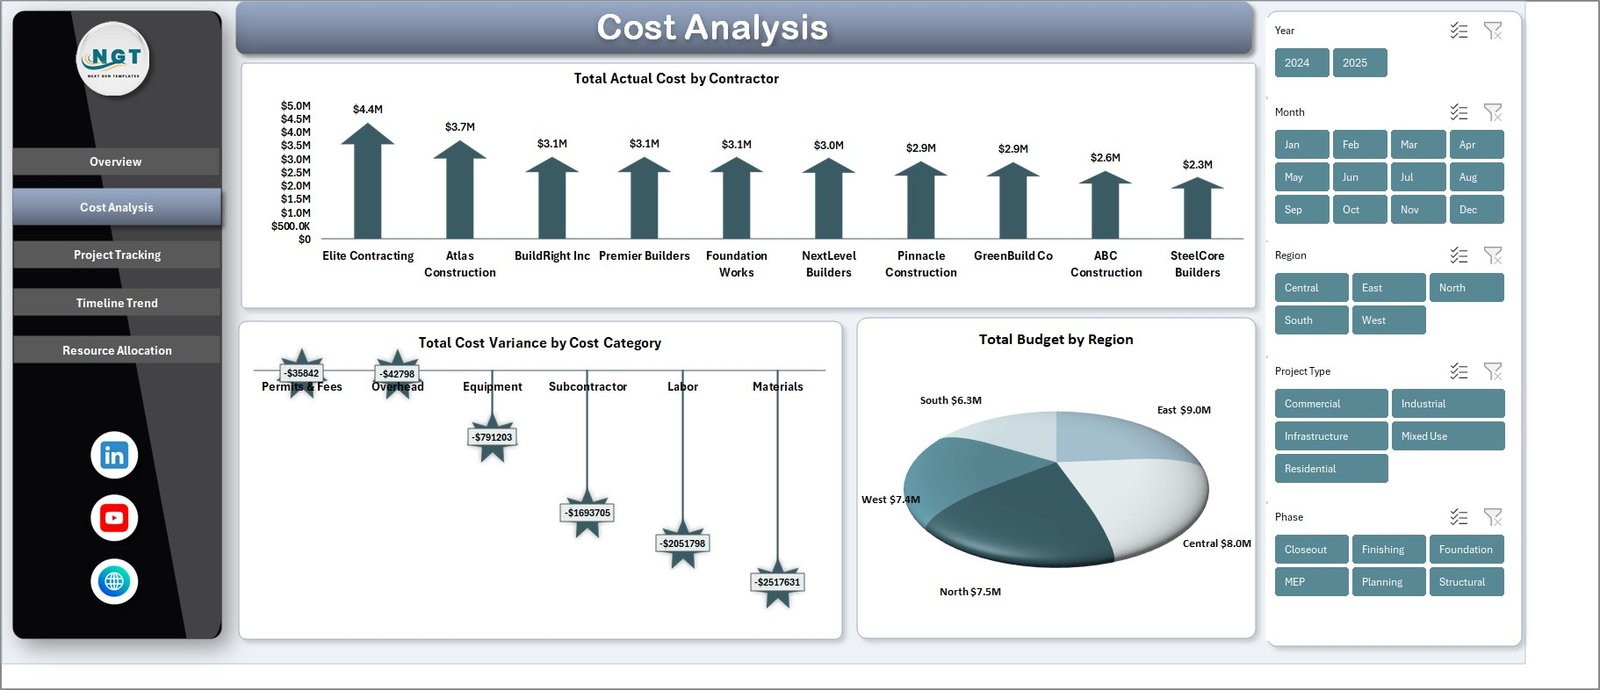 Cost Analysis Page
📋 Project Tracking Page — Monitor project execution with charts for Total Actual Cost by Project Manager tracking individual manager performance, Total Records by Status showing active, completed, and delayed project counts, Total Records by Priority revealing how projects are distributed by urgency level, and Total Completed Vs Total Delayed by Project Type comparing on-time delivery rates across different construction categories.
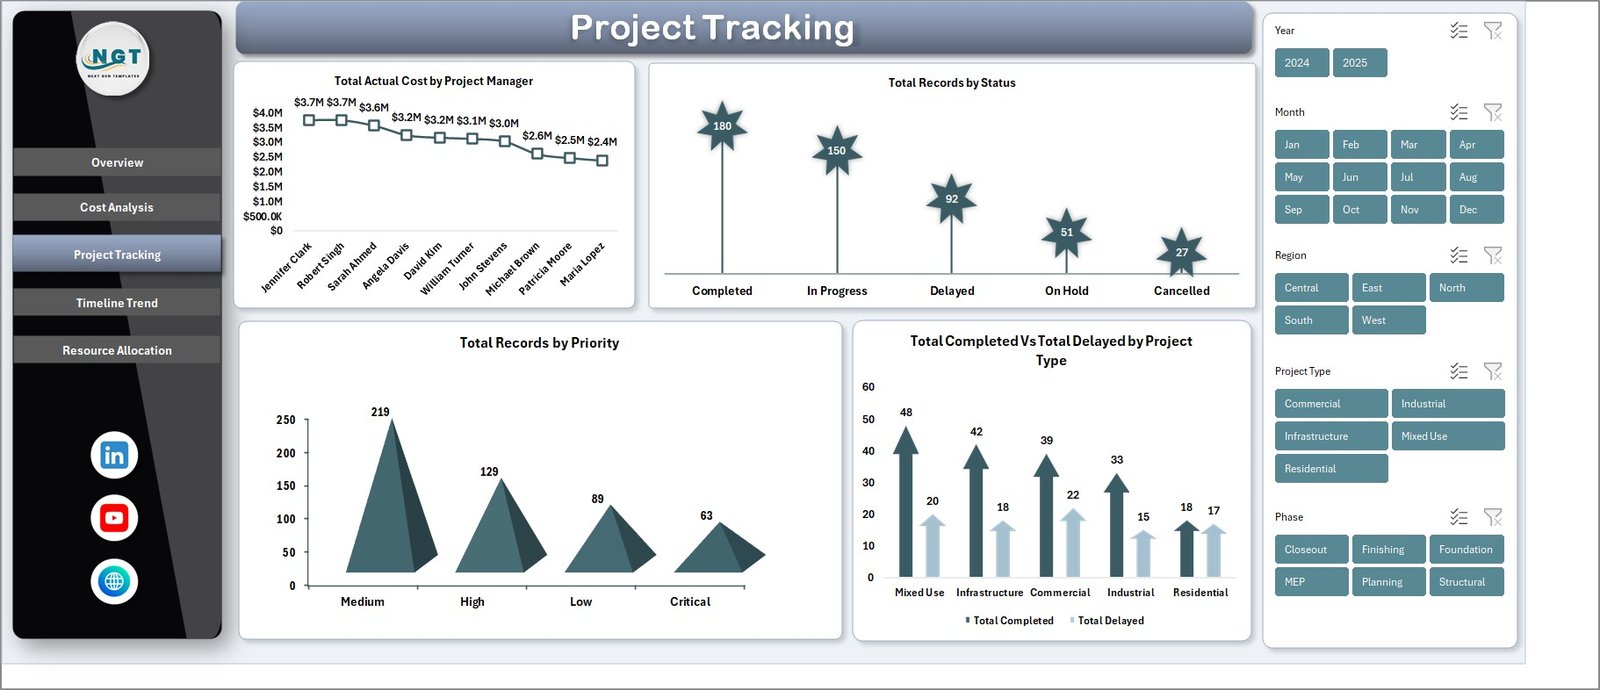 Project Tracking Page
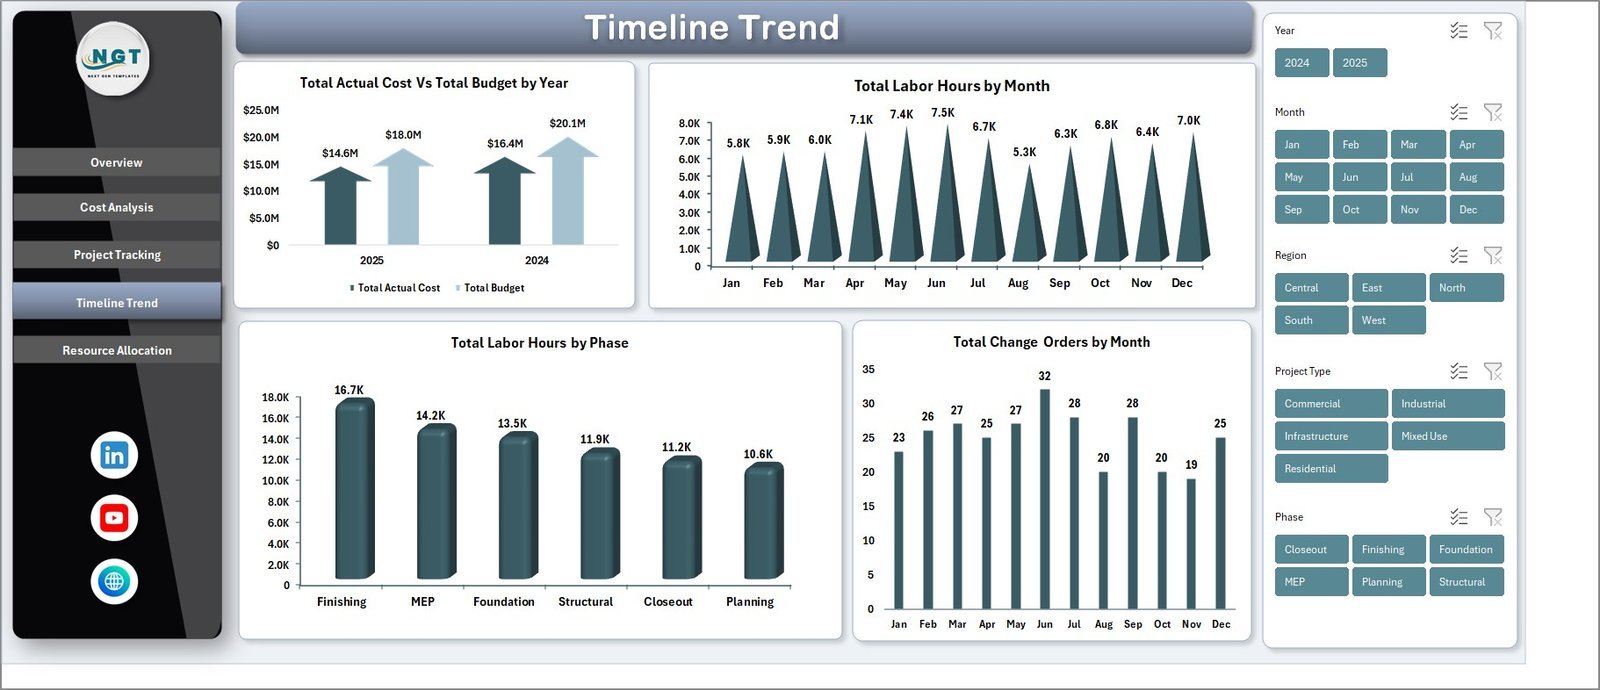
📅 Timeline Trend Page — Track time-based financial and operational patterns with Total Actual Cost Vs Total Budget by Year for year-over-year budget compliance analysis, Total Labor Hours by Month for workforce utilization trends, Total Labor Hours by Phase for understanding labor distribution across construction stages, and Total Change Orders by Month for monitoring scope changes and their frequency over time.
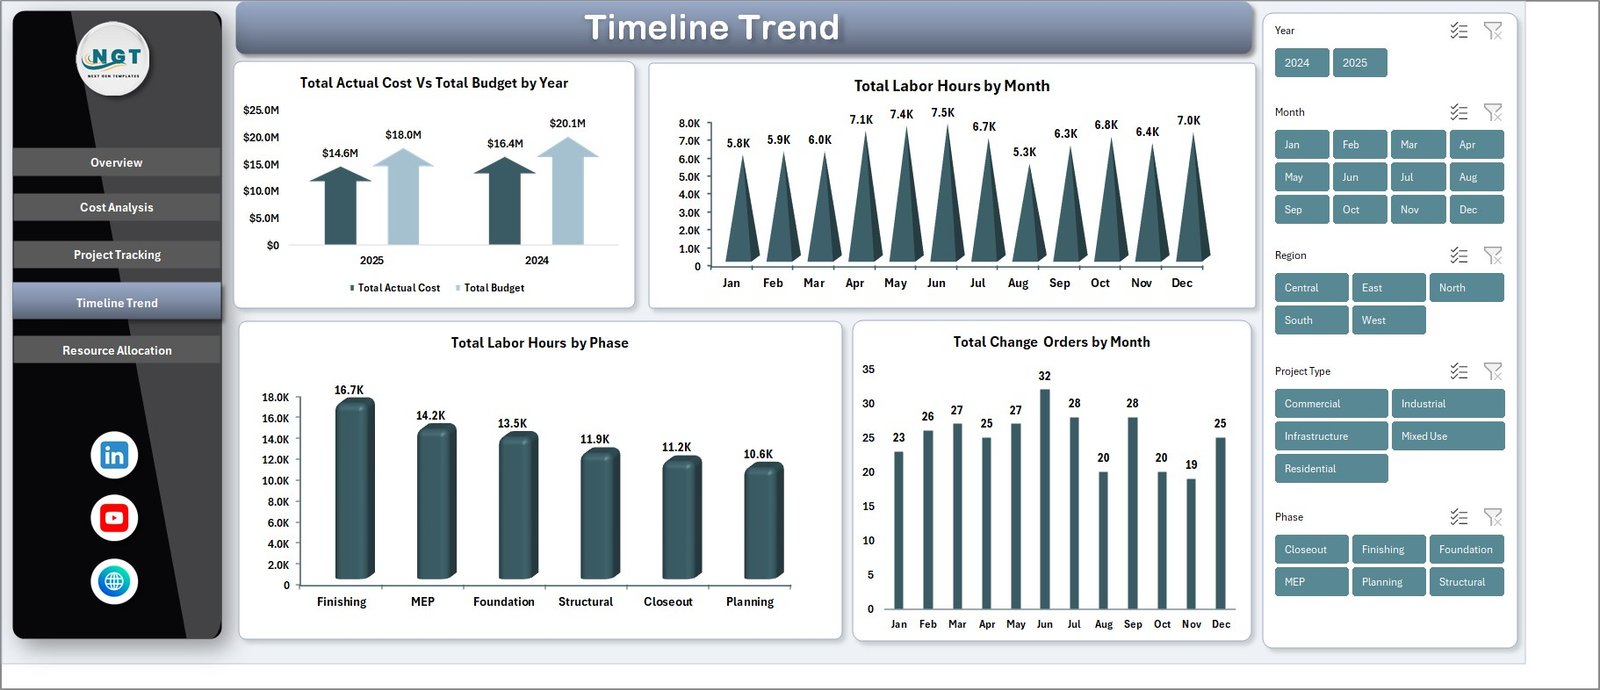 Timeline Trend Page
👷 Resource Allocation Page — Optimize workforce deployment with charts for Total Labor Hours by Contractor comparing labor contributions across contractors, Total Budget by Project Type analyzing budget distribution by construction category, and Total Labor Hours by Project Name identifying which projects consume the most labor resources.
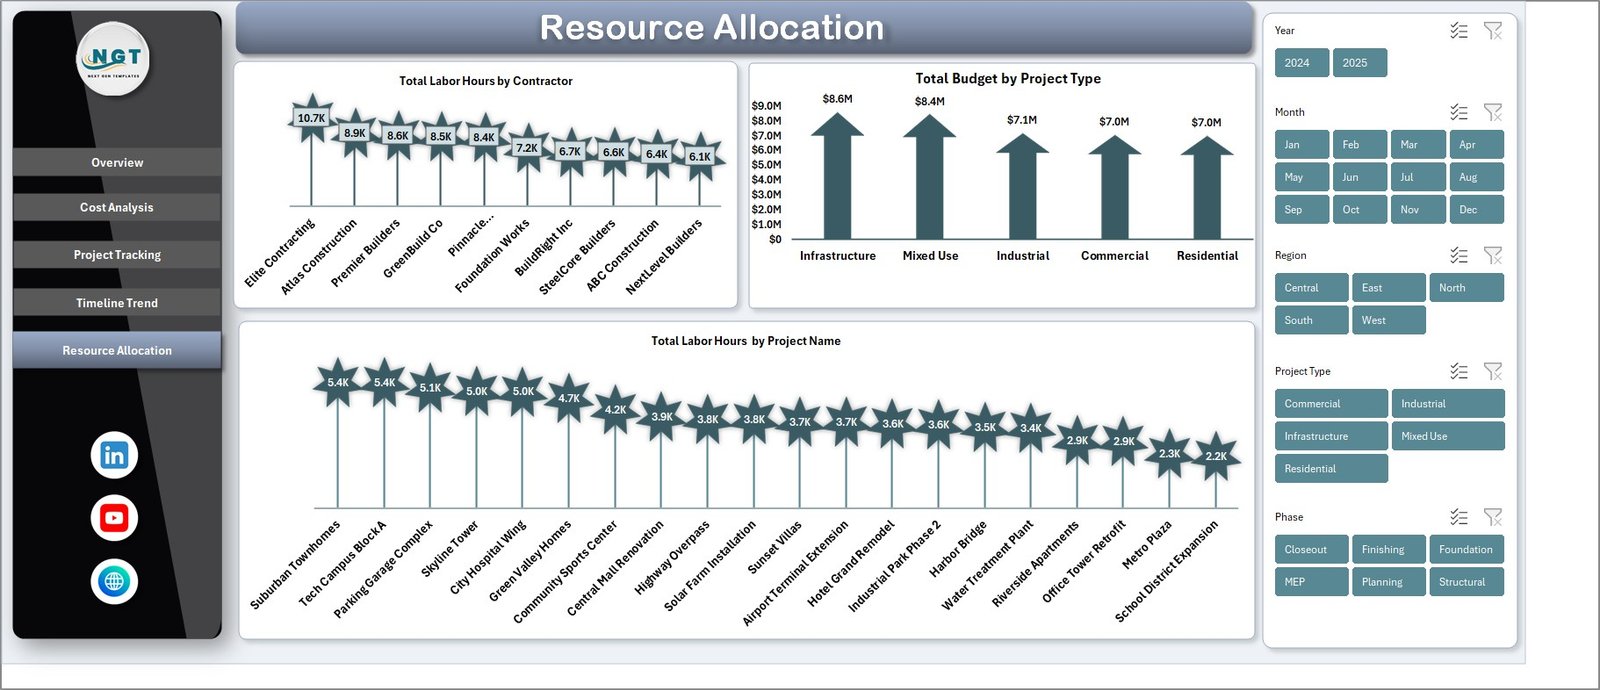 Resource Allocation Page
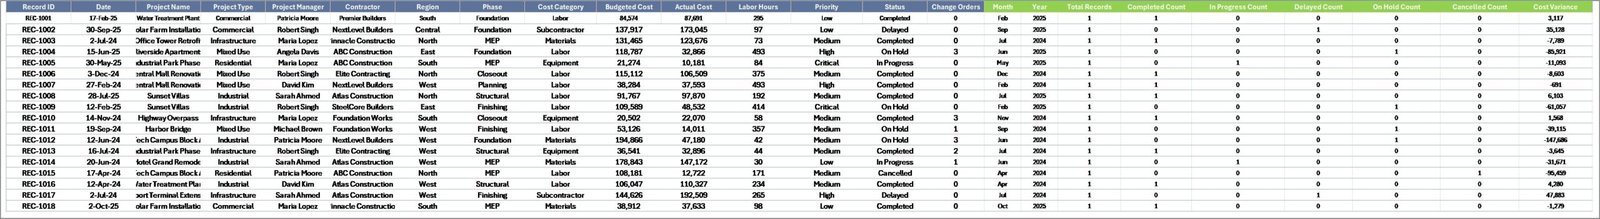
📄 Data Sheet — This is the data entry sheet where all your construction project records are stored. Simply add your project data in the same column format and the dashboard updates automatically after refresh.
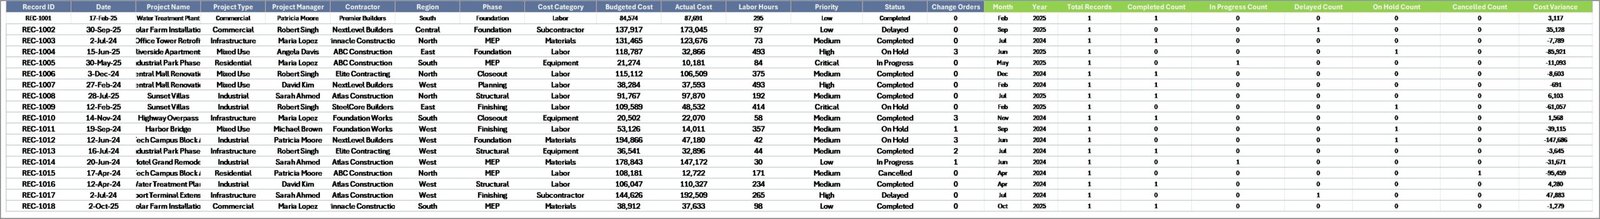 Data Sheet Tab
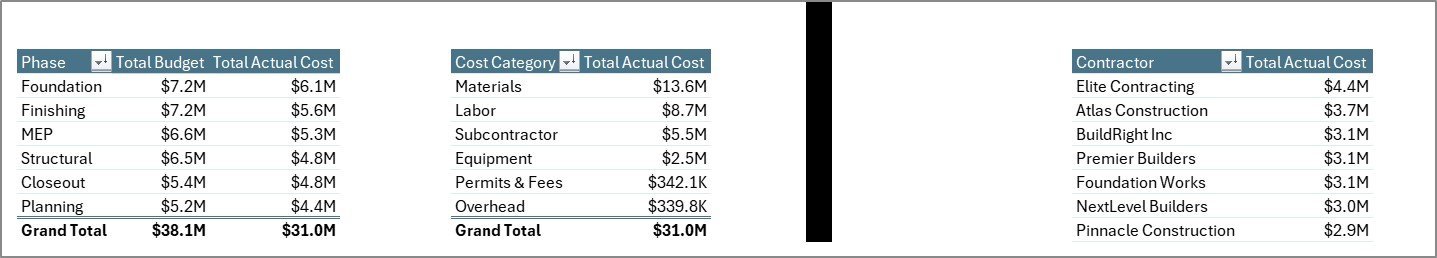
⚙️ Support Sheet — This sheet contains all the pivot tables that power the entire dashboard dynamically. After updating data in the Data sheet, go to the Data tab in the Excel Ribbon and click Refresh All. All pivots and charts will update automatically. You can keep this sheet hidden for a cleaner user experience.
 Support Sheet Tab
⚙️ How to Use the Construction Project Cost Dashboard in Excel
1️⃣ Download and open the Excel file in Microsoft Excel (2016 or later recommended).
2️⃣ Navigate to the Data Sheet and replace the sample data with your own construction project records following the same column format.
3️⃣ Go to the Data tab in the Excel Ribbon and click Refresh All to update all pivot tables and charts.
4️⃣ Use the interactive slicers on each dashboard page to filter by Phase, Cost Category, Contractor, Region, Status, Priority, or Project Type.
5️⃣ Navigate between the 5 dashboard pages to analyze different aspects of your construction project costs.
👥 Who Can Benefit from This Construction Project Cost Dashboard in Excel
🔹 Construction Project Managers – Monitor project budgets, track cost variances, and identify overruns before they escalate
🔹 Cost Engineers and Estimators – Compare actual costs against budgets across phases, categories, and contractors
🔹 General Contractors – Track multiple project costs simultaneously and optimize resource allocation
🔹 Real Estate Developers – Monitor construction budgets for residential and commercial development projects
🔹 Government Infrastructure Agencies – Oversee public construction project spending with clear financial dashboards
🔹 Finance Teams – Analyze budget utilization, cost trends, and change order impacts on project profitability
Also check out our Construction Dashboard in HTML for a browser-based alternative, and the Construction Project Timeline Calendar in Excel for scheduling and milestone tracking.
❓ Frequently Asked Questions
What KPIs does the Construction Project Cost Dashboard in Excel track?
The Construction Project Cost Dashboard in Excel tracks 5 key performance indicators: Total Budget, Total Actual Cost, Total Cost Variance, Total Records, and Budget Utilization %. These KPIs are displayed as interactive cards on the Overview page and are supported by 15+ dynamic charts across 5 dashboard pages.
Do I need advanced Excel skills to use this dashboard?
No. Simply replace the sample data in the Data Sheet with your own construction project records and click Refresh All in the Data tab. All pivot tables, charts, and KPIs update automatically. No formulas or VBA knowledge is needed.
What is the best Excel dashboard for tracking construction project costs?
The Construction Project Cost Dashboard in Excel by NextGenTemplates is one of the best options available. It includes 5 interactive pages covering budget analysis, cost tracking, project status monitoring, timeline trends, and resource allocation — all powered by pivot tables with dynamic slicers.
Can I filter the dashboard by contractor or project phase?
Yes. The dashboard includes multiple interactive slicers that let you filter all charts and KPIs by Phase, Cost Category, Contractor, Region, Project Manager, Status, Priority, and Project Type. Every chart updates instantly when you apply filters.
How does the Support Sheet work?
The Support Sheet contains all the pivot tables that drive the dashboard charts and KPIs. When you update data in the Data Sheet and click Refresh All, these pivots recalculate automatically and all dashboard visuals update. You can keep this sheet hidden for a cleaner view.
🔗 Explore Related Templates
🔹 Construction Dashboard in HTML — Track construction project progress, budgets, safety, and timelines in a browser-based interactive dashboard.
🔹 Construction Project Timeline Calendar in Excel — Plan and track construction project timelines with annual, monthly, and daily calendar views.
🔹 Infrastructure KPI Scorecard in Google Sheets — Monitor infrastructure performance KPIs with automated traffic-light indicators and trend analysis.
📖 Click here to read the Detailed Blog Post
Watch the step-by-step video tutorial:


Reviews
There are no reviews yet.