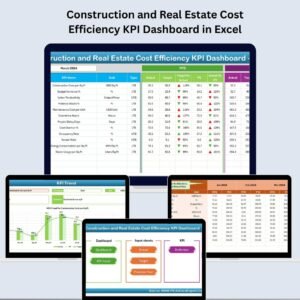
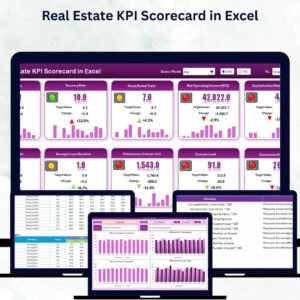
Managing finances in the construction and real estate sector is no small task. Projects span months (or even years), revenue streams vary widely, and market conditions can change overnight. That’s why you need a reliable, data-driven tool to stay ahead of the game — introducing the Construction and Real Estate Revenue Tracking KPI Dashboard in Excel 📊.
This ready-to-use, interactive, and visually stunning Excel template puts you in complete control of your financial performance. From tracking actual vs. target revenue to analyzing KPIs by project type, location, and period, this dashboard provides real-time, actionable insights that help you make smarter business decisions.
Key Features of the Construction and Real Estate Revenue Tracking KPI Dashboard in Excel
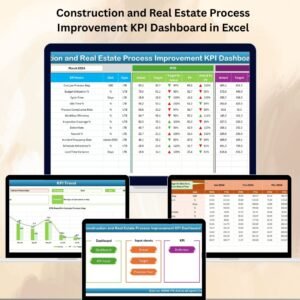
✅ 7 Professionally Designed Sheets – Organized into Home, Dashboard, KPI Trend, Actual Numbers Input, Target, Previous Year, and KPI Definition.
✅ Dynamic Drop-Down Month Selection – Instantly updates all KPIs and charts for the selected month.
✅ Comprehensive KPI Coverage – Includes total revenue, growth rates, per-project metrics, profitability ratios, and more.
✅ MTD & YTD Tracking – Monitor short-term and long-term performance side by side.
✅ Historical Comparisons – Compare current figures with the previous year for better context.
✅ Conditional Formatting – Quickly spot overperforming and underperforming areas with visual cues.
✅ User-Friendly Navigation – Clickable buttons for effortless movement across sheets.
✅ Customizable KPIs – Easily add or edit metrics to suit your business needs.
What’s Inside the Construction and Real Estate Revenue Tracking KPI Dashboard
📌 Home Sheet – Your central control hub with quick navigation buttons.
📌 Dashboard Sheet – The main performance view with KPI cards, charts, and comparison visuals.
📌 KPI Trend Sheet – Detailed trend analysis for both MTD and YTD data.
📌 Actual Numbers Input Sheet – Structured section for entering current performance data.
📌 Target Sheet – Enter monthly targets for each KPI.
📌 Previous Year Numbers Sheet – Store past data for year-over-year growth tracking.
📌 KPI Definition Sheet – Keep a consistent reference of all KPIs, formulas, and definitions.
How to Use the Construction and Real Estate Revenue Tracking KPI Dashboard
1️⃣ Open the Home Sheet – Use navigation buttons to select your desired view.
2️⃣ Set Year & Start Month – Define the period for accurate calculations.
3️⃣ Enter Actual Revenue Data – Fill in both MTD and YTD values.
4️⃣ Update Targets – Align business goals with performance expectations.
5️⃣ Add Previous Year Data – Enable historical performance comparisons.
6️⃣ Review the Dashboard – Analyze KPI cards, trend charts, and conditional formatting.
7️⃣ Deep Dive in KPI Trend – Identify growth opportunities and problem areas.
8️⃣ Take Action – Make strategic decisions based on accurate, visual insights.
Who Can Benefit from This Dashboard?
🏢 Construction Companies – Monitor revenue by project, property type, or region.
🏘️ Real Estate Developers – Track sales, leases, and ongoing project income.
🏦 Property Management Firms – Compare revenue performance across multiple properties.
📈 Financial Analysts – Access ready-to-use visualizations for faster reporting.
👨💼 Business Owners & Executives – Gain a clear, high-level overview of financial performance.
💼 Consultants – Use a structured, professional tool to advise clients effectively.
With this dashboard, you’ll stop wasting hours on manual reporting and start making data-backed decisions that directly impact your bottom line. Its clean design, robust functionality, and real-time updating make it an essential asset for anyone in the construction and real estate industry.


Reviews
There are no reviews yet.