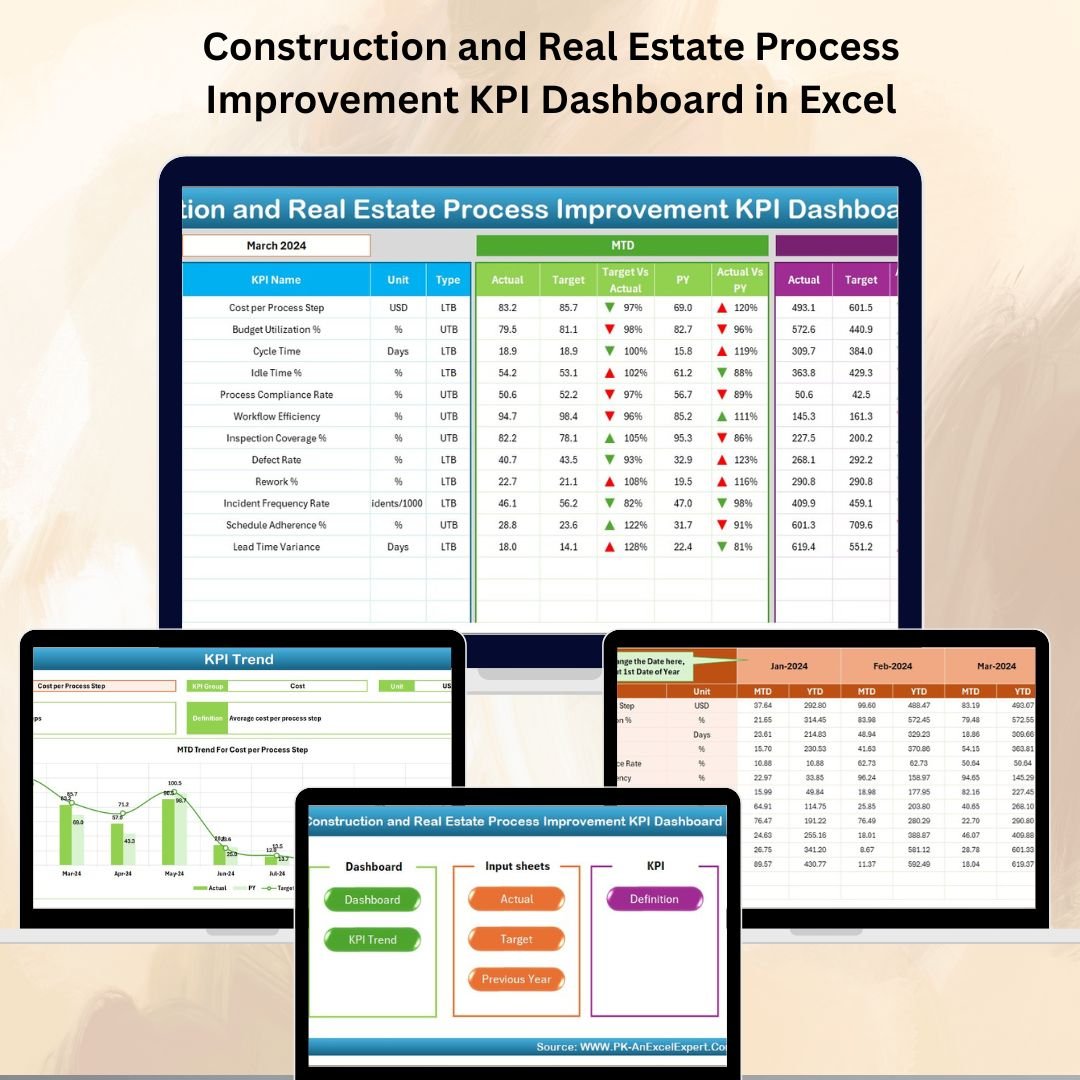
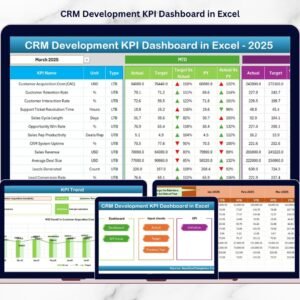
🏗️ Construction and Real Estate Process Improvement KPI Dashboard in Excel
In the fast-paced world of construction and real estate, time, cost, and quality are everything. Every delay, cost overrun, or missed deadline can have a huge impact on profitability and client satisfaction. That’s why tracking your performance using the right metrics is no longer optional—it’s essential.
The Construction and Real Estate Process Improvement KPI Dashboard in Excel is your all-in-one tool to monitor, measure, and improve operational efficiency. With its interactive design, easy navigation, and visual KPIs, it empowers decision-makers to act quickly, reduce risks, and increase profits.
Whether you are a project manager, contractor, developer, or engineer, this dashboard turns raw data into clear insights so you can spot problems early and take corrective action.
✨ Key Features of the Construction and Real Estate Process Improvement KPI Dashboard
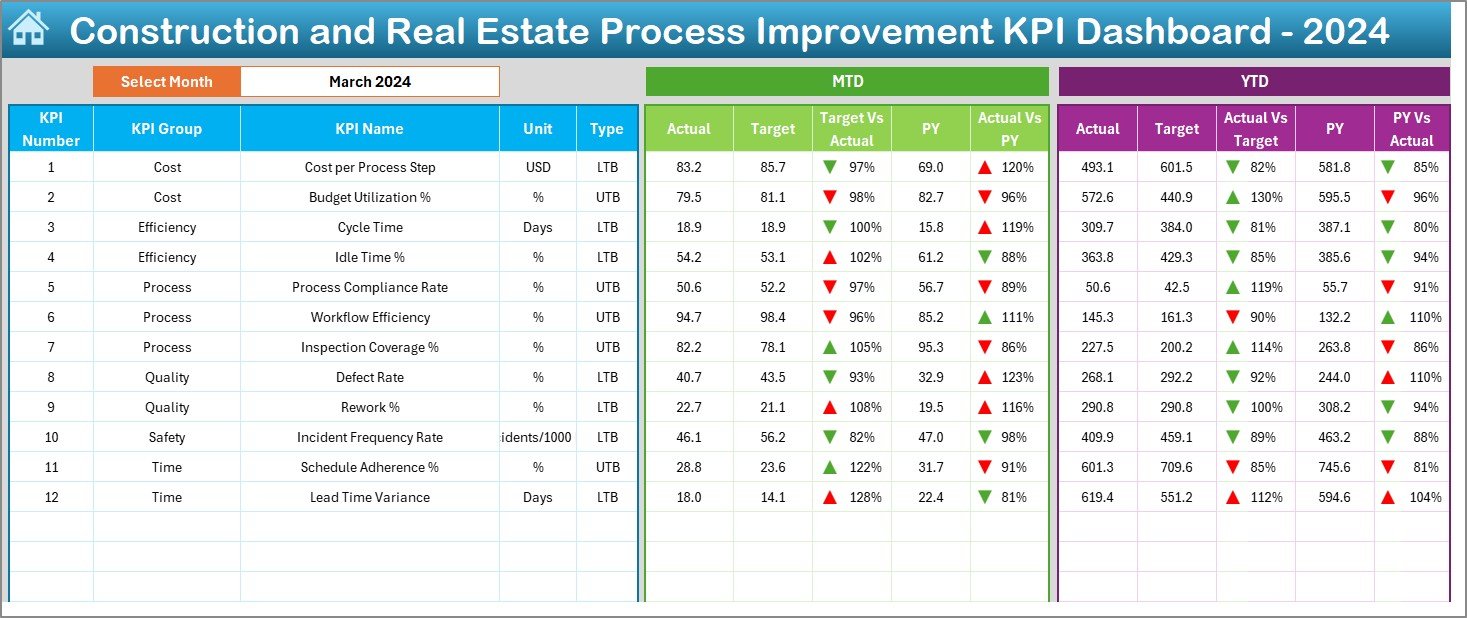
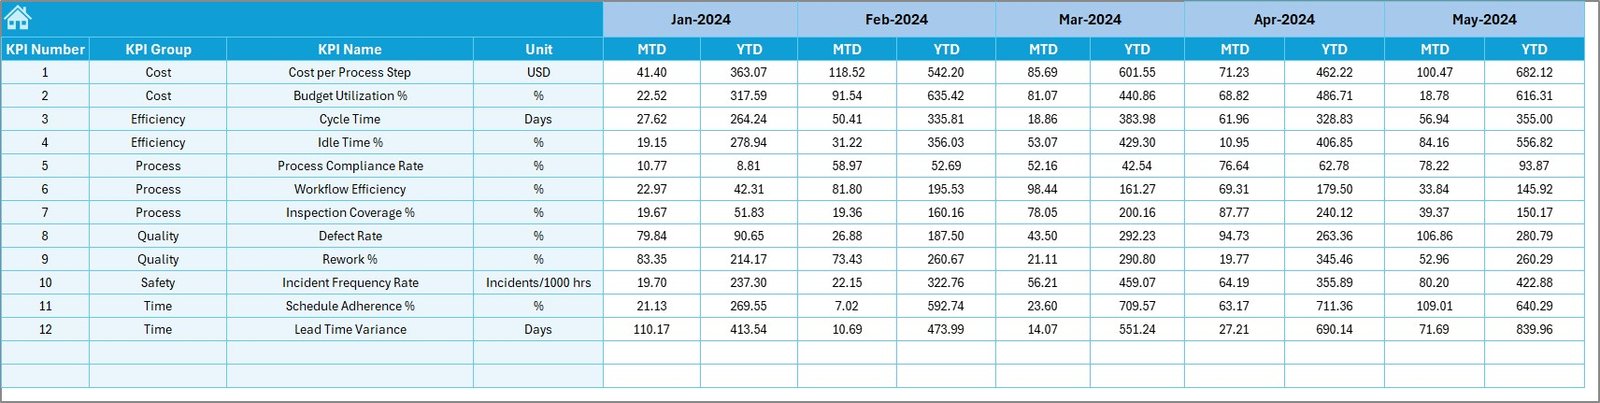
✅ All-in-One Performance View – Track MTD (Month-to-Date) and YTD (Year-to-Date) performance alongside targets and previous year data.
✅ Interactive Month Selector – Change the month in one click to update the entire dashboard instantly.
✅ Visual Indicators – Conditional formatting arrows highlight improvements or declines.
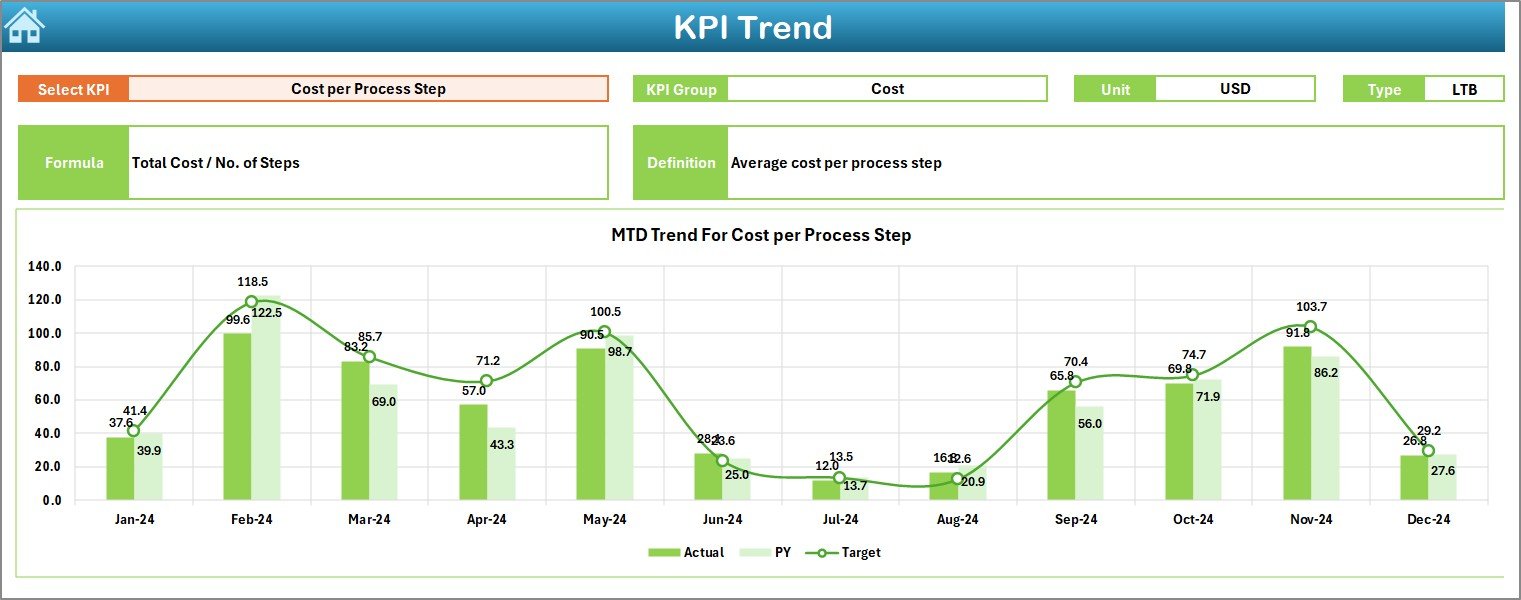
✅ KPI Trend Tracking – See Actual vs Target vs Previous Year trends to spot long-term patterns.
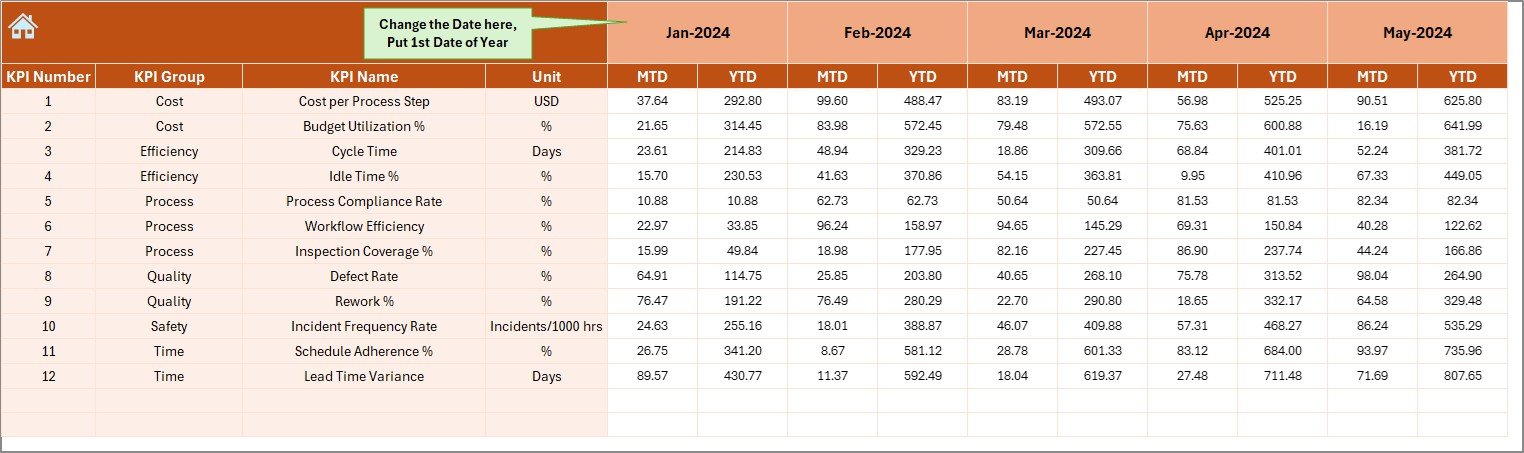
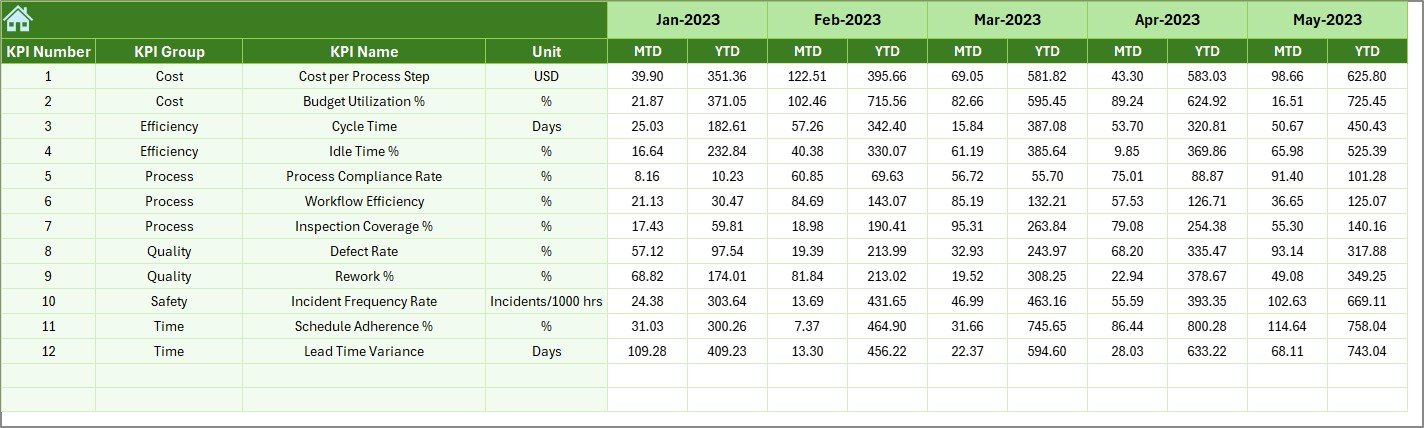
✅ Historical Data Storage – Previous Year sheet for accurate year-over-year comparisons.
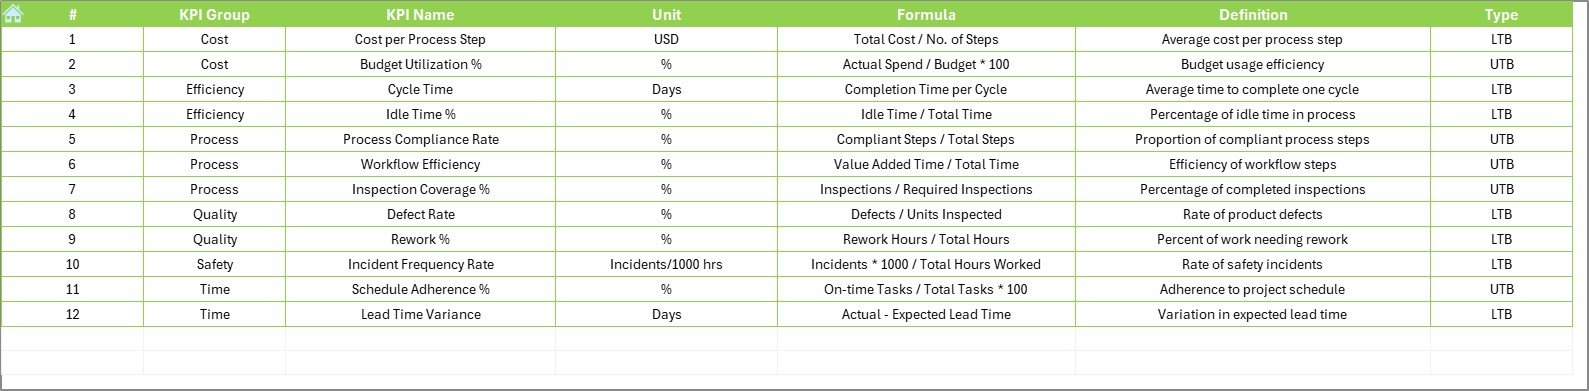
✅ Clear KPI Definitions – Dedicated sheet explaining each KPI’s meaning, formula, and measurement unit.
✅ Quick Navigation – Home sheet buttons let you jump to any section instantly.
✅ Customizable Layout – Add or remove KPIs to fit your business needs.
📂 What’s Inside the Construction and Real Estate Process Improvement KPI Dashboard
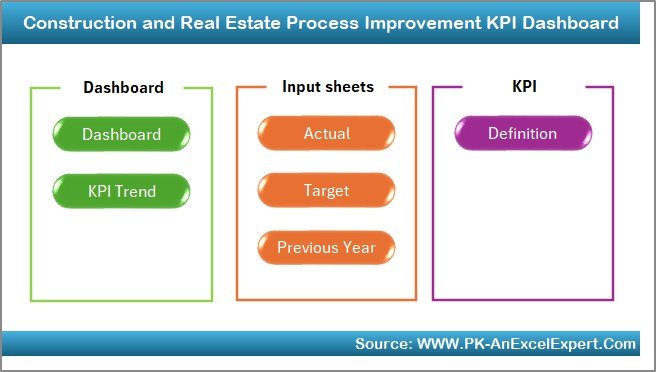
When you download this product, you’ll get seven structured worksheet tabs designed for efficiency:
-
Home Sheet – Your main control panel with quick navigation buttons.
-
Dashboard Sheet – Displays all KPIs in a clean, visual layout with dynamic month selection.
-
KPI Trend Sheet – Select any KPI to view its group, type (LTB/UTB), formula, and trend charts.
-
Actual Numbers Input Sheet – Enter MTD and YTD performance values for accurate reporting.
-
Target Sheet – Set monthly and yearly targets for every KPI.
-
Previous Year Number Sheet – Store past year’s data for comparison and seasonal analysis.
-
KPI Definition Sheet – Maintain a clear reference for all KPIs.
🛠 How to Use the Construction and Real Estate Process Improvement KPI Dashboard
-
Open the Home Sheet – Use navigation buttons to access the desired section.
-
Select the Month – Choose your reporting month in Cell D3 for real-time updates.
-
Input Actual Numbers – Enter data in the Actual Numbers Input Sheet.
-
Set or Adjust Targets – Use the Target Sheet to define your goals.
-
Review KPI Trends – Use the KPI Trend Sheet for deeper analysis.
-
Compare with Last Year – Check the Previous Year sheet for benchmarking.
🎯 Who Can Benefit from This KPI Dashboard
🏗 Construction Companies – Monitor project progress, budget variance, and on-time delivery.
🏢 Real Estate Developers – Track sales timelines, resource utilization, and customer satisfaction.
📊 Project Managers – Get quick insights for faster decision-making.
⚙ Operations Teams – Identify inefficiencies and reduce delays.
💼 Executives & Stakeholders – Access high-level performance metrics in seconds.
🚀 Why This Dashboard is a Must-Have
-
Make Informed Decisions – See exactly where you’re meeting or missing targets.
-
Save Time – Replace manual reports with a ready-to-use Excel dashboard.
-
Boost Efficiency – Spot performance bottlenecks early.
-
Improve Profitability – Control costs, reduce waste, and improve resource allocation.
📖 Click here to read the Detailed blog post
Visit our YouTube channel to learn step-by-step video tutorials


Reviews
There are no reviews yet.