


In a world where regulations are becoming stricter by the day, maintaining compliance isn’t optional — it’s essential. The Compliance Report in Excel is a powerful, ready-to-use reporting tool designed to help organizations track, analyze, and manage compliance performance across departments, locations, and functions.
Whether you work in finance, healthcare, IT, or manufacturing, this Excel-based solution simplifies compliance management — eliminating manual errors, reducing audit stress, and offering complete visibility into your compliance health.
Built entirely in Microsoft Excel, it uses structured data, pivot tables, and interactive charts to display key insights like Compliant %, Pending Reviews, and Total Checks. It’s the perfect blend of simplicity, automation, and professional reporting.
⚙️ Key Features of the Compliance Report in Excel
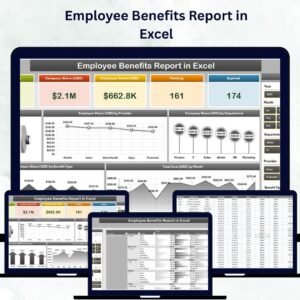
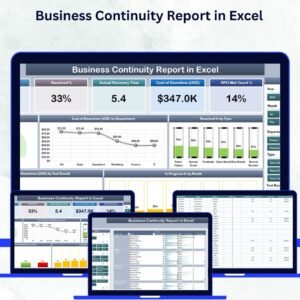
🏠 1️⃣ Summary Page – The Big Picture

The Summary Page serves as your control center for compliance monitoring.
-
📊 Top 5 KPI Cards: Instantly view Total Checks, Compliant %, Pending Reviews, and other vital metrics.
-
🎚️ Right-Side Slicer: Filter by Department, Location, or Compliance Area to narrow insights.
-
📈 Visual Charts Include:
-
Compliant % by Department
-
Pending Review % by Location
-
Total Checks by Month
-
Total Checks by Compliance Area
-
Overall Performance Trend
-
💡 Perfect for management reviews and compliance audits — one glance tells the whole story.
📋 2️⃣ Report Page – Detailed Analysis for Every Check
Dive deeper into compliance data with a detailed, filterable report view.
-
🧩 Left-Side Slicer: Filter by time, compliance area, or department.
-
🧾 Information Table: Includes Check ID, Compliance Area, Reviewer, Review Date, and Status.
-
🔍 Drill-Down Capability: Analyze specific cases or high-risk areas in real time.
📊 Ideal for compliance officers and auditors who need complete traceability and detailed records.
🧮 3️⃣ Data Sheet – The Core Engine
The Data Sheet is where your compliance data lives. It’s structured, organized, and pivot-friendly for effortless analysis.
-
Contains Compliance ID, Department, Area, Status, Reviewer, and Comments.
-
Ready for bulk data imports or manual updates.
-
Refresh all pivot tables in one click to see real-time updates.
✅ No complex setup — just enter data and start analyzing.
🧾 4️⃣ Support Sheet – Smart Automation and Data Validation
Maintain consistency with predefined dropdown lists for:
-
Department names
-
Compliance areas
-
Status categories (Compliant, Pending, Non-Compliant)
🔐 Prevents data entry errors and keeps your reports accurate.
🚀 Advantages of Using the Compliance Report in Excel
✅ Real-Time Insights: Track organization-wide compliance instantly.
✅ Improved Accuracy: Automated calculations reduce manual errors.
✅ Centralized Data: All compliance metrics in one secure Excel file.
✅ Easy Customization: Modify KPIs, charts, or slicers effortlessly.
✅ Audit-Ready Visualization: Share performance summaries in meetings or board reviews.
✅ Cost-Effective Solution: No need for expensive compliance software — Excel does it all.
🧭 Who Can Benefit from This Report?
-
👨💼 Compliance Managers: Monitor adherence to regulations.
-
🧾 Auditors: Track internal and external compliance checks.
-
💻 IT Teams: Ensure cybersecurity and data privacy compliance.
-
🧍♂️ HR Departments: Track policy training completion and ethics standards.
-
🏭 Operations Teams: Manage safety, quality, and environmental compliance.
💼 Suitable for organizations of all sizes and industries.
💡 How to Use the Compliance Report in Excel
1️⃣ Enter compliance records in the Data Sheet following the predefined structure.
2️⃣ Click Data → Refresh All to update charts and KPIs instantly.
3️⃣ Use slicers to filter by department, region, or compliance area.
4️⃣ Review the Summary Page for a quick compliance overview.
5️⃣ Explore the Report Page for in-depth case-level insights.
6️⃣ Present visual findings during audits or management meetings.
📈 In just minutes, you’ll have a clean, professional compliance report — no coding or special tools required.
🧠 Best Practices for Effective Reporting
-
🗓️ Update data regularly for accurate visuals.
-
📋 Use dropdowns to avoid inconsistent entries.
-
⚙️ Automate refreshes for weekly or monthly reports.
-
🎯 Focus on key KPIs like Compliant % and Pending Reviews.
-
🔐 Protect sheets containing sensitive data.
✨ Following these steps ensures accurate, audit-ready reports every time.
🔗 Click here to read the Detailed Blog Post
📺 Visit our YouTube Channel for Step-by-Step Tutorials
👉 YouTube.com/@PKAnExcelExpert


Reviews
There are no reviews yet.