Community development programs aim to create meaningful change—improving livelihoods, strengthening social systems, and delivering long-term impact. Community Development KPI Dashboard in Excel However, tracking progress across multiple initiatives, locations, and stakeholders often becomes difficult when data is spread across reports, registers, and disconnected spreadsheets. As a result, teams struggle to measure performance, compare results, and communicate impact clearly.
Community Development KPI Dashboard in Excel That is exactly why the Community Development KPI Dashboard in Excel becomes an essential management and reporting solution 📊✨.
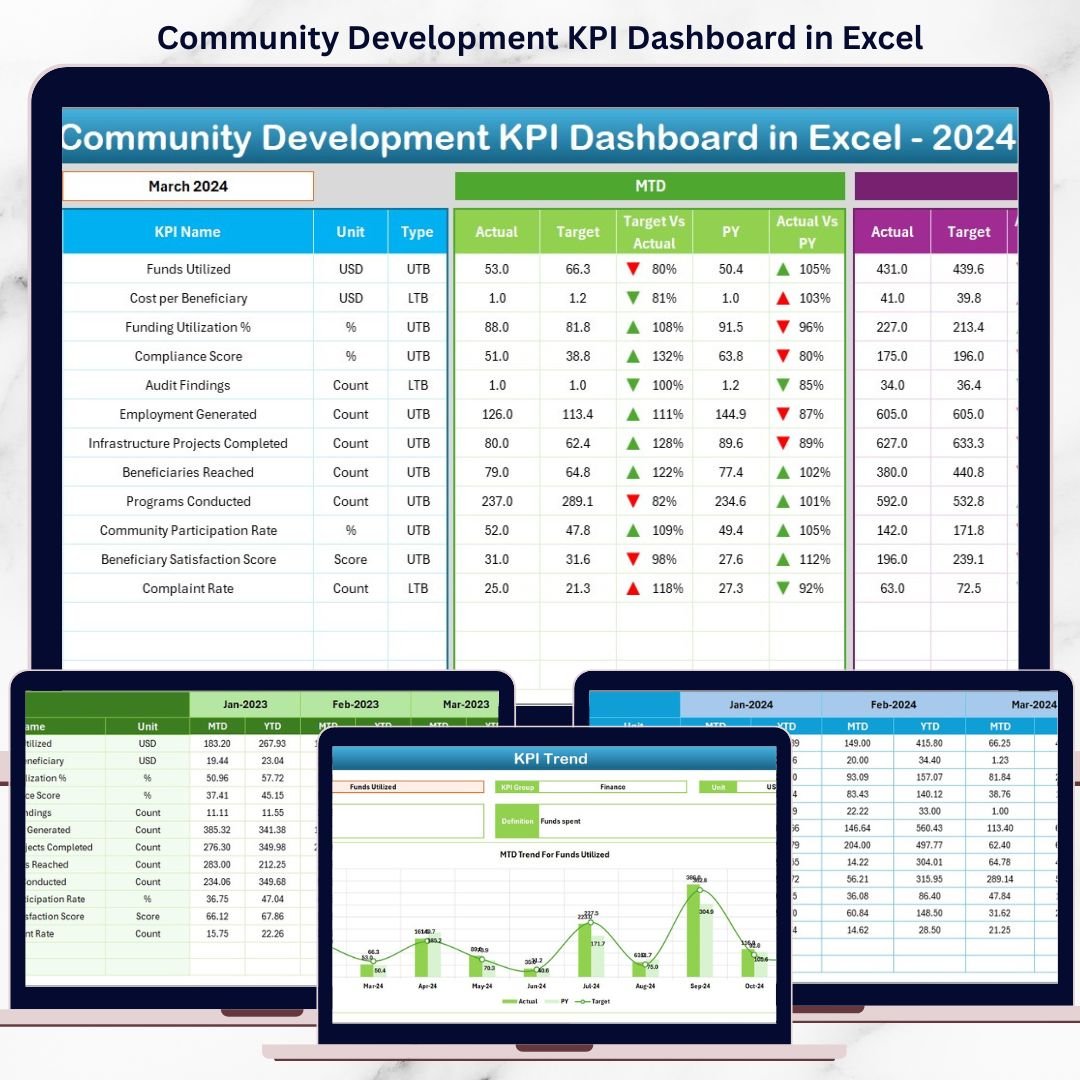
This ready-to-use Excel dashboard transforms raw community development data into clear, structured, and actionable insights. Instead of spending hours compiling reports, teams can instantly track Month-to-Date (MTD) and Year-to-Date (YTD) performance from one centralized dashboard. Because the dashboard is built entirely in Excel, it remains easy to use, flexible, and accessible—even for non-technical users.
Designed for NGOs, government bodies, CSR teams, and social organizations, this dashboard shifts performance tracking from manual reporting to proactive impact management.
⭐ Key Features of Community Development KPI Dashboard in Excel
📊 Centralized Impact Tracking
Monitor all community development KPIs in one structured dashboard.
📅 MTD & YTD Performance Analysis
Track short-term progress and long-term outcomes simultaneously.
🎯 Target vs Actual Comparison
Quickly identify gaps and achievements using automated calculations.
📈 Year-over-Year Performance Review
Compare current results with previous year data to measure improvement.
🧭 Simple Navigation
A dedicated home sheet with buttons ensures smooth movement across worksheets.
📉 Visual Trend Analysis
Charts help identify improvement patterns and early warning signs.
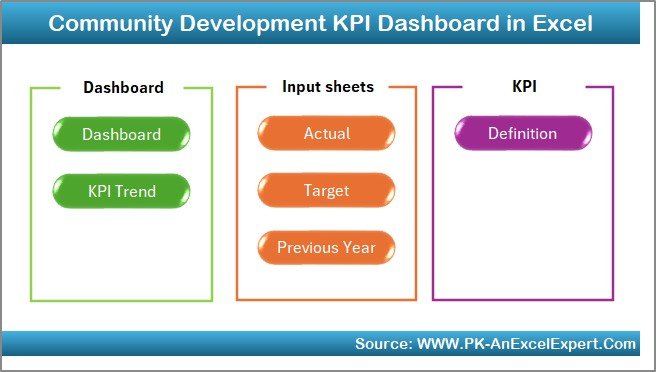
📂 What’s Inside the Community Development KPI Dashboard in Excel
This professionally designed Excel workbook includes seven well-structured worksheets, each serving a specific purpose:
🏠 Home Sheet
Acts as the dashboard’s navigation hub with buttons to access all major sections quickly.
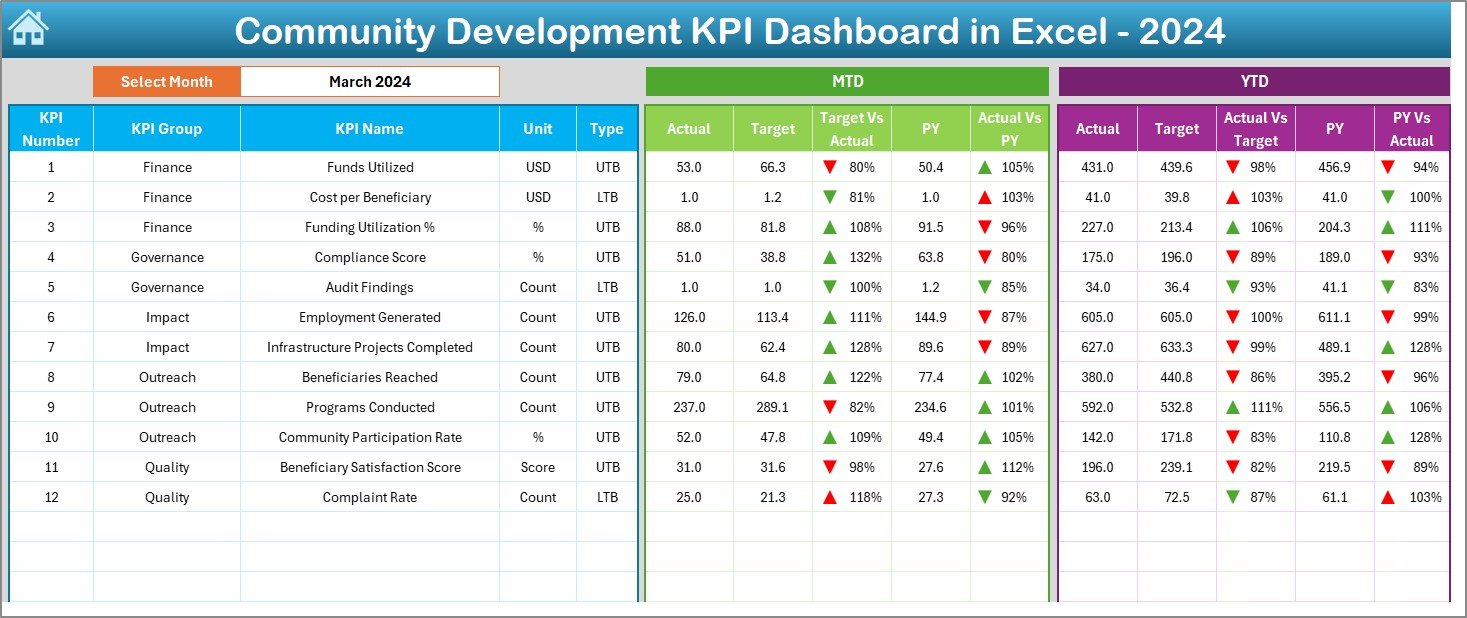
📊 Dashboard Sheet
The main analysis page showing:
-
Month selection drop-down
-
Clear MTD and YTD sections
-
Actual, Target, and Previous Year comparisons
-
Conditional formatting with arrows to highlight performance status
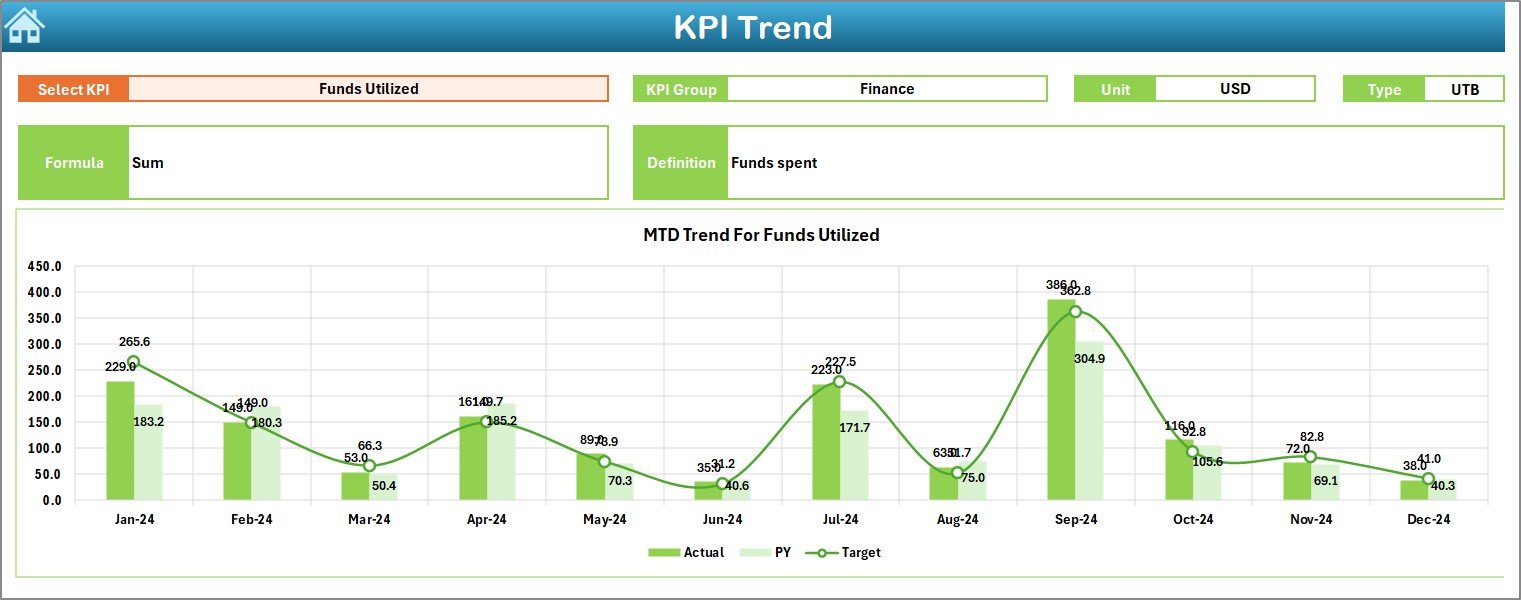
📈 KPI Trend Sheet
Supports deep KPI analysis with:
-
KPI selection drop-down
-
KPI group, unit, type (LTB/UTB), formula, and definition
-
MTD and YTD trend charts comparing Actual, Target, and PY values
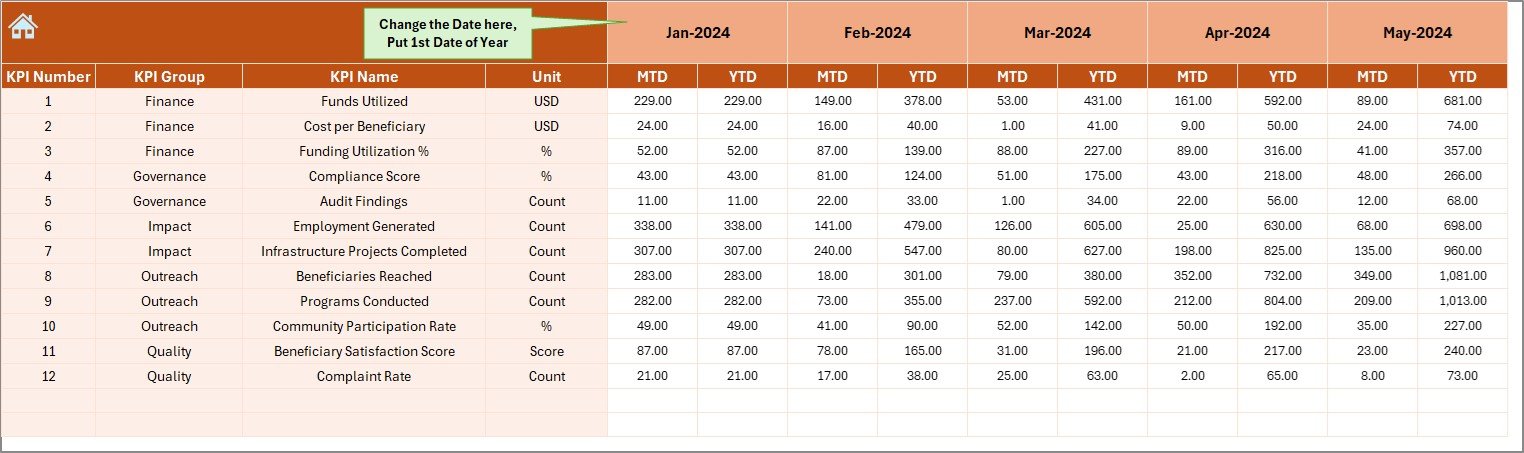
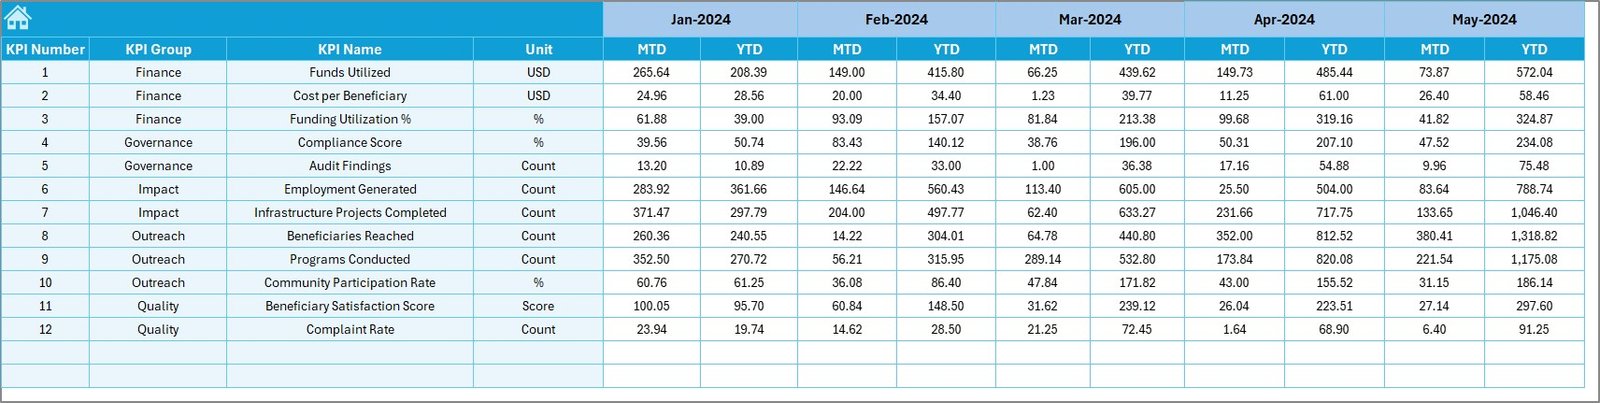
📝 Actual Numbers Input Sheet
Where users enter real MTD and YTD performance data.
🎯 Target Sheet
Stores planned MTD and YTD targets aligned with program goals.
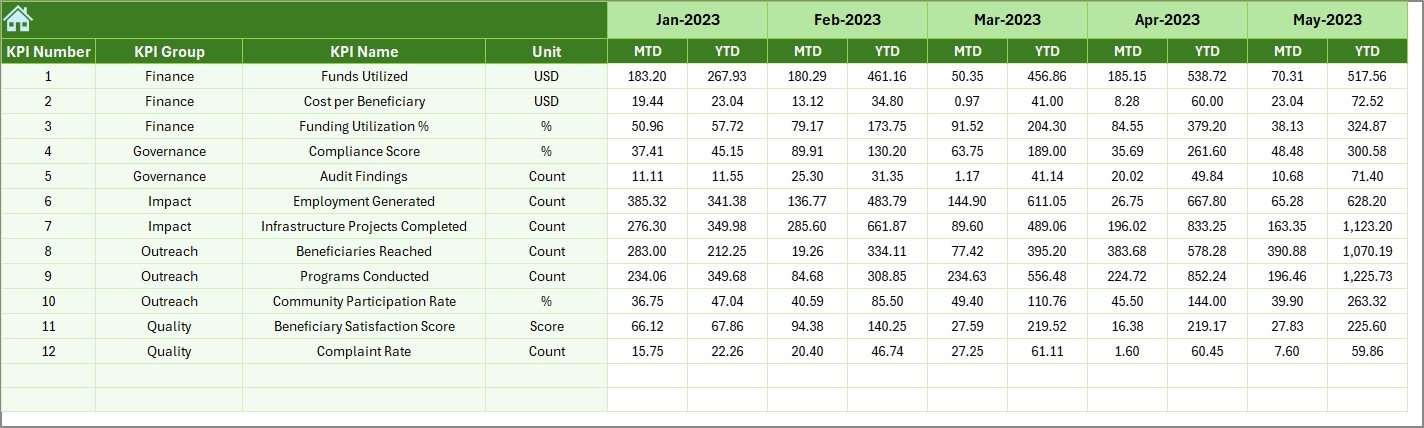
📅 Previous Year Number Sheet
Captures historical data to support year-over-year comparison.
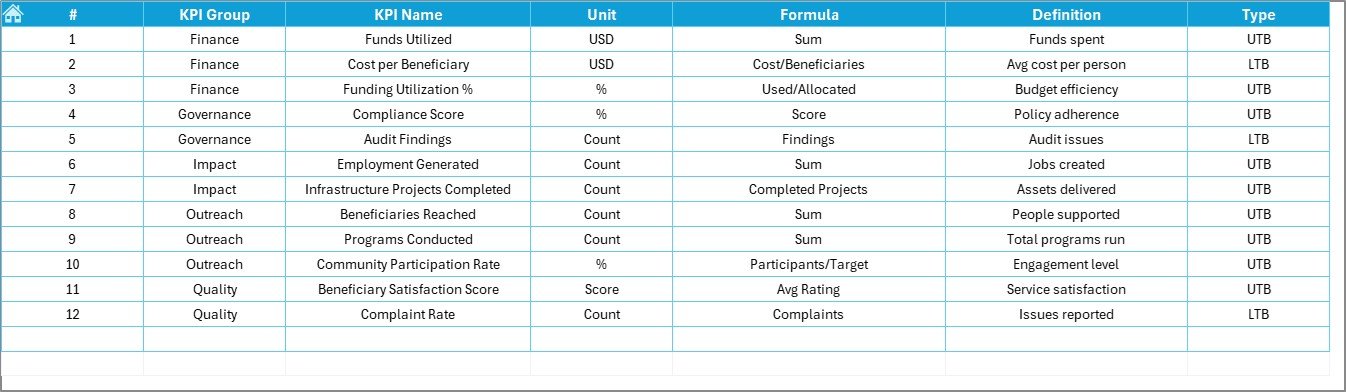
📘 KPI Definition Sheet
Documents KPI names, groups, units, formulas, and definitions to ensure clarity and consistency.
🛠️ How to Use the Community Development KPI Dashboard in Excel
Using this dashboard is simple and efficient:
1️⃣ Enter actual performance data in the Actual Numbers sheet
2️⃣ Define monthly and yearly targets in the Target sheet
3️⃣ Add previous year values for comparison
4️⃣ Select the reporting month
5️⃣ Instantly view updated KPIs, trends, and insights
Because calculations and visuals update automatically, teams save time and reduce reporting errors.
👥 Who Can Benefit from This Community Development KPI Dashboard in Excel
This dashboard is ideal for:
🌱 NGOs and Non-Profit Organizations
🏛️ Government & Municipal Departments
🏢 CSR & Sustainability Teams
📋 Community Project Managers
📊 Development Consultants & Researchers
Whether managing a small local initiative or a large multi-region program, this dashboard adapts to your needs.


Reviews
There are no reviews yet.