Running a coaching or tutoring business today is not just about delivering great lessons 📚. You must also track enrollments, manage fees, monitor attendance, evaluate assessment scores, and review trainer performance regularly. However, when this data stays scattered across spreadsheets and manual reports, decision-making becomes slow and unclear.
That is exactly where the Coaching & Tutoring Dashboard in Excel becomes a smart and powerful business solution 🚀.
This ready-to-use Excel dashboard converts raw academic and operational data into clear, visual insights. Instead of spending hours creating reports, you instantly understand what is happening in your coaching or tutoring center. From student enrollment to city-wise revenue, from trainer performance to monthly trends—everything appears in one professional dashboard.
Because this dashboard is built entirely in Microsoft Excel, it remains familiar, flexible, and cost-effective. You do not need advanced Excel skills, macros, or external tools. With Pivot Tables, Pivot Charts, slicers, and structured data sheets, the dashboard delivers business-grade analytics with simplicity.
Whether you manage a single coaching center or multiple cities, this dashboard helps you grow faster, stay organized, and make data-driven decisions with confidence.
🔑 Key Features of Coaching & Tutoring Dashboard in Excel
📊 All-in-One Academic & Business View
🎯 Enrollment, Fees, Attendance & Assessment Tracking
📍 City-Wise & Subject-Wise Performance Analysis
🧑🏫 Trainer-Level Performance Insights
📈 Monthly Trends & Growth Analysis
🖱️ Interactive Slicers for Instant Filtering
🧭 Page Navigator for Easy Dashboard Navigation
⚙️ Pivot-Based, Fully Customizable Structure
📂 What’s Inside the Coaching & Tutoring Dashboard in Excel
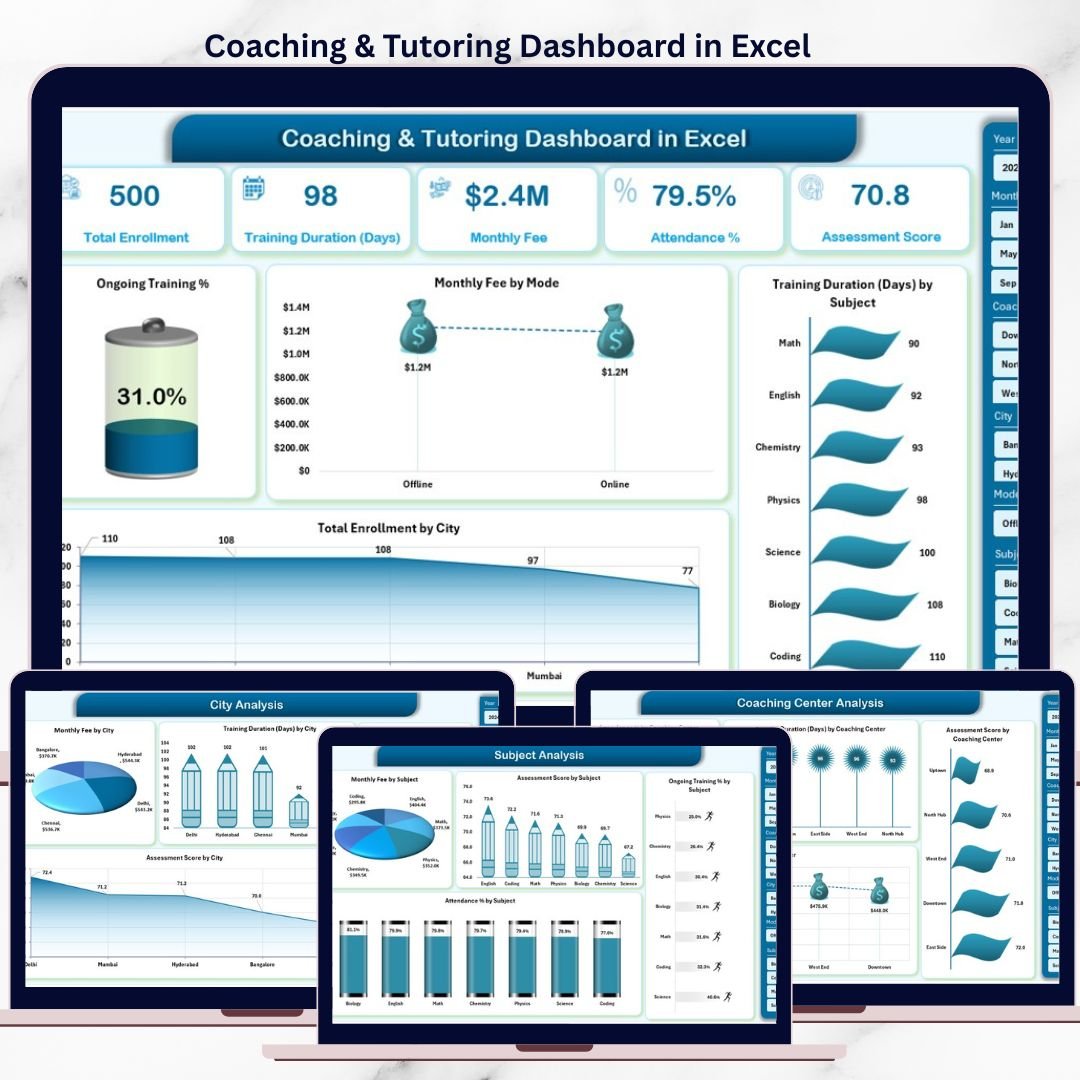
📊 Overview Page – Business Snapshot

Coaching & Tutoring Dashboard
The Overview Page acts as the control panel of your coaching business.
What you see instantly:
-
Right-side slicer for quick filtering
-
KPI cards showing:
-
Total Enrollment
-
Monthly Fee
-
Ongoing Training %
-
Average Training Duration
-
Key charts included:
-
📈 Ongoing Training %
-
💰 Monthly Fee by Mode (Online vs Offline)
-
⏱️ Training Duration by Subject
-
🌍 Total Enrollment by City
This page gives management a quick and clear overview of overall performance.
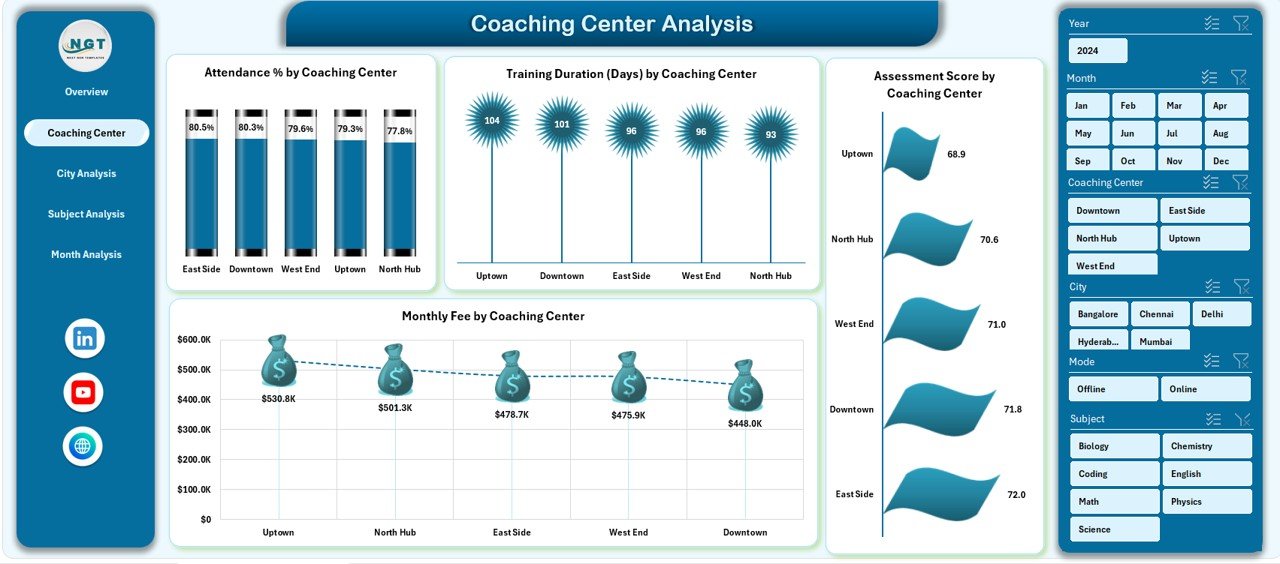
🏙️ Coaching Center Analysis – City-Wise Comparison
This page focuses on location-level insights.
Charts included:
-
Monthly Fee by City
-
Training Duration by City
-
Ongoing Training % by City
-
Assessment Score by City
With these visuals, owners identify top-performing cities and improvement areas instantly.
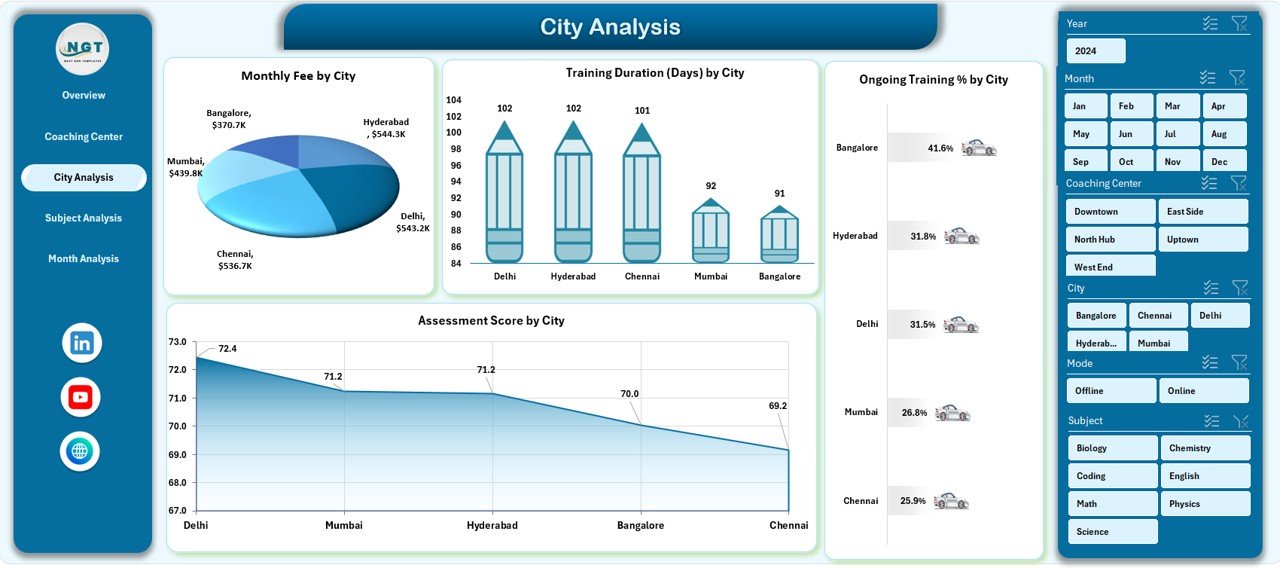
📚 City Analysis – Course Category Performance
The City Analysis Page evaluates how different course categories perform.
Insights you gain:
-
Ongoing Training % by Course Category
-
Attendance % by Course Category
-
Training Duration Days by Course Category
-
Assessment Score by Course Category
This analysis helps academic heads optimize curriculum and course offerings.
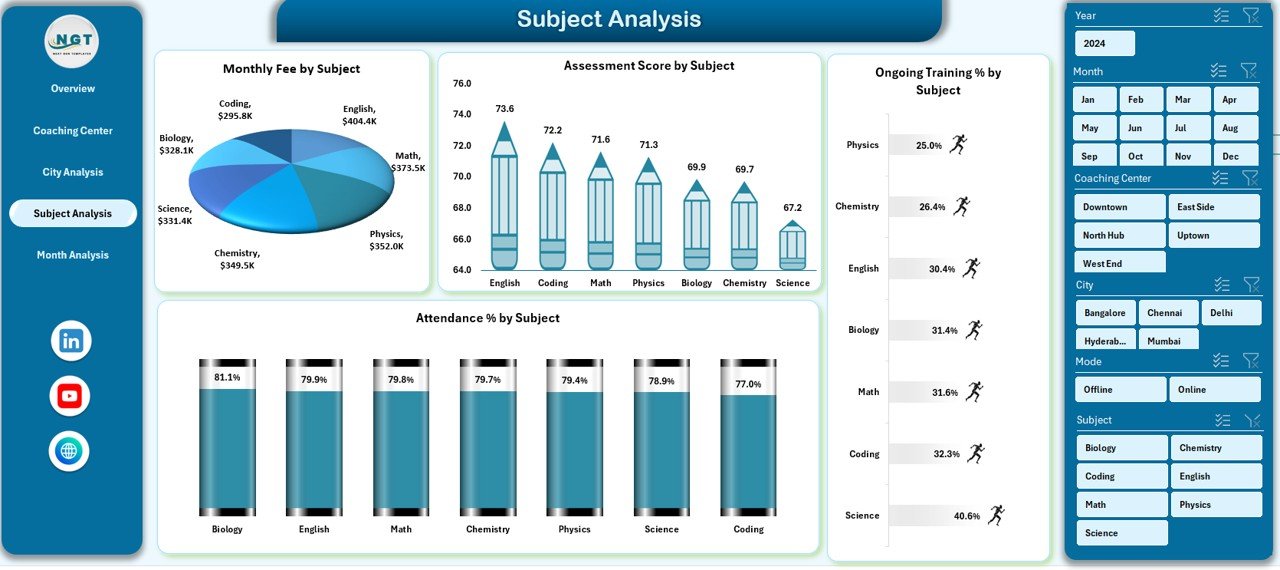
🧑🏫 Subject Analysis – Trainer Performance Review
Trainer quality directly impacts student success.
This page shows:
-
Monthly Fee by Trainer Name
-
Training Duration Days by Trainer Name
-
Completed Training % by Trainer Name
-
Assessment Score by Trainer Name
As a result, management can recognize top trainers and support improvement where needed.
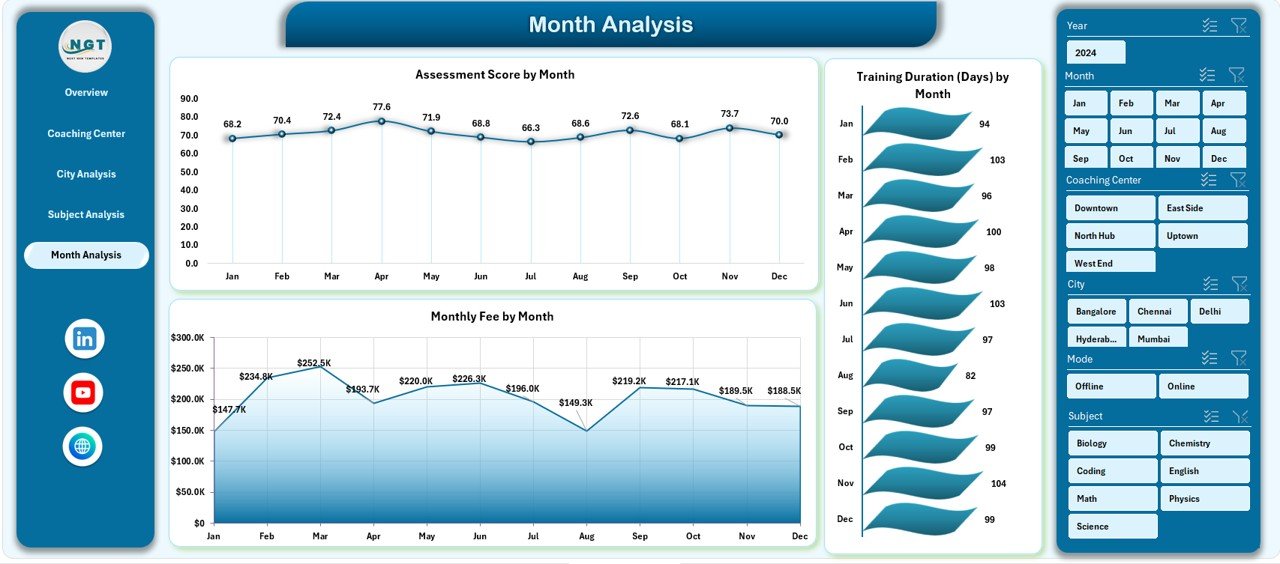
📅 Month Analysis – Trend & Growth Tracking
The Month Analysis Page reveals time-based patterns.
Charts included:
-
Monthly Fee by Subject
-
Training Duration by Month
-
Monthly Fee by Month
With these insights, coaching centers forecast demand, plan batches, and manage revenue cycles effectively.
⚙️ How to Use the Coaching & Tutoring Dashboard in Excel
1️⃣ Enter data in the structured Data Sheet
2️⃣ Refresh Pivot Tables
3️⃣ Use slicers to filter by city, subject, or month
4️⃣ Review KPIs and charts
5️⃣ Identify trends and gaps
6️⃣ Take informed academic and business decisions
Simple, fast, and reliable.
🎯 Who Can Benefit from This Dashboard?
🏫 Coaching Institutes
📘 Tutoring Centers
🎓 Training Academies
🧑💼 Education Entrepreneurs
🌐 Online & Offline Learning Providers
### 👉 Click here to read the Detailed blog post
▶️ Visit our YouTube channel to learn step-by-step video tutorials
https://youtube.com/@PKAnExcelExpert


Reviews
There are no reviews yet.