Managing a clinic is no longer just about patient care. Today’s clinics must track revenue, costs, doctors’ performance, patient behavior, lab services, and pharmacy income—all at the same time. However, when this data sits in scattered Excel sheets or manual reports, decision-making becomes slow and risky. That is exactly why the Clinics Dashboard in Excel is a game-changing solution for modern clinics.
The Clinics Dashboard in Excel is a ready-to-use, professionally designed analytical tool that converts raw clinic data into powerful visual insights using pivot tables and pivot charts. Instead of spending hours preparing reports, clinic owners and managers can instantly monitor financial health, patient trends, doctor efficiency, and monthly performance—all from one centralized dashboard.
Built entirely in Microsoft Excel, this dashboard is cost-effective, flexible, and extremely easy to use. At the same time, it delivers enterprise-level insights without the need for expensive healthcare software.
## 🔹 Key Features of Clinics Dashboard in Excel
📊 All-in-One Performance View
Track revenue, costs, profit, patient trends, doctor performance, and monthly patterns from a single dashboard.
💰 Financial Performance Monitoring
Analyze total revenue, total cost, profit, profit percentage, lab fees, and pharmacy income with clear visuals.
👨⚕️ Doctor Performance Analysis
Identify top-performing doctors using appointment counts, consultation duration, pharmacy contribution, and profit metrics.
👥 Patient Behavior Insights
Understand patient trends by age group, gender, diagnosis category, and booking channel.
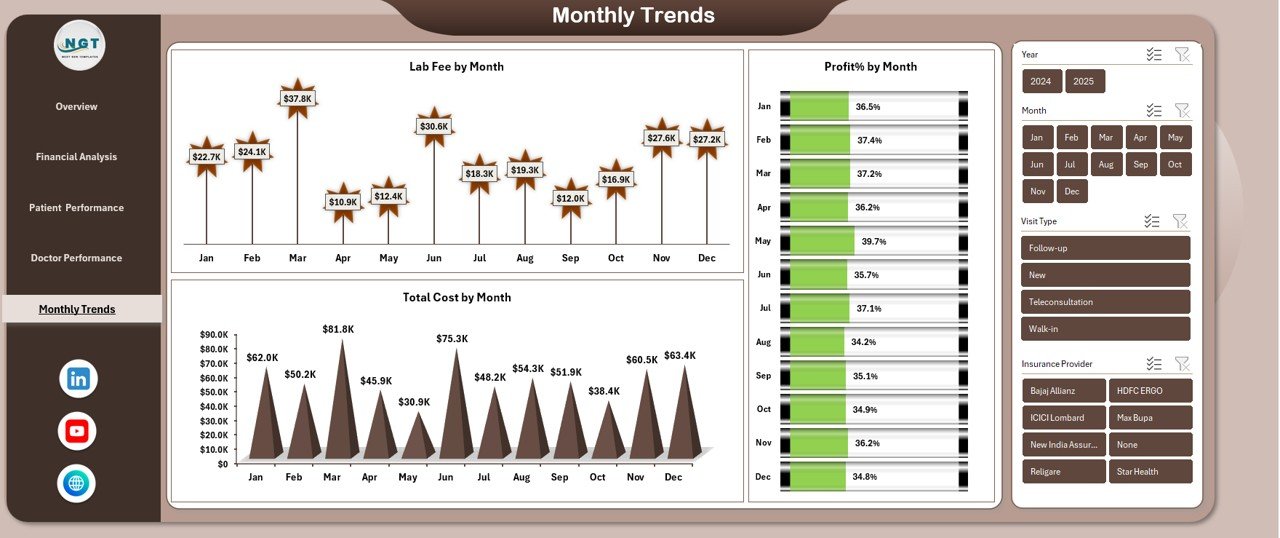
📈 Monthly Trend Analysis
Monitor lab fees, costs, and profit percentage month by month to identify growth patterns and seasonal impacts.
🔄 Pivot Table & Pivot Chart Based
Fully built on pivot tables and pivot charts, allowing flexible filtering without complex formulas.
🧩 Fully Customizable in Excel
Add new KPIs, departments, doctors, or historical data as your clinic grows.
## 📂 What’s Inside the Clinics Dashboard in Excel
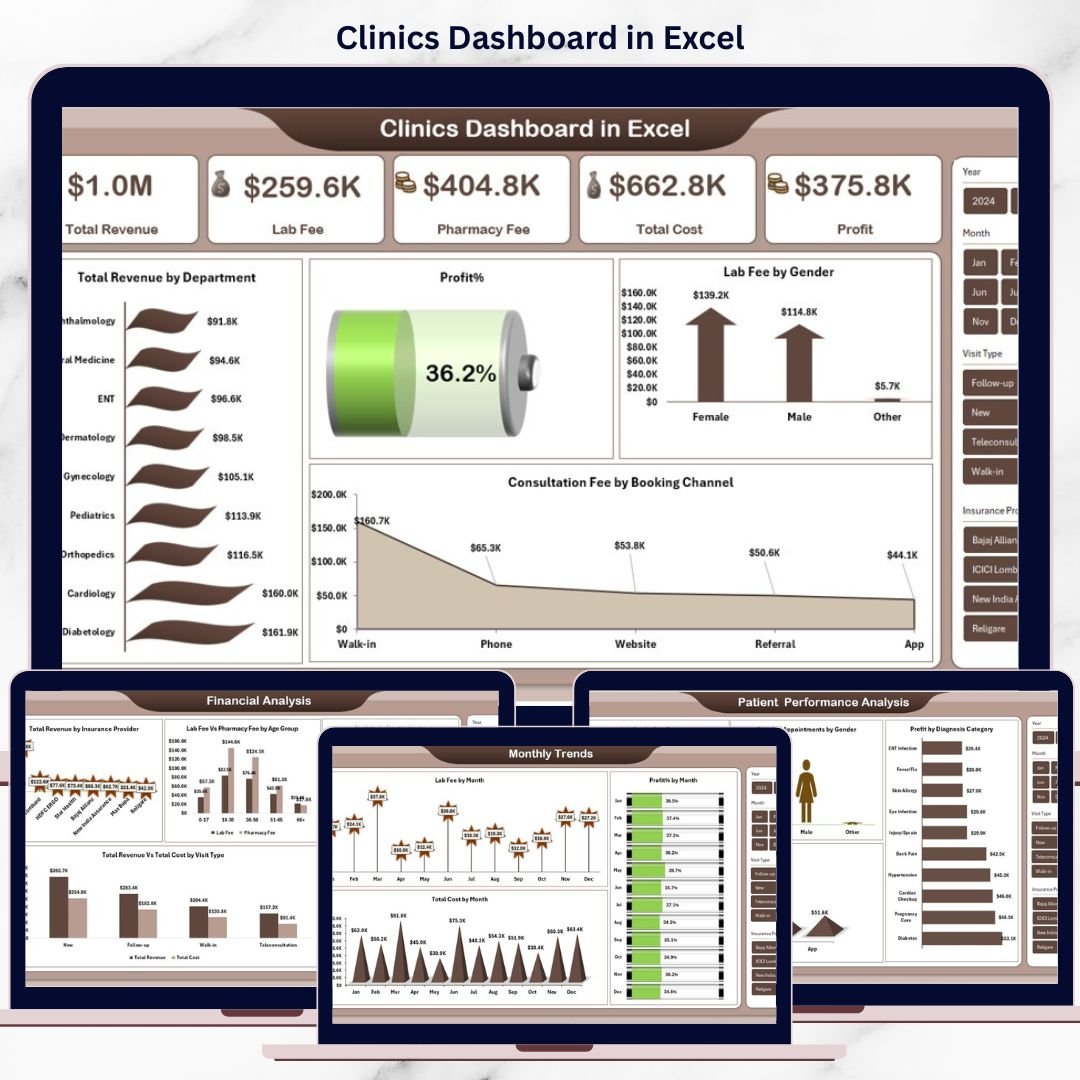
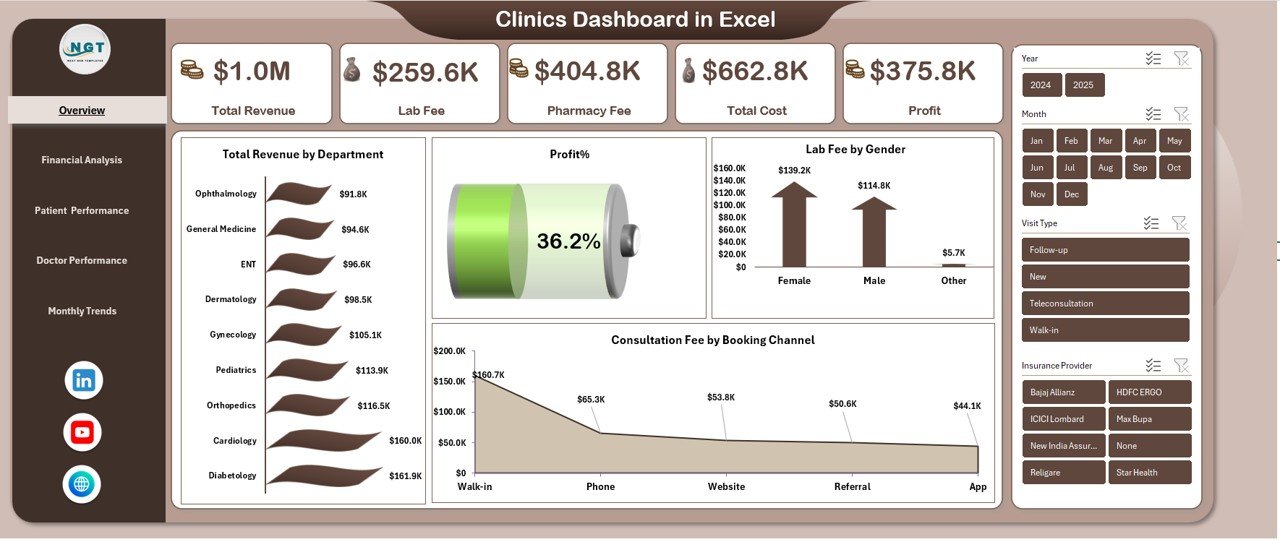
📑 Overview Sheet
A high-level snapshot showing total revenue, lab fee, pharmacy fee, total cost, profit, and profit percentage—perfect for quick decisions.
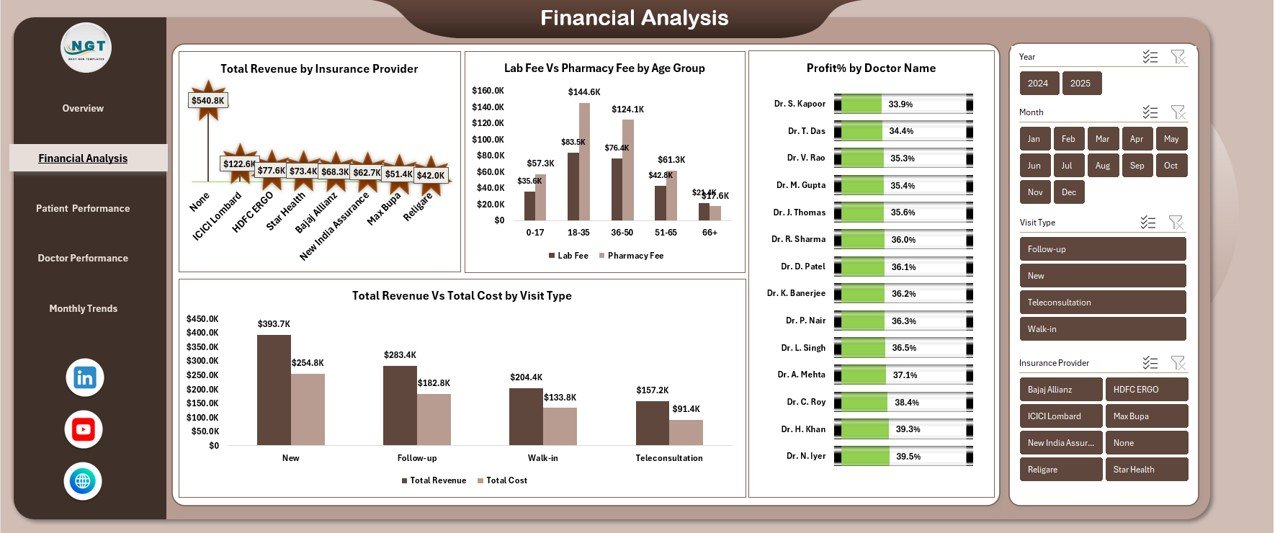
📊 Financial Analysis Sheet
Deep financial insights such as revenue by insurance provider, lab vs pharmacy fee by age group, profit by doctor, and revenue vs cost by visit type.
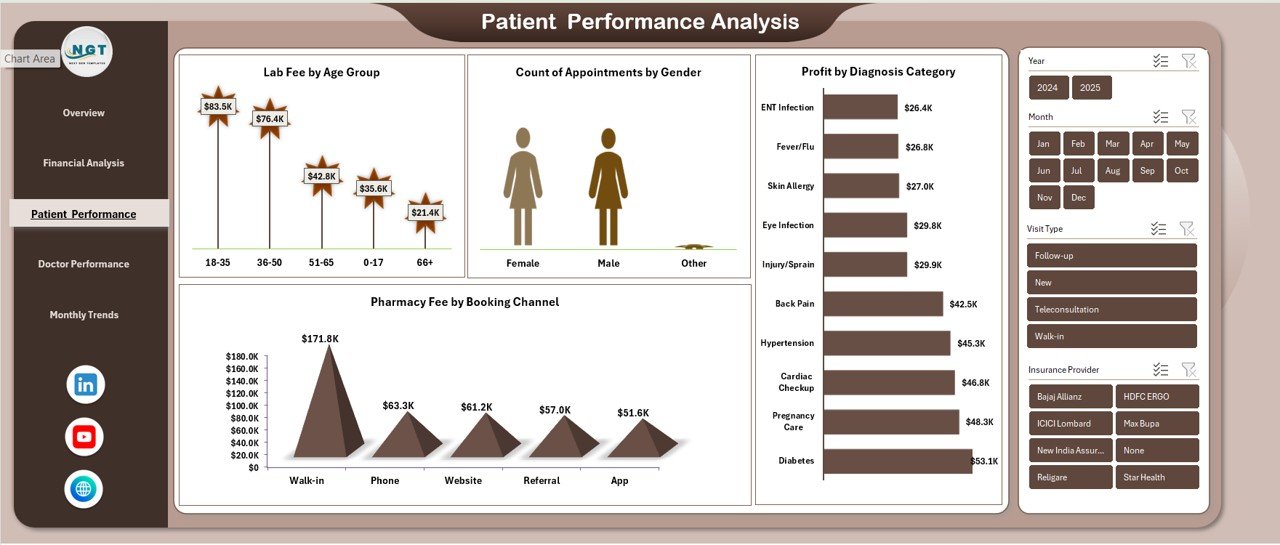
👥 Patient Performance Analysis Sheet
Visual analysis of appointments by gender, lab usage by age group, pharmacy fee by booking channel, and profit by diagnosis category.
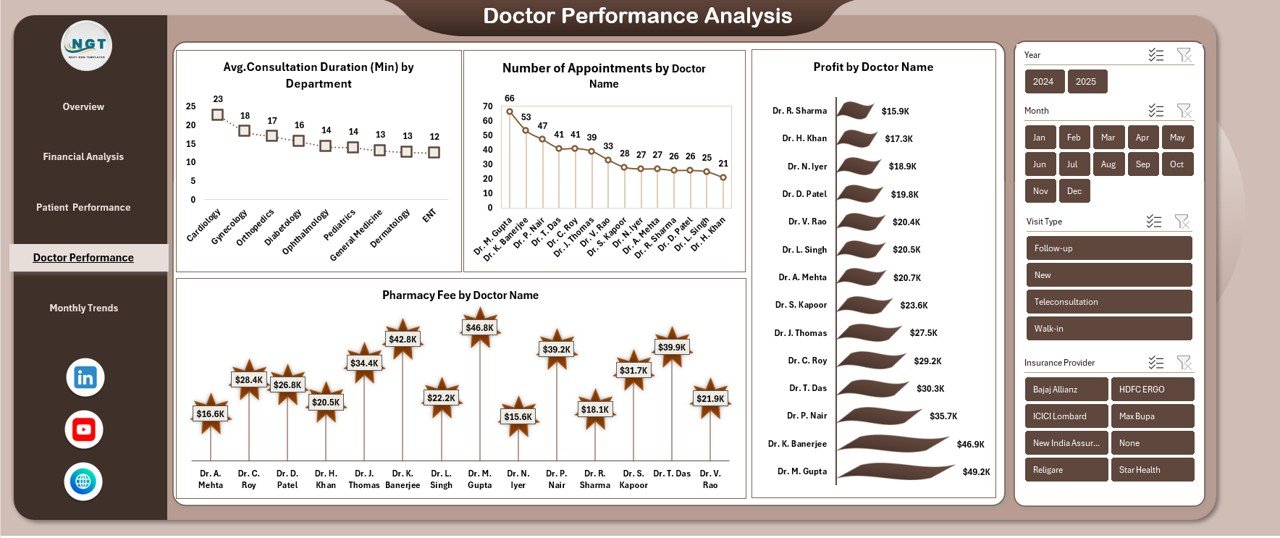
👨⚕️ Doctor Performance Analysis Sheet
Doctor-wise appointment count, consultation duration, pharmacy contribution, and profit analysis.
📅 Monthly Trends Sheet
Month-wise trends for lab fee, total cost, and profit percentage to support forecasting and planning.
📁 Structured Data Tables
Clean, well-organized Excel tables that feed all pivot charts and visuals seamlessly.
## 🛠️ How to Use the Clinics Dashboard in Excel
1️⃣ Enter or import your clinic data into the provided Excel data tables
2️⃣ Refresh pivot tables with a single click
3️⃣ Use filters and slicers to analyze by department, doctor, age group, gender, booking channel, or month
4️⃣ Review KPIs and charts to identify trends, risks, and opportunities
5️⃣ Use insights to improve pricing, staffing, services, and profitability
No advanced Excel skills are required. If you understand basic Excel navigation, you can use this dashboard confidently.
## 🎯 Who Can Benefit from This Clinics Dashboard in Excel
🏥 Clinic Owners & Founders
📋 Hospital & Clinic Administrators
💼 Finance & Operations Managers
👨⚕️ Medical Directors
📊 Healthcare Analysts
🏨 Multi-department & Single-clinic Operators
Whether you run a small clinic or a multi-specialty healthcare center, this dashboard adapts to your needs.
Click here to read the Detailed Blog Post
Watch the step-by-step video tutorial:
Visit our YouTube Channel to learn step-by-step video tutorials.


Reviews
There are no reviews yet.