Clinic Project Management Dashboard is complex and high stakes. From infrastructure upgrades and IT implementations to medical equipment installations and compliance initiatives, clinics juggle multiple projects simultaneously. When project data is scattered across Excel files, emails, and static reports, visibility drops. As a result, delays increase, budgets spiral, and risks remain unnoticed.
That is exactly why the Clinic Project Management Dashboard in Power BI is a game-changing solution. 🚀
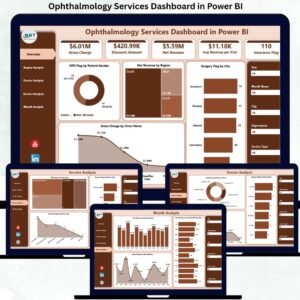
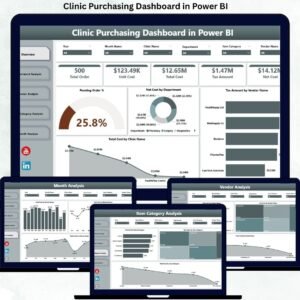
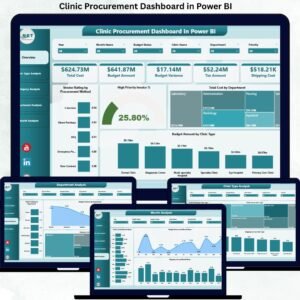
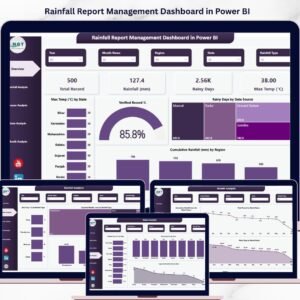
This professionally designed Power BI dashboard transforms raw clinic project data into interactive KPIs, real-time visuals, and actionable insights—helping clinics stay on budget, on schedule, and in control.
Built for modern healthcare environments, this dashboard enables clinic leaders to move from reactive firefighting to proactive project governance—without manual reporting or guesswork.
Key Features of Clinic Project Management Dashboard in Power BI 🔑
📊 Centralized Project Visibility
Track all clinic projects, budgets, timelines, risks, and statuses from a single interactive dashboard.
📈 Real-Time KPI Monitoring
Instantly view Planned Budget, Actual Cost, Active Projects, and Delayed Project % at a glance.
🧭 Powerful Interactive Slicers
Filter data by clinic name, department, project manager, project type, or time period.
📉 Department & Manager Performance Insights
Identify high-performing departments and project managers while detecting bottlenecks early.
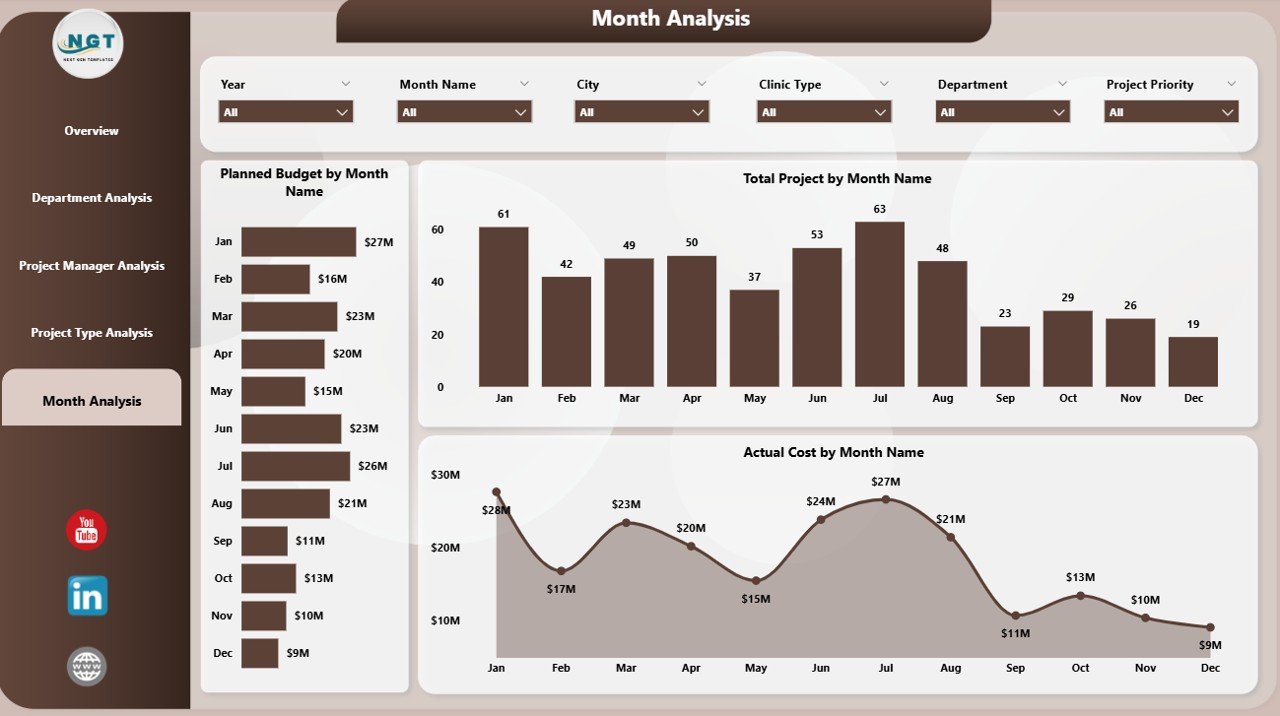
📅 Monthly Trend Analysis
Understand spending patterns, workload fluctuations, and delivery trends over time.
⚡ Faster Decision-Making
Dynamic visuals update instantly, enabling quick response to delays, risks, and overruns.
💼 Executive-Ready Reporting
Perfect for leadership reviews, compliance reporting, and strategic planning.
What’s Inside the Clinic Project Management Dashboard in Power BI 📁
This ready-to-deploy Power BI solution includes five professionally structured pages:
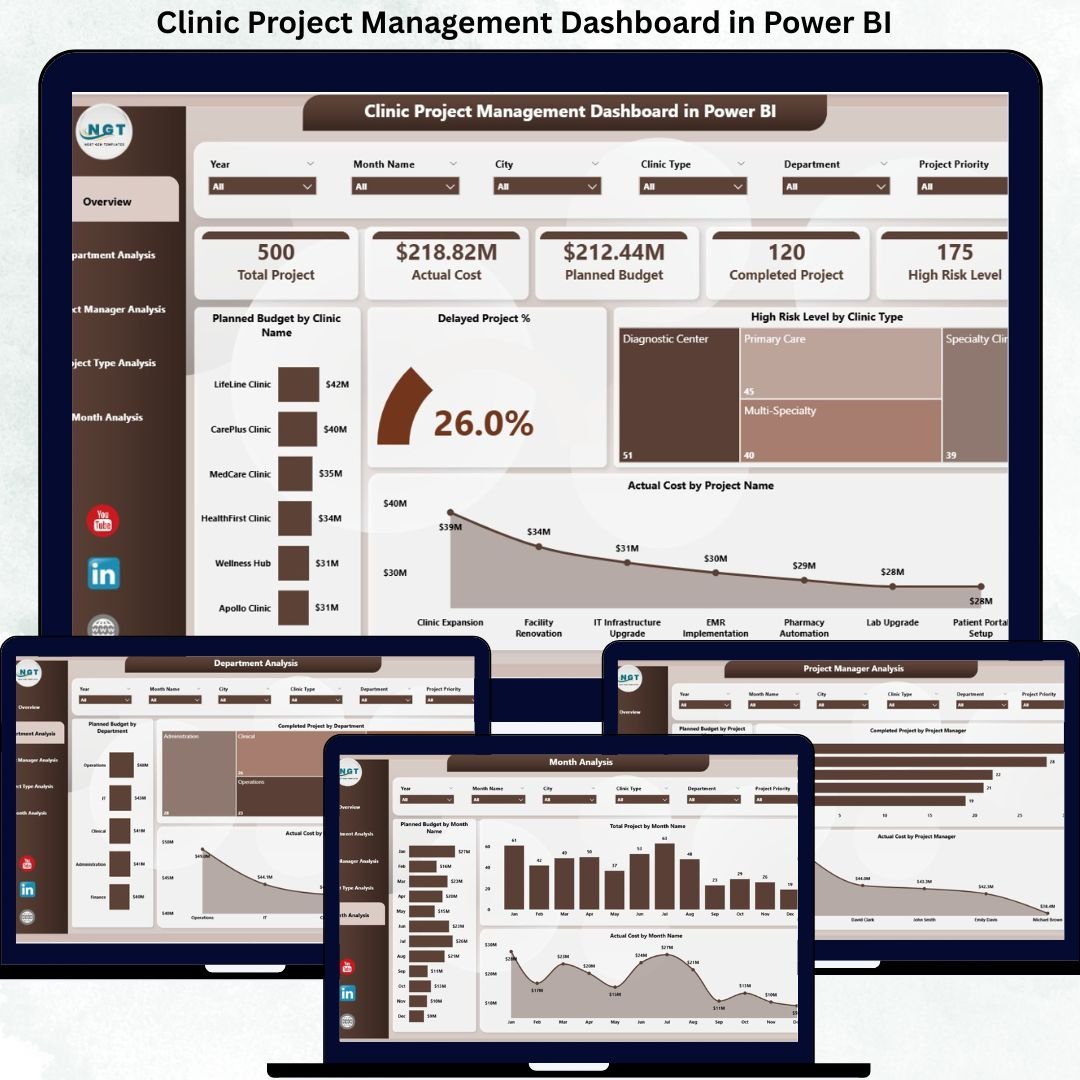
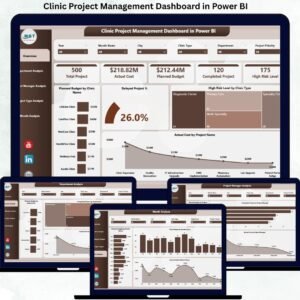
📄 Overview Page
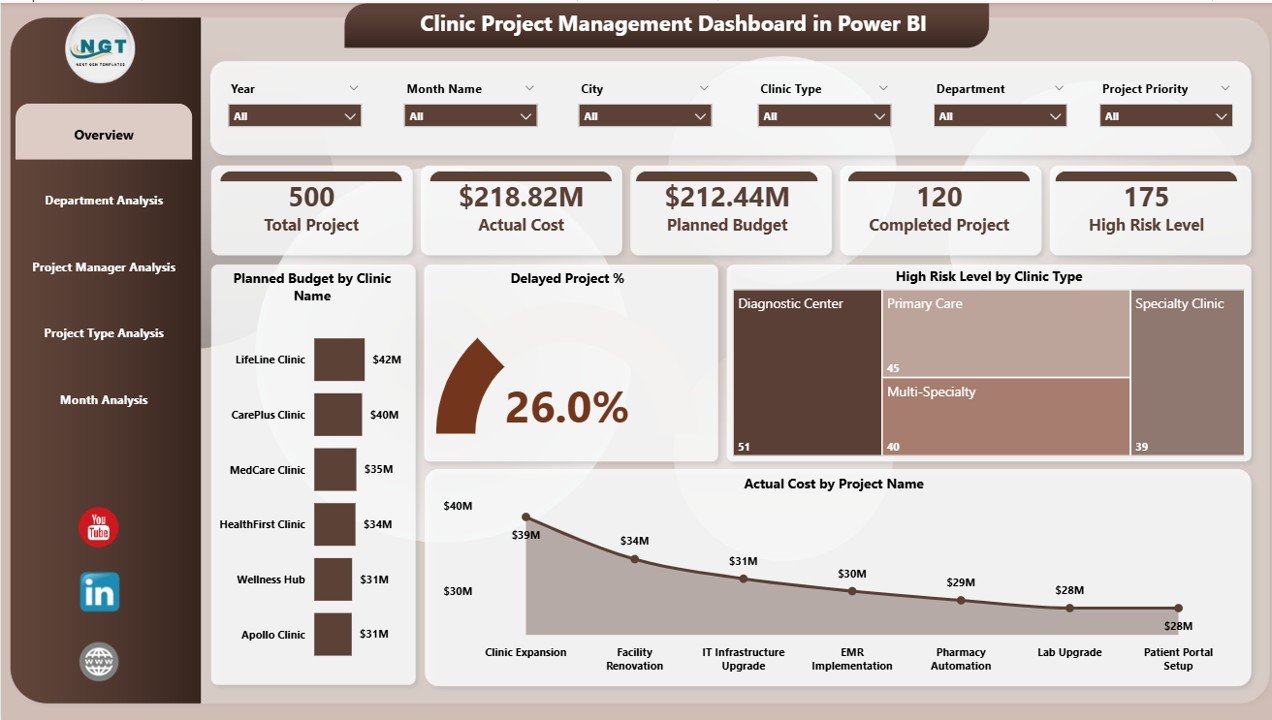
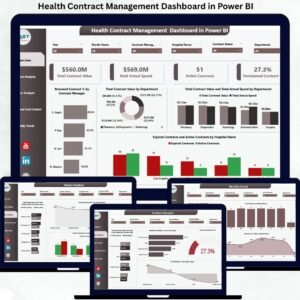
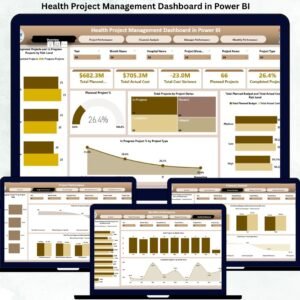
A command center with KPI cards and visuals such as Planned Budget by Clinic, Delayed Project %, High-Risk Levels, and Actual Cost by Project.
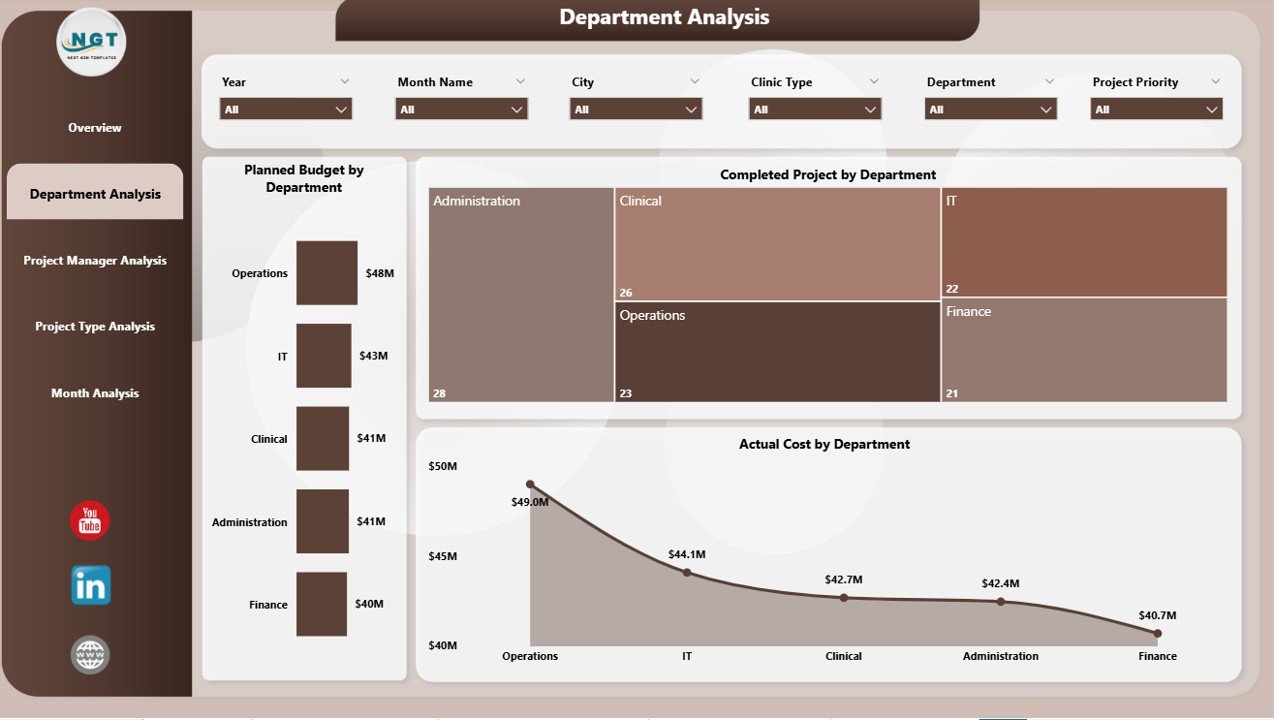
📄 Department Analysis Page
Analyze planned budgets, completed projects, and actual costs across departments like IT, Facilities, and Clinical Operations.
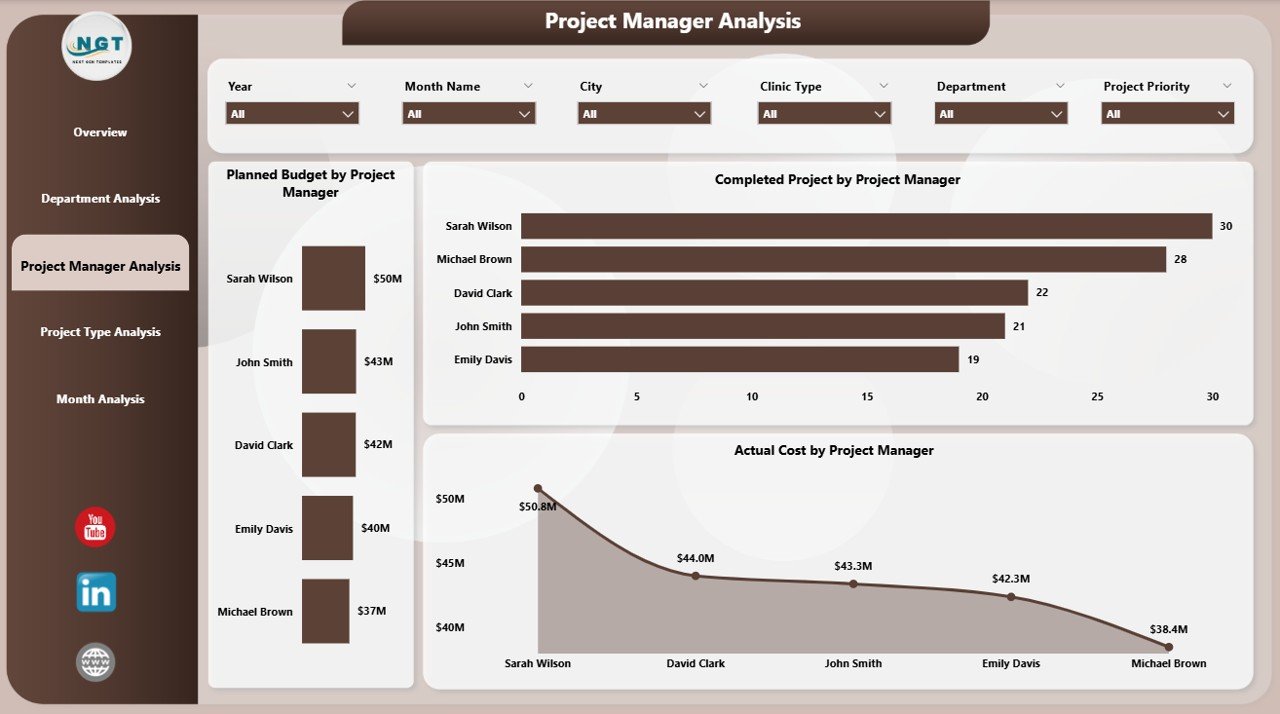
📄 Project Manager Analysis Page
Evaluate budget responsibility, cost control, and delivery effectiveness by project manager.
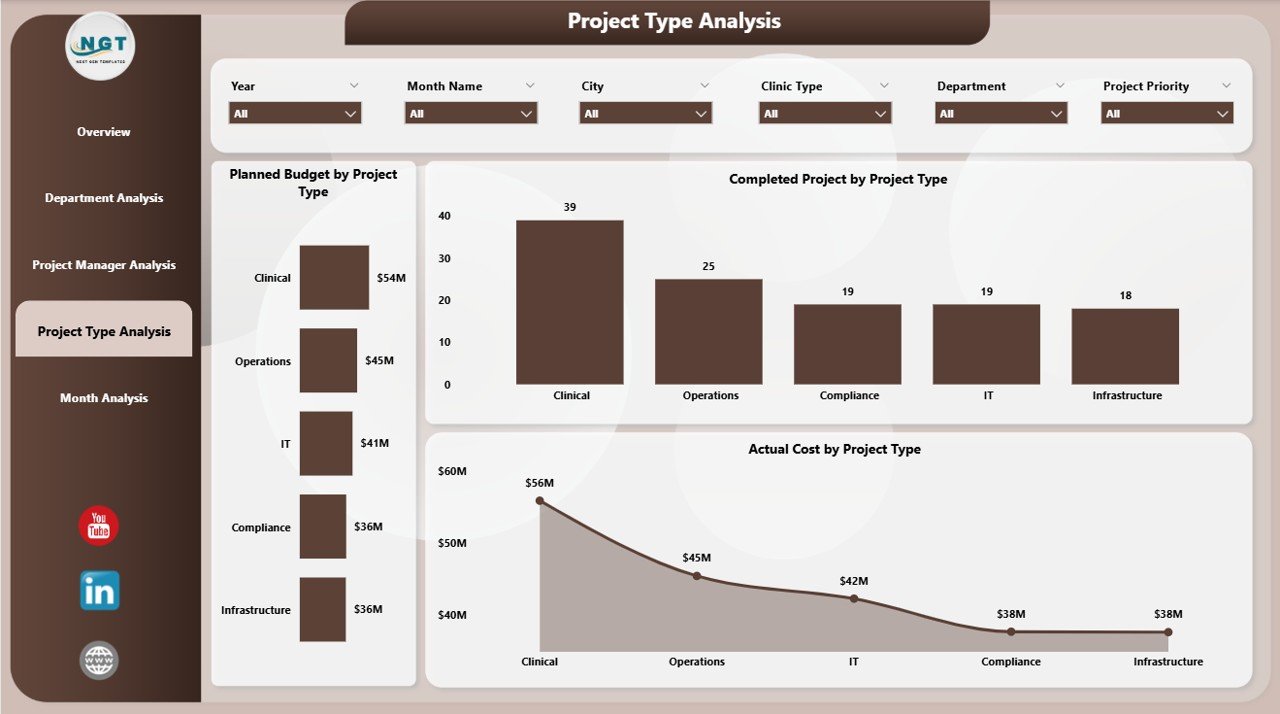
📄 Project Type Analysis Page
Compare performance across infrastructure, IT, compliance, and equipment installation projects.
📄 Monthly Trends Page
Track planned budget, total projects, and actual cost trends month by month.
Each page is designed to answer real business questions faced by clinic leadership.
How to Use the Clinic Project Management Dashboard in Power BI 🛠️
1️⃣ Connect your project data from Excel, SharePoint, or databases
2️⃣ Use slicers to filter by clinic, department, or project type
3️⃣ Instantly view updated KPIs and charts
4️⃣ Identify risks, delays, and budget overruns
5️⃣ Share insights securely with stakeholders
No advanced technical skills are required—Power BI handles the complexity behind the scenes.
Who Can Benefit from This Clinic Project Management Dashboard 👥
🏥 Clinic Administrators – Gain complete visibility into ongoing projects
📊 Project Managers – Track progress, budgets, and risks effortlessly
💰 Finance Teams – Monitor costs, variances, and budget control
⚙️ Operations Heads – Improve cross-department coordination
👔 Executive Leadership – Make confident, data-driven decisions
Whether you manage a single clinic or a multi-location healthcare network, this dashboard scales with your needs.
Click here to read the Detailed blog post
Visit our YouTube channel to learn step-by-step video tutorials


Reviews
There are no reviews yet.