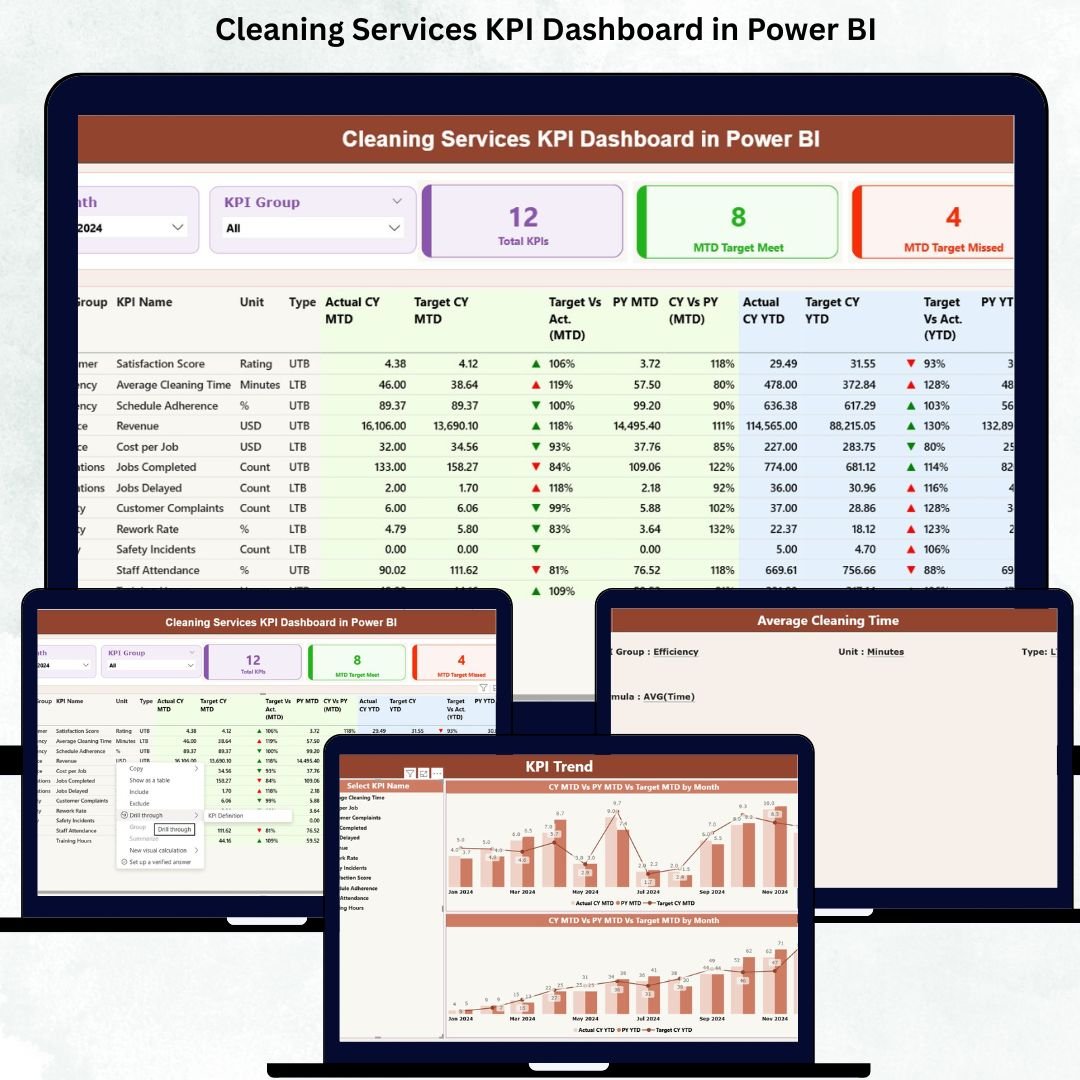
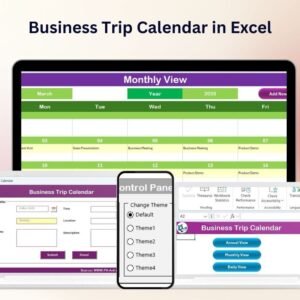
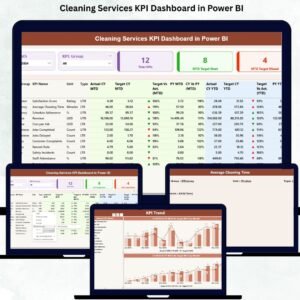
Managing a cleaning business is not easy. Every day, your team handles multiple sites, client expectations, quality checks, deadlines, complaints, and operational costs — all at the same time. Without clear insights, it becomes difficult to control performance or identify what needs improvement. That’s where the Cleaning Services KPI Dashboard in Power BI becomes a complete game-changer. 📊✨Cleaning Services KPI Dashboard in Power BI
This ready-to-use dashboard transforms your Excel data into powerful visuals, KPI cards, trend charts, and drill-through pages. Instead of guessing what is happening, you get real-time clarity across cleaning quality, productivity, customer satisfaction, and service delivery. Whether you manage a single site or hundreds of locations, this dashboard brings all essential metrics into one professional, easy-to-use system.
Below, you will explore the core features, what’s included, how to use it, and who will benefit the most from this Power BI solution.
🔥 Key Features of Cleaning Services KPI Dashboard in Power BI
The dashboard includes three powerful pages, each designed to give you deep insights into your cleaning operations:
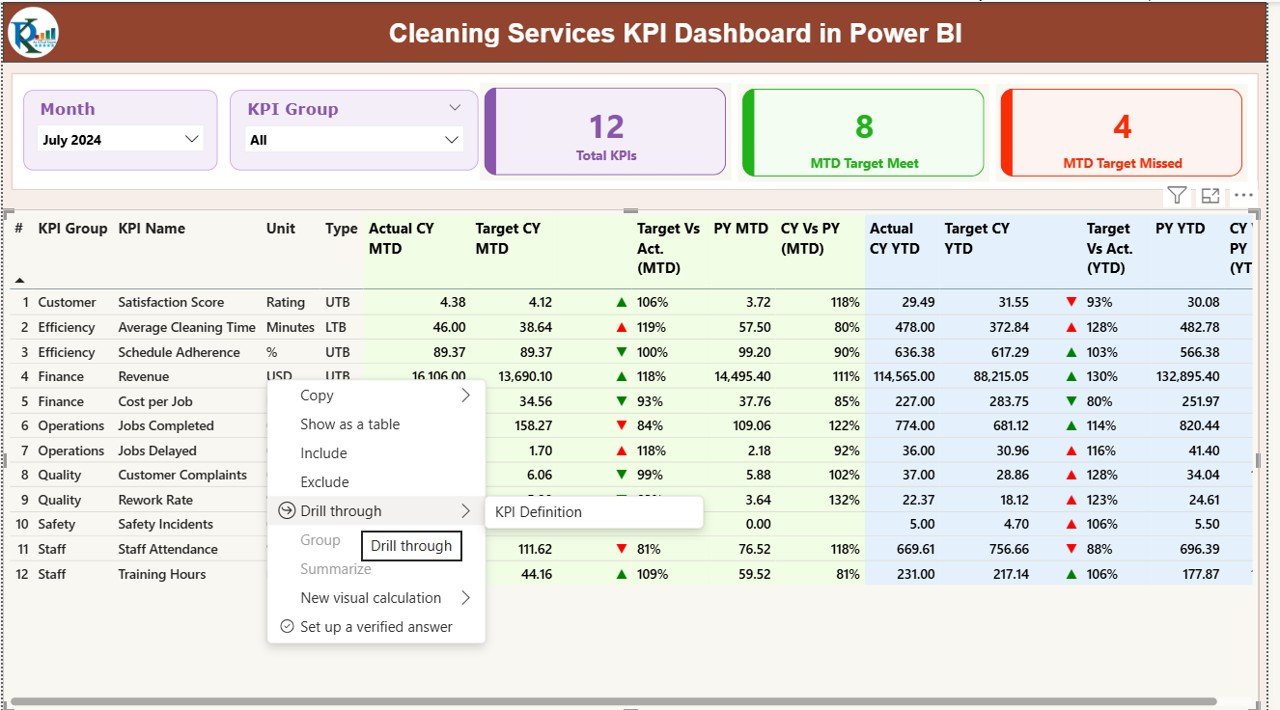
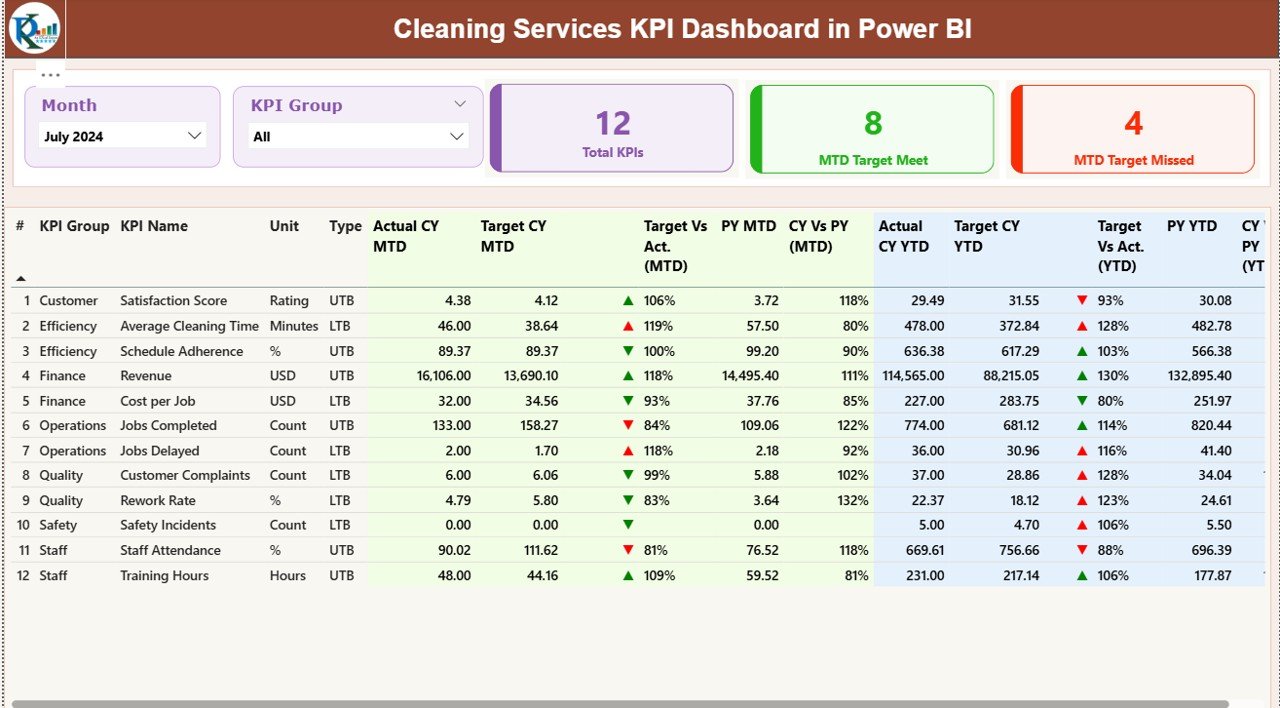
📌 1. Summary Page – Your Main Control Center
This page gives an instant snapshot of performance with:
-
Month & KPI Group slicers to switch between periods and areas
-
Cards showing Total KPIs, MTD Target Met, MTD Target Missed
-
A clean KPI table displaying Actuals vs Targets for MTD and YTD
-
Automatic icons (✔️▲ / ❌▼) to highlight performance
This page helps managers check performance within seconds and understand whether operations are on track.
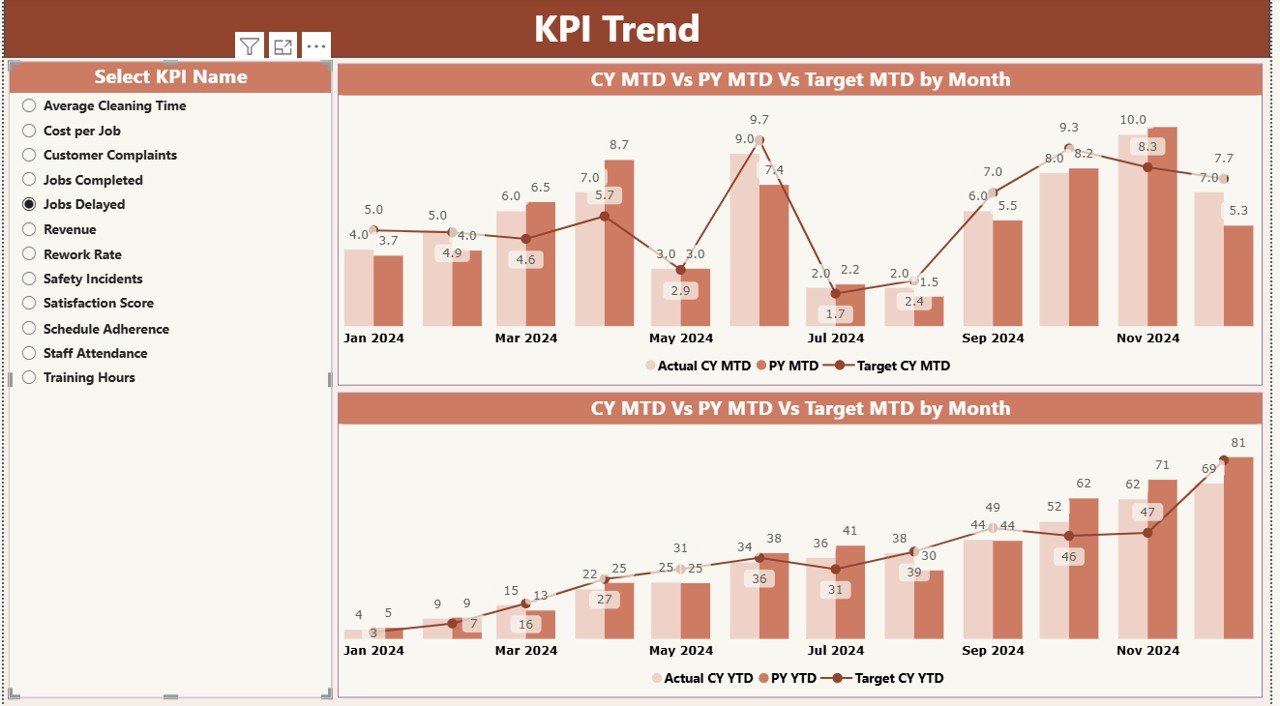
📌 2. KPI Trend Page – Deep Monthly & Yearly Insights
Choose a KPI using the slicer and instantly see:
-
MTD trend (Actual vs Target vs Previous Year)
-
YTD trend (Actual vs Target vs Previous Year)
-
Clear patterns showing improvements, declines, and seasonal changes
This page is perfect for root-cause analysis and long-term planning.
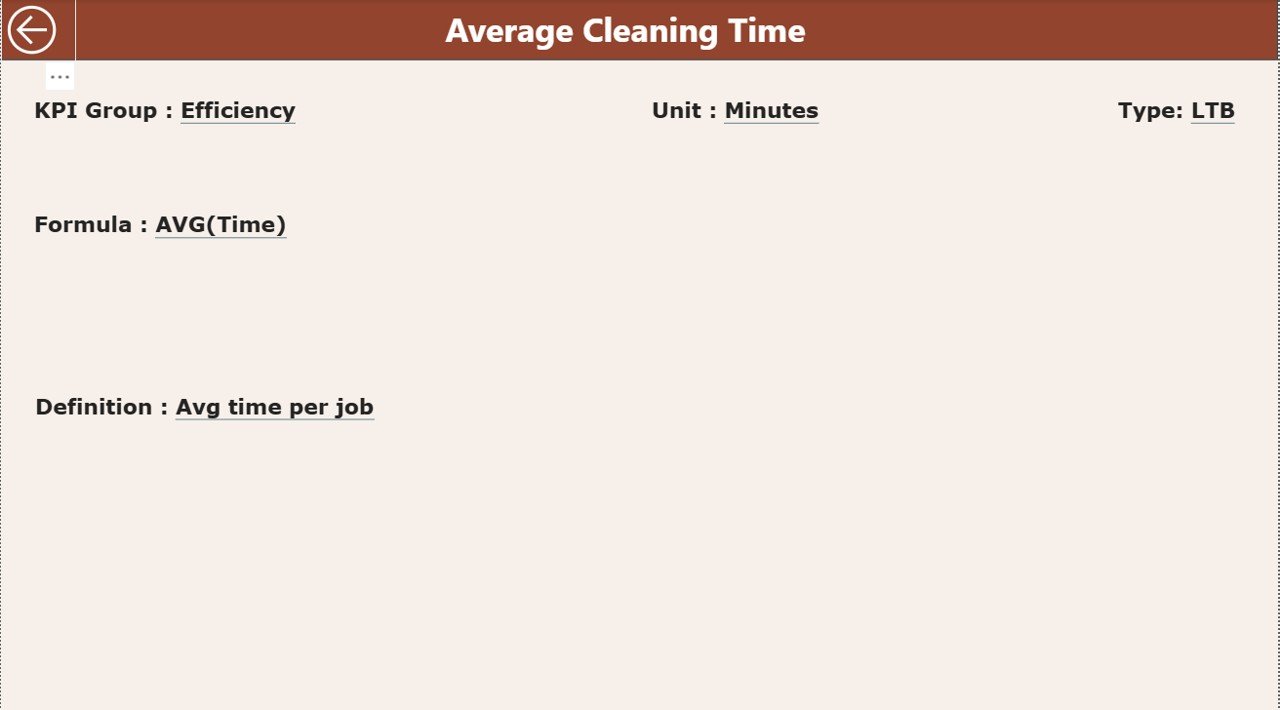
📌 3. KPI Definition Page – Clear Understanding of Every KPI
A hidden drill-through page showing:
-
KPI Number
-
KPI Group
-
Unit
-
Formula
-
Definition
-
Type (UTB or LTB)
This ensures your entire team interprets KPIs correctly, reducing confusion and improving reporting accuracy.
📦 What’s Inside the Cleaning Services KPI Dashboard in Power BI
When you download this product, you receive:
📁 1. Fully Designed Power BI File (.PBIX)
Professionally formatted, ready to use, and 100% editable.
📁 2. Excel Data Source File
Includes:
-
Input_Actual sheet
-
Input_Target sheet
-
KPI Definition sheet
Just update these sheets monthly, and your dashboard refreshes instantly.
📁 3. Smart KPI Structure
Covers the most important cleaning performance metrics, such as:
-
Cleaning Quality Score
-
Tasks Completed
-
Staff Productivity
-
Complaint Rate
-
Cost per Job
-
Attendance & Time per Task
-
Customer Satisfaction
📁 4. Clean Layout + Professional UI
Every page is designed to be simple, modern, and easy to understand.Cleaning Services KPI Dashboard in Power BI
🧩 How to Use the Cleaning Services KPI Dashboard in Power BI
You don’t need advanced Power BI skills. Here’s how simple it is:
👉 Step 1: Enter Numbers in Excel
Fill MTD and YTD Actuals + Targets for each KPI.
👉 Step 2: Open the Power BI File
Load the Excel file. All visuals refresh automatically.
👉 Step 3: Use Slicers to Filter
Switch by month, KPI group, or specific KPIs.
👉 Step 4: Analyze Trends & Variations
Check where you are meeting targets and where improvement is needed.
👉 Step 5: Use Drill-Through for Clarity
Right-click any KPI in the Summary Page to see detailed definitions and formulas.
This makes your reporting process faster, smarter, and 10× more accurate.
👥 Who Can Benefit from This Cleaning Services KPI Dashboard in Power BI
This product is perfect for:
🧹 Cleaning Companies
Monitor SLA compliance, productivity, cost, and customer satisfaction.
🏢 Facility Management Firms
Track multi-site operations effortlessly.
👨💼 Operations Managers & Supervisors
Quick insights into team performance and quality issues.
📈 Business Owners & Directors
Make confident, data-backed decisions for scaling and improvement.
🧑🤝🧑 Client Relationship Teams
Justify performance, resolve complaints faster, and increase customer trust.
Whether you handle residential cleaning, commercial cleaning, industrial cleaning, or facility management, this dashboard gives you complete visibility over your business.
### Click here to read the Detailed blog post
Watch the step-by-step video tutorial:


Reviews
There are no reviews yet.