
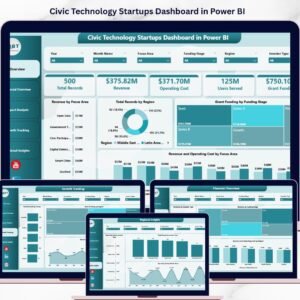
Civic Technology Startups Dashboard in Power BI is your ultimate analytics companion for monitoring and managing civic tech startup performance. If you are a startup founder, government innovation officer, venture capital analyst, or civic tech accelerator manager, this ready-to-use Power BI dashboard delivers real-time insights into revenue streams, grant funding, operating costs, user impact, and regional performance — all in one visually stunning, interactive environment. Stop juggling spreadsheets and disconnected reports. This Civic Technology Startups Dashboard brings everything together so you can make smarter, faster, data-driven decisions for your civic innovation portfolio.
 Civic Technology Startups Dashboard in Power BI
🔑 Key Features of Civic Technology Startups Dashboard in Power BI
📊 5 Interactive Dashboard Pages – Overview, Financial Overview, Impact Analysis, Growth Tracking, and Regional Insights give you a complete 360-degree view of your civic tech startup ecosystem.
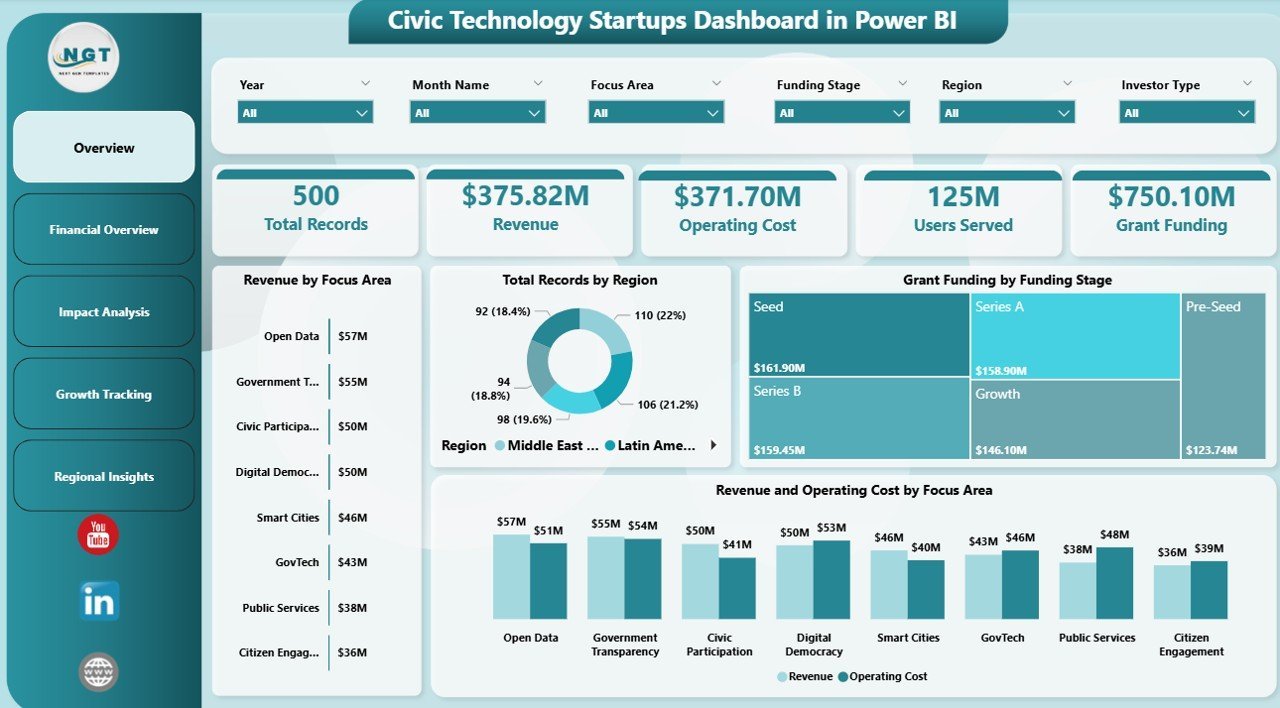
📈 Dynamic KPI Cards – Instantly view Total Records, Revenue, Operating Cost, Users Served, and Grant Funding at a glance from the Overview page.
🎯 Advanced Slicers and Filters – Apply filters by Focus Area, Region, Funding Stage, Investor Type, and Month Name to drill down into exactly the data you need.
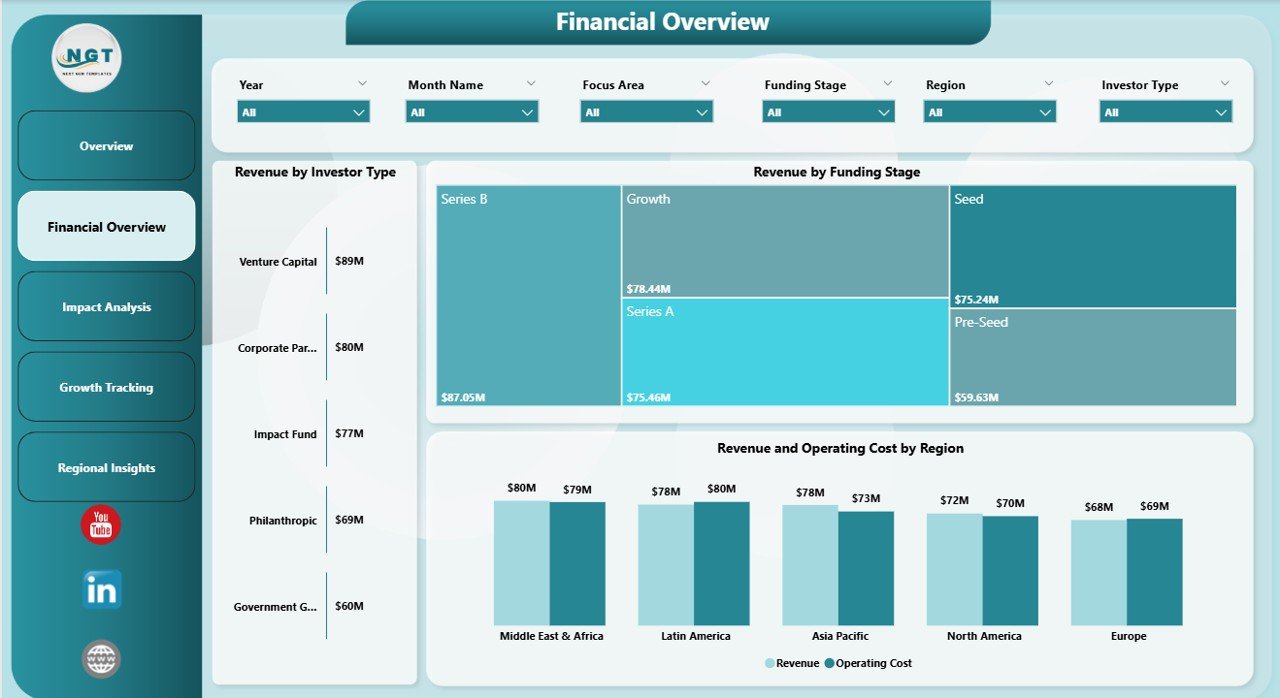
💰 Comprehensive Financial Analysis – Compare Revenue by Investor Type, Revenue by Funding Stage, and Revenue vs Operating Cost by Region for deeper fiscal understanding.
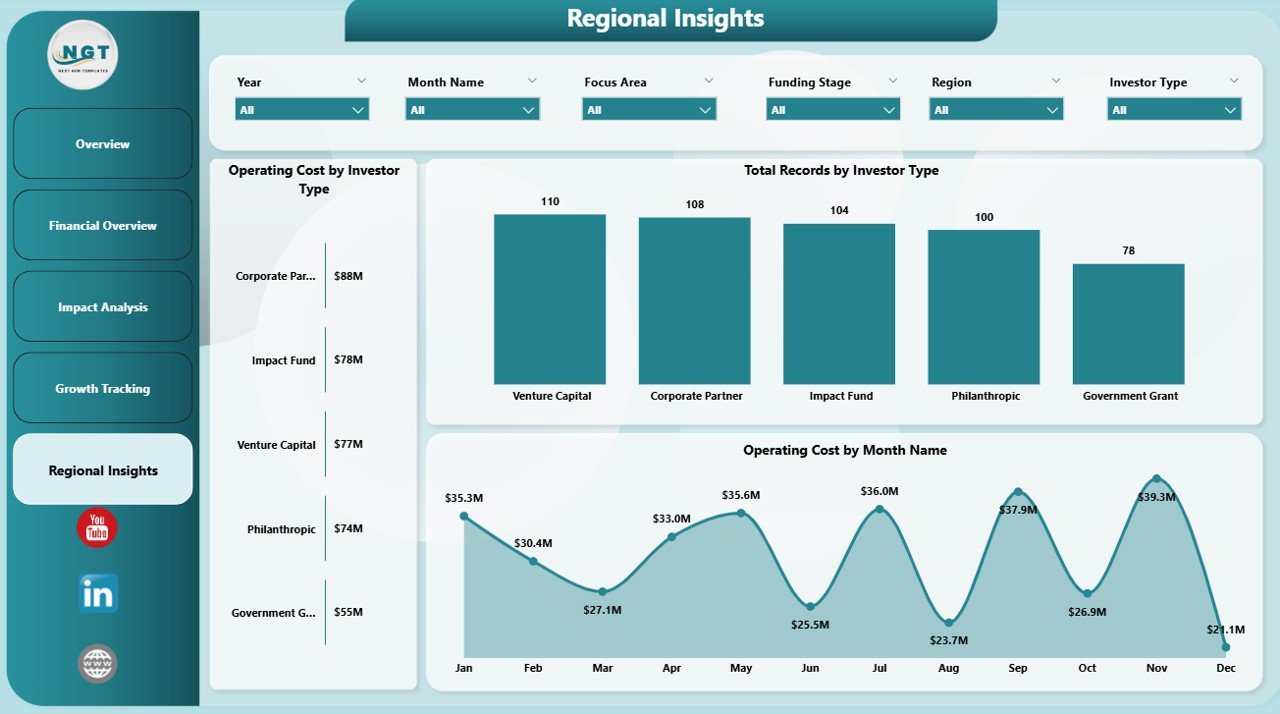
🌍 Regional Intelligence – Understand geographic performance with Operating Cost by Investor Type, Total Records by Investor Type, and Operating Cost by Month Name breakdowns.
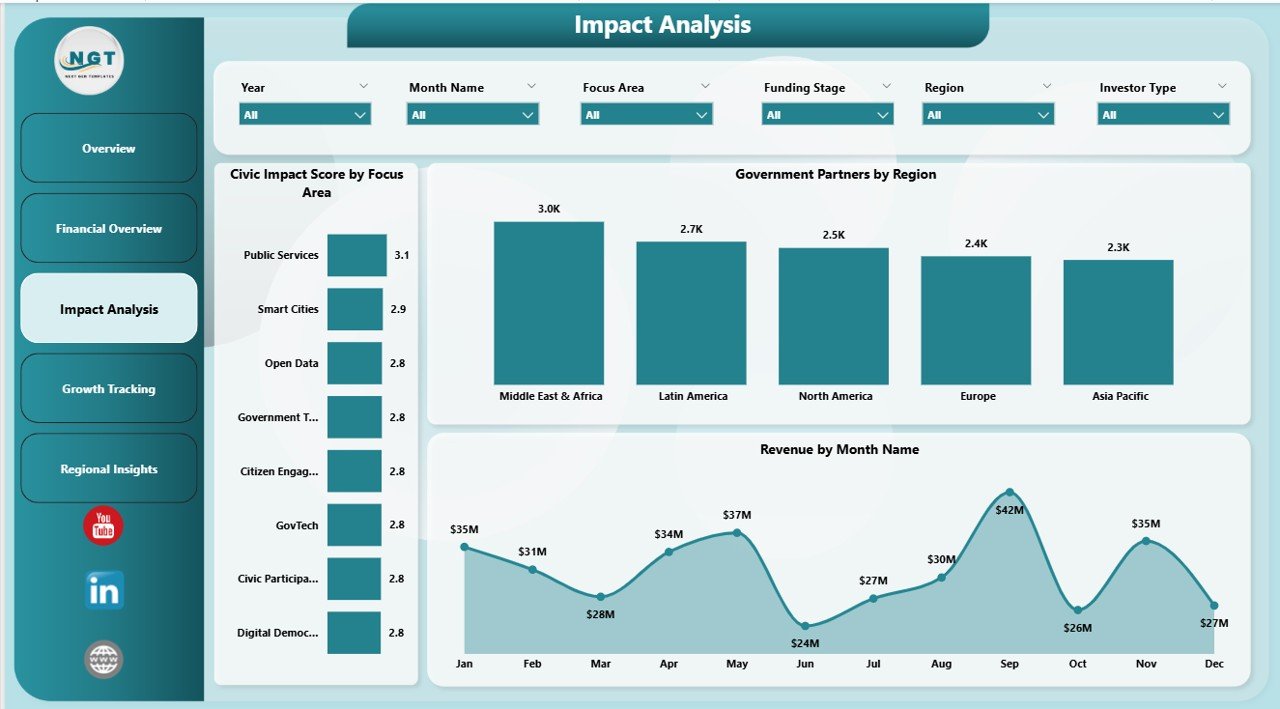
📉 Impact and Growth Metrics – Track Civic Impact Score by Focus Area, Government Partners by Region, and Grant Funding by Region to measure real-world outcomes.
⚡ Plug-and-Play Design – Simply connect your Excel data source and the entire dashboard updates automatically with your own numbers.
📦 What’s Inside the Civic Technology Startups Dashboard in Power BI
This Power BI civic tech dashboard template includes 5 professionally designed pages:
📋 Overview Page – High-level KPI cards for Total Records, Revenue, Operating Cost, Users Served, and Grant Funding. Visualizations include Revenue by Focus Area, Total Records by Region, Grant Funding by Funding Stage, and Revenue and Operating Cost by Focus Area. Multiple slicers are available for quick filtering.
💵 Financial Overview Page – Deep-dive into financial metrics with Revenue by Investor Type, Revenue by Funding Stage, and Revenue and Operating Cost by Region charts for comprehensive fiscal analysis.
🎯 Impact Analysis Page – Measure civic outcomes through Civic Impact Score by Focus Area, Government Partners by Region, and Revenue by Month Name to understand seasonal and geographic impact patterns.
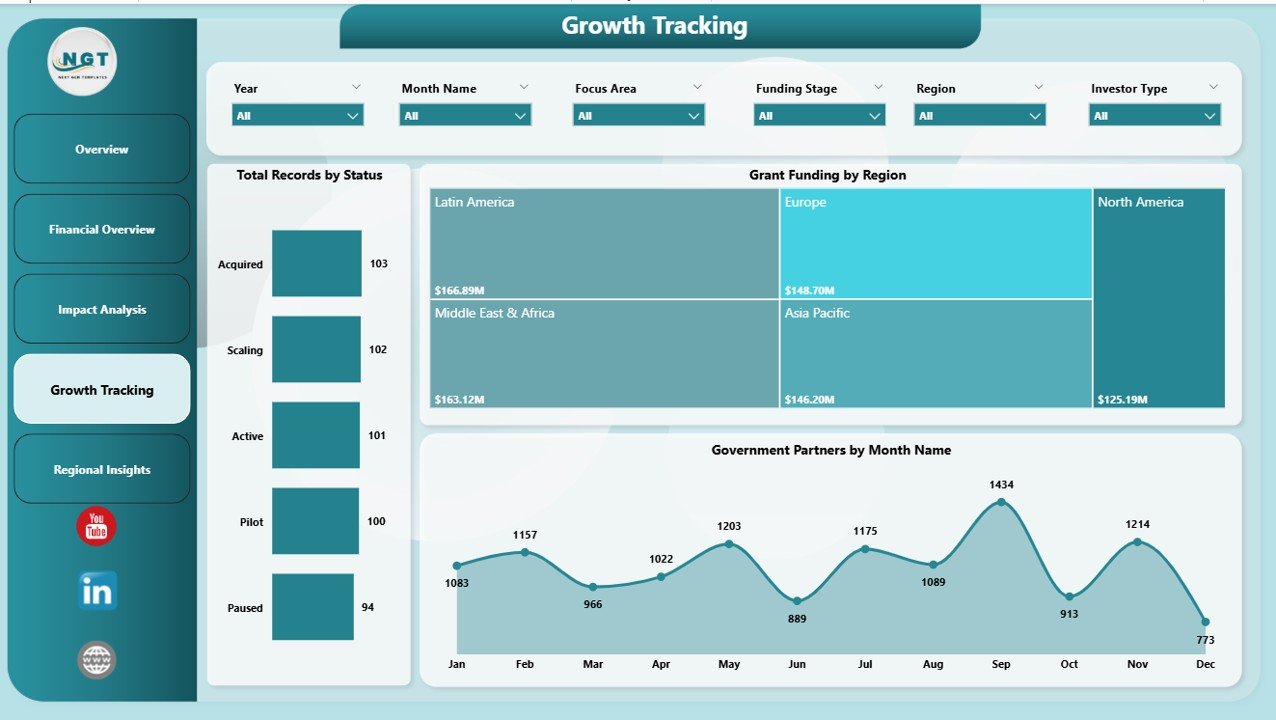
📈 Growth Tracking Page – Monitor expansion with Total Records by Status, Grant Funding by Region, and Government Partners by Month Name to identify growth trends and pipeline health.
🌐 Regional Insights Page – Explore geographic cost patterns with Operating Cost by Investor Type, Total Records by Investor Type, and Operating Cost by Month Name for location-specific decision-making.
 Financial Overview
⚙️ How to Use the Civic Technology Startups Dashboard in Power BI
1️⃣ Download and Open – Download the .pbix file and open it in Microsoft Power BI Desktop.
2️⃣ Connect Your Data – Replace the sample Excel data source with your own civic tech startup data by navigating to Transform Data and updating the file path.
3️⃣ Refresh the Dashboard – Click Refresh to populate all 5 pages with your live data.
4️⃣ Explore and Filter – Use the built-in slicers to filter by Focus Area, Region, Funding Stage, and more to uncover actionable insights.
5️⃣ Share and Collaborate – Publish to Power BI Service to share interactive reports with your team, board members, or government partners.
👥 Who Can Benefit from This Civic Technology Startups Dashboard
🏛️ Government Innovation Teams – Track civic tech partnerships and community impact effortlessly.
🚀 Startup Founders – Monitor revenue, grants, and user growth in a single professional dashboard.
💼 Venture Capital and Impact Investors – Evaluate civic tech portfolio performance by funding stage and investor type.
🎓 Accelerators and Incubators – Benchmark participating startups across regions and focus areas.
📊 Data Analysts and Consultants – Deliver client-ready Power BI dashboards for the civic technology sector quickly.
🏢 Non-Profit Organizations – Showcase grant utilization, civic impact scores, and operational efficiency to donors and stakeholders.
Explore more startup-focused analytics with our Circular Economy Startups Dashboard in Power BI for additional benchmarking across innovative sectors.
📖 Click here to read the Detailed Blog Post
🎥 Visit our YouTube channel to learn step-by-step video tutorials
👉 YouTube.com/@NextGenTemplates


Reviews
There are no reviews yet.