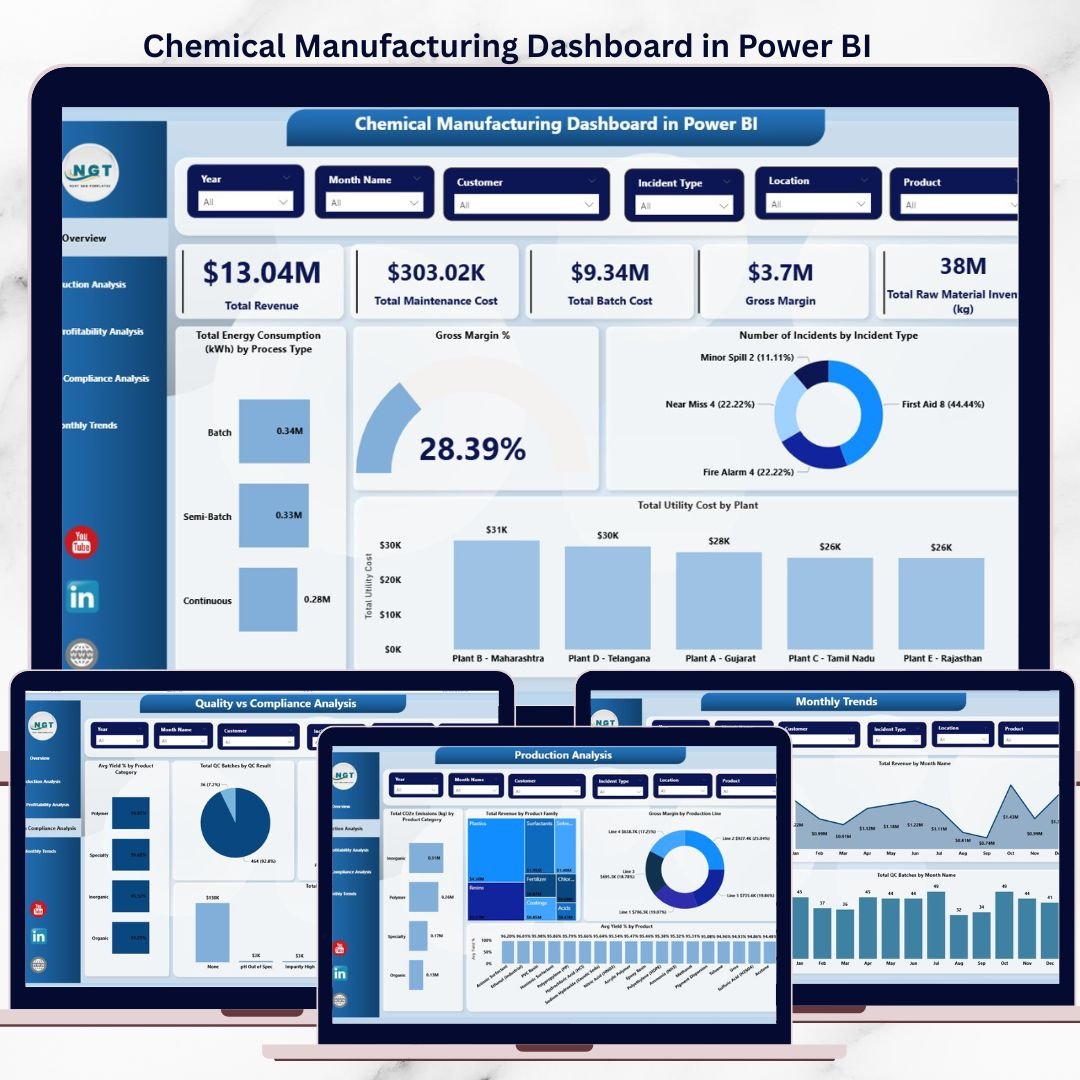
The chemical manufacturing industry runs on thin margins, strict compliance, and high operational complexity. One wrong decision can increase cost, impact quality, or trigger compliance risks. That is exactly why the Chemical Manufacturing Dashboard in Power BI is a must-have digital product for modern chemical manufacturers.
This professionally designed Power BI dashboard converts complex chemical manufacturing data into clear, interactive, and actionable insights. Instead of working with scattered spreadsheets and delayed reports, you get a single source of truth that helps you track performance, reduce waste, improve profitability, and stay audit-ready—without technical complexity.
Built for decision-makers, plant managers, and analysts, this dashboard brings production, cost, quality, energy, safety, and sustainability KPIs into one powerful analytical solution.
🚀 Key Features of Chemical Manufacturing Dashboard in Power BI
⚙️ Centralized Manufacturing KPI Monitoring
Track all critical chemical manufacturing KPIs—production, cost, quality, safety, energy, and compliance—from one interactive dashboard.
📊 Five Insight-Driven Dashboard Pages
Analyze operations through Overview, Production Analysis, Cost vs Profitability, Quality vs Compliance, and Monthly Trends pages.
💰 Cost & Profitability Intelligence
Monitor batch cost, defect impact, labor cost, utility cost, and gross margin to protect profitability.
⚡ Energy & Sustainability Tracking
Identify energy-intensive processes, monitor CO₂e emissions, and support sustainability goals.
🧪 Quality & Compliance Visibility
Track yield %, quality checks, defects, and compliance risks across plants and product categories.
📅 Monthly Trend Analysis
Understand seasonal patterns in revenue, energy usage, and quality workload for better forecasting.
🎯 Interactive Filters & Drill-Downs
Slice data by plant, product, process type, month, or category—no technical skills required.
📦 What’s Inside the Chemical Manufacturing Dashboard in Power BI
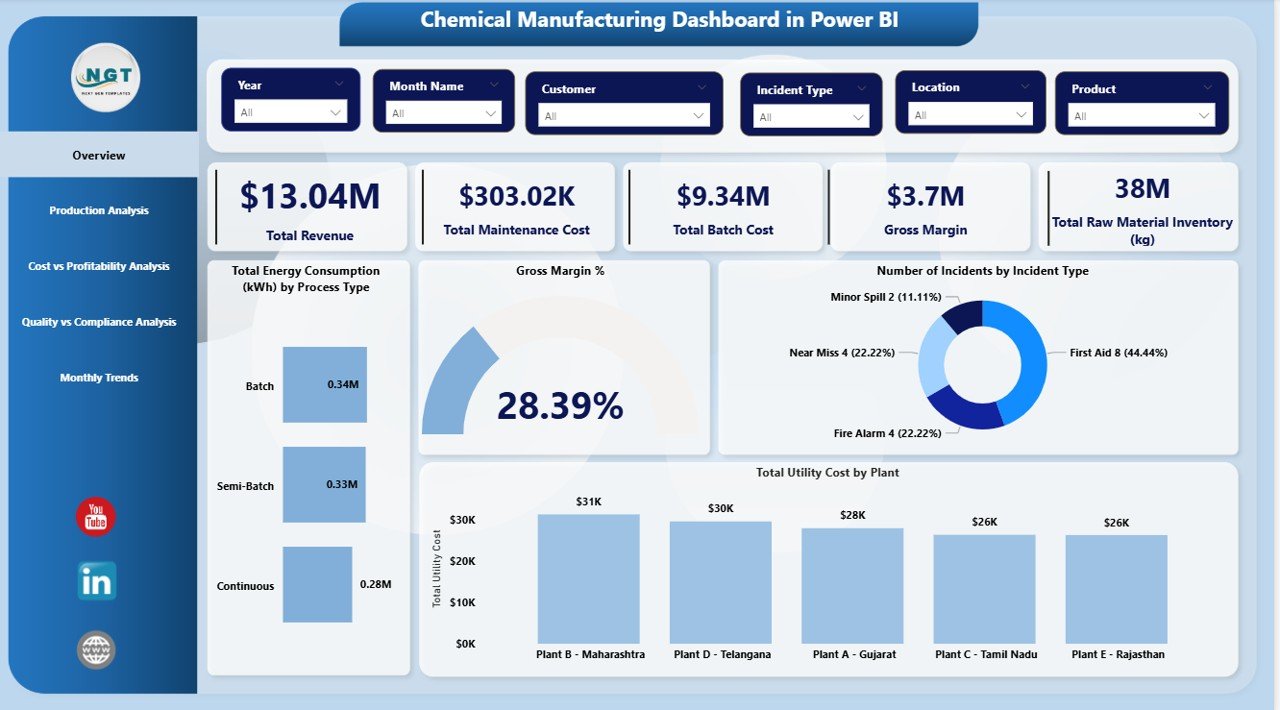
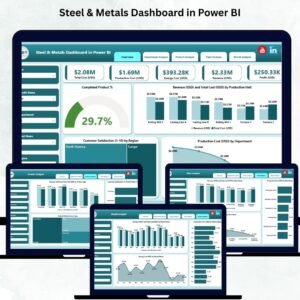
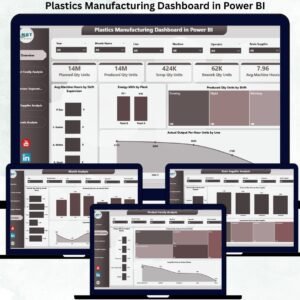
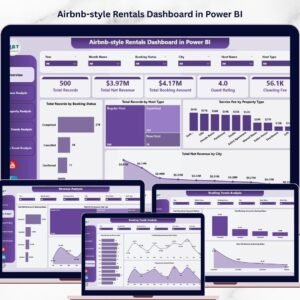
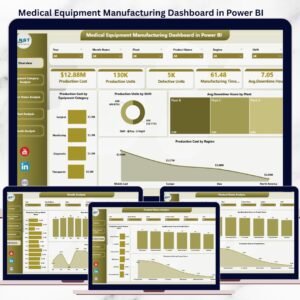
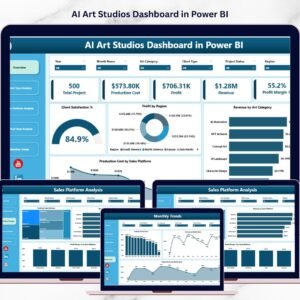
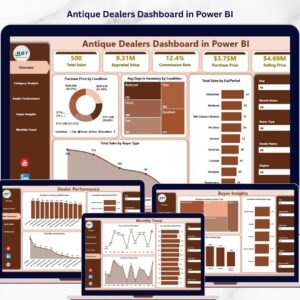
📌 Overview Page
High-level snapshot of revenue, gross margin, batch cost, maintenance cost, inventory, energy usage, and safety incidents.
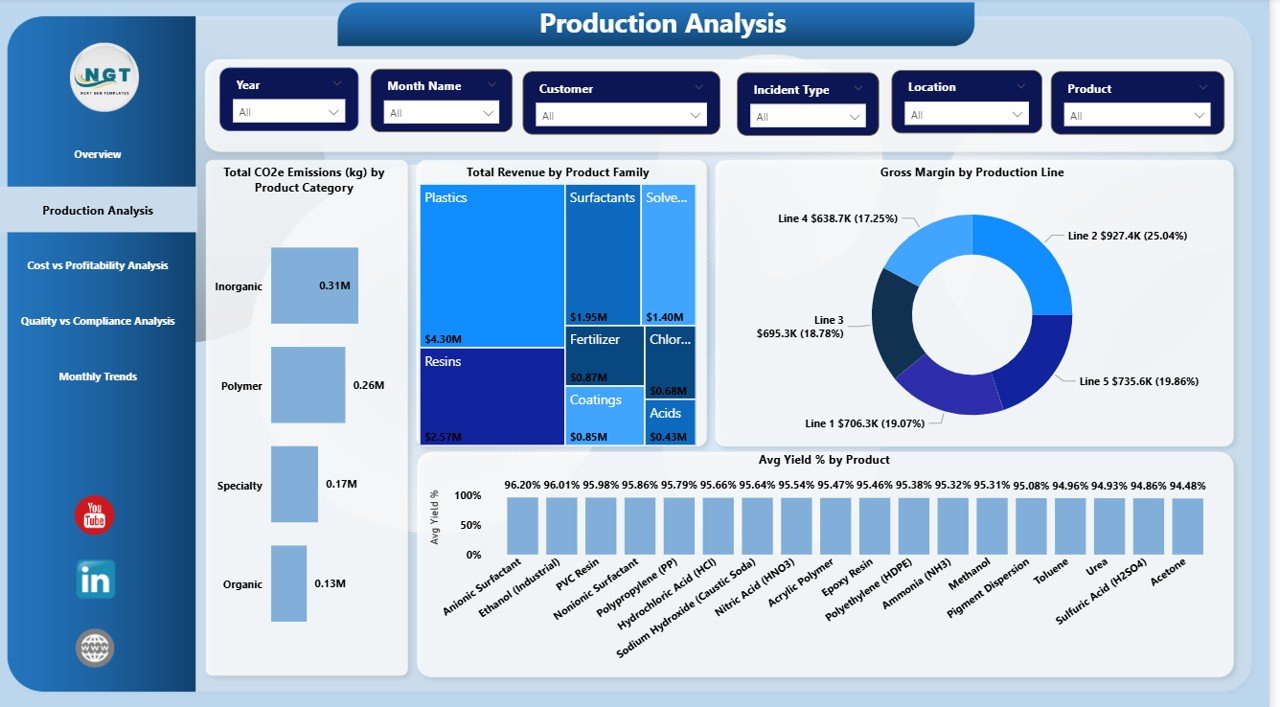
📌 Production Analysis Page
Insights into yield %, revenue by product family, gross margin by production line, and CO₂e emissions.
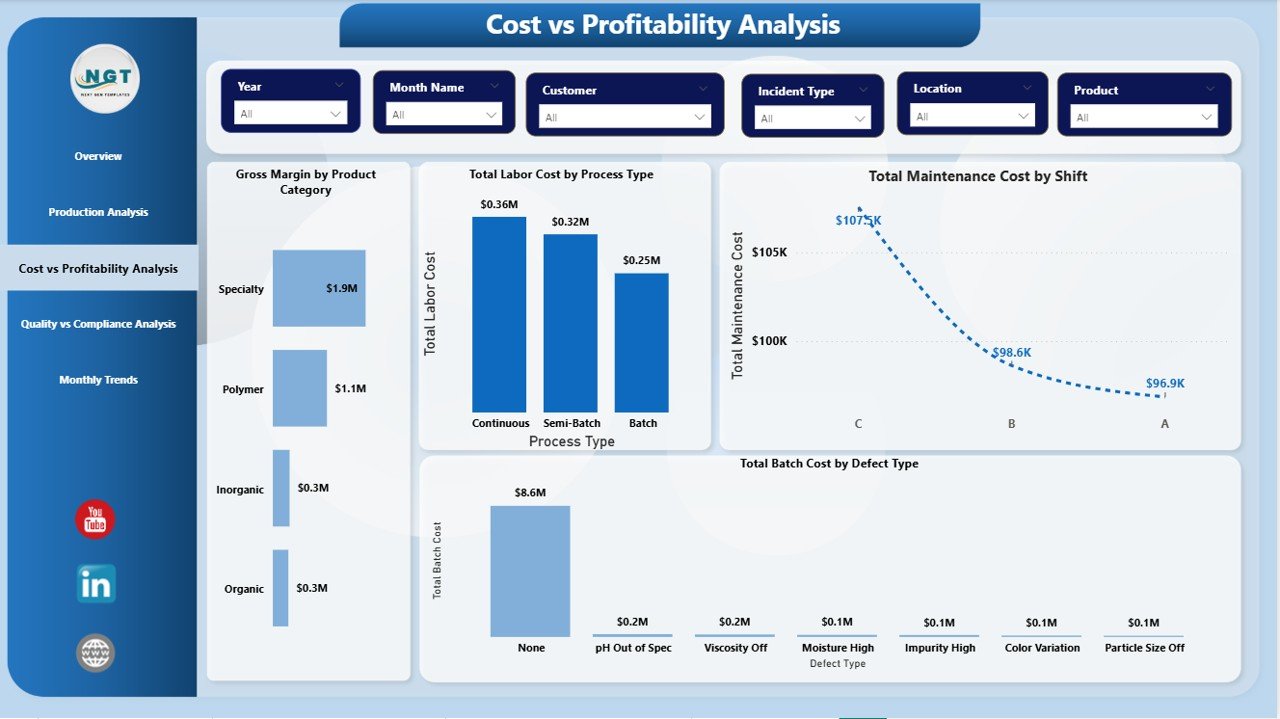
📌 Cost vs Profitability Analysis Page
Deep dive into defect cost, labor vs utility cost, and margin by product category.
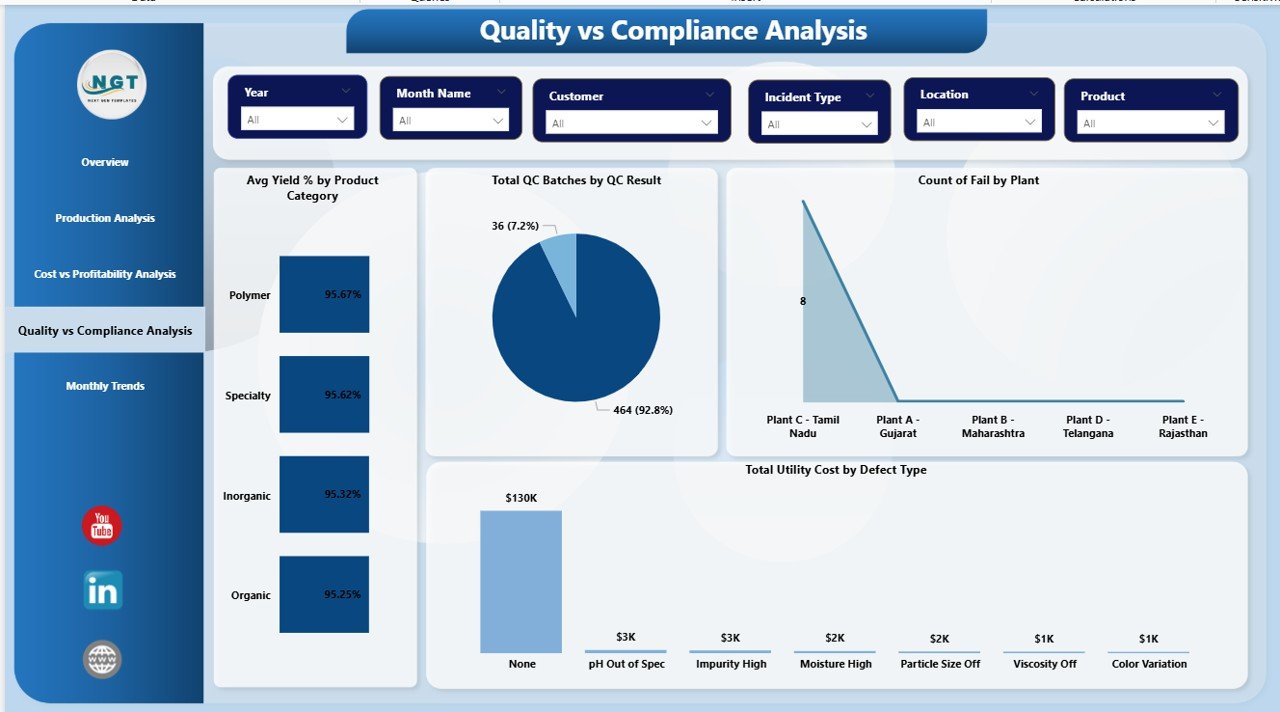
📌 Quality vs Compliance Analysis Page
Tracks quality checks, defect trends, yield performance, and compliance risk indicators.
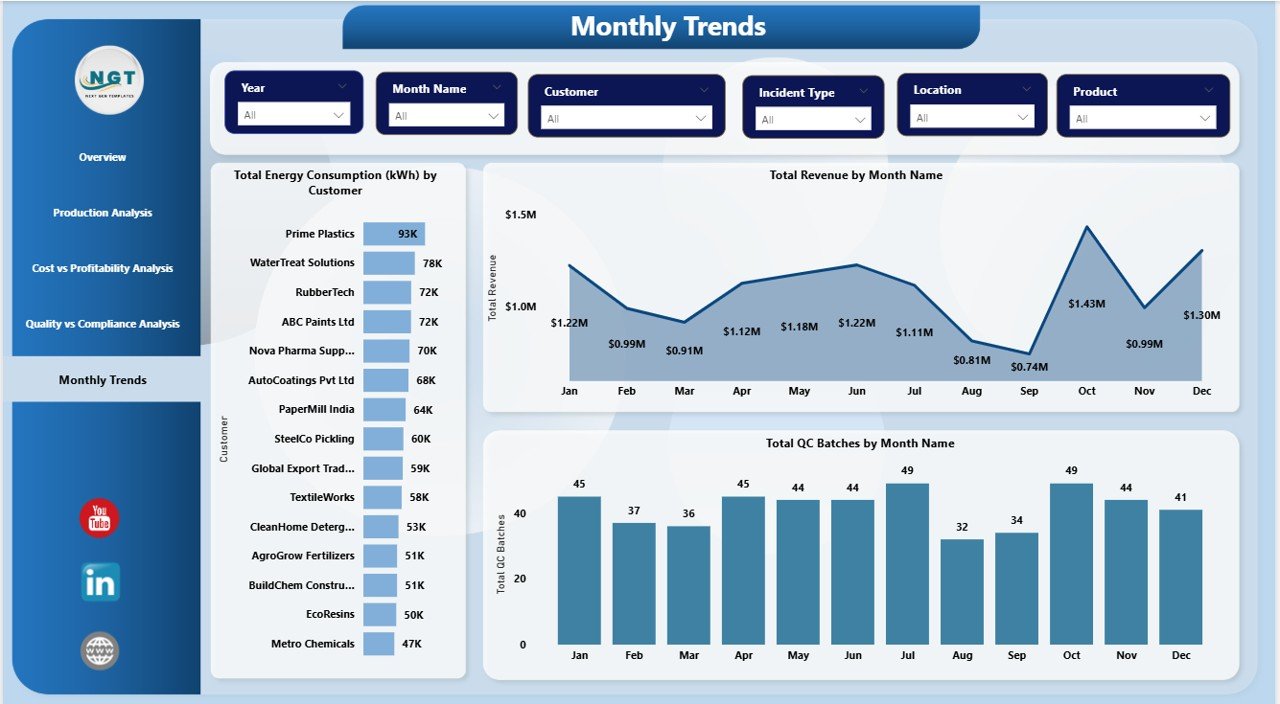
📌 Monthly Trends Page
Month-wise analysis of energy consumption, revenue vs gross margin, and QC batch trends.
📌 Power BI (.pbix) File
Fully interactive, professionally formatted, and easy to customize for your organization.
🛠️ How to Use the Chemical Manufacturing Dashboard in Power BI
1️⃣ Connect your manufacturing data (Excel, ERP, MES, or database).
2️⃣ Refresh the dataset in Power BI.
3️⃣ Use slicers to filter by plant, product, process, or time period.
4️⃣ Drill down into KPIs to identify inefficiencies and risks.
5️⃣ Share insights with stakeholders using Power BI Service.
No advanced Power BI knowledge is required—this dashboard is ready to use.
👥 Who Can Benefit from This Chemical Manufacturing Dashboard in Power BI
🏭 Plant Managers – Improve operational efficiency and reduce downtime
📊 Production Managers – Optimize yield and process performance
🧪 Quality Assurance Teams – Monitor defects and compliance trends
⚠️ Safety Officers – Track incidents and risk patterns
💼 Finance Teams – Analyze cost drivers and profitability
🌱 Sustainability Teams – Monitor energy and emissions data
👔 Executives & Leadership – Make faster, data-driven decisions
Click here to read the Detailed blog post
Watch the step-by-step video tutorial:


Reviews
There are no reviews yet.