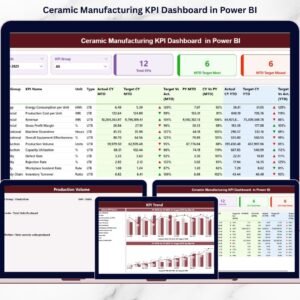
Ceramic manufacturing runs on precision. Production must meet demand. Kilns must operate efficiently. Quality must remain consistent. Costs must stay under control. Ceramic Manufacturing KPI Dashboard in Power BI And management must compare performance against targets and previous year numbers regularly.
Yet many ceramic factories still rely on static Excel reports. Managers struggle to see real-time performance. Trend analysis becomes difficult. Weak KPIs remain hidden until problems grow.
Ceramic Manufacturing KPI Dashboard in Power BI If you want complete visibility into production, cost, quality, and financial performance — you need a smarter system.
Introducing the Ceramic Manufacturing KPI Dashboard in Power BI — a powerful, interactive business intelligence solution designed specifically for ceramic production companies.
Ceramic Manufacturing KPI Dashboard in Power BI This ready-to-use Power BI dashboard transforms Excel data into dynamic reports, KPI indicators, trend charts, and drill-through insights.
Stop reacting to problems. Start managing performance proactively. 📊🏭
🚀 Key Feature of Ceramic Manufacturing KPI Dashboard in Power BI
This dashboard is built for plant managers, finance teams, and operations leaders who demand clarity and control.
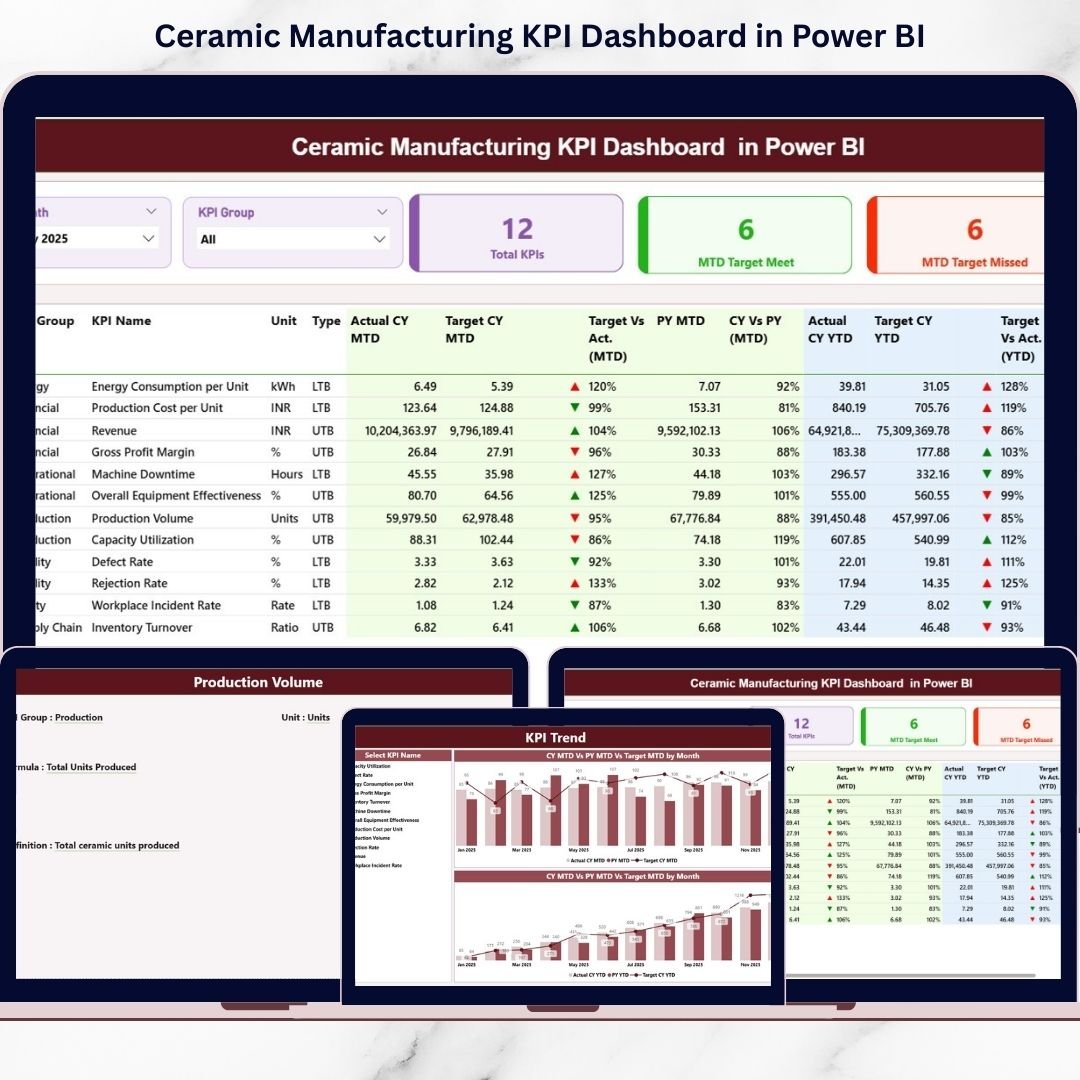
📊 Interactive Summary Dashboard
Monitor all KPIs in one powerful overview page.
🎛️ Dynamic Slicers (Month & KPI Group)
Filter performance instantly by selected month or department.
📈 MTD & YTD Performance Tracking
Analyze Month-to-Date and Year-to-Date KPIs together.
🎯 Actual vs Target Comparison
Identify performance gaps immediately using percentage comparisons.
📅 Current Year vs Previous Year Analysis
Measure growth and operational improvements clearly.
🚦 Performance Icons (▲ / ▼)
Visual indicators show whether KPIs meet or miss targets instantly.
📉 KPI Trend Combo Charts
Analyze Current Year, Previous Year, and Target values visually.
🔎 Drill-Through KPI Definition Page
Click any KPI to view its formula, definition, group, and type.
This is not just a report — it’s a manufacturing intelligence system.
📦 What’s Inside the Ceramic Manufacturing KPI Dashboard in Power BI
This Power BI file includes 3 interactive pages:
📊 1️⃣ Summary Page – Central Performance Overview
The Summary page acts as the main dashboard.
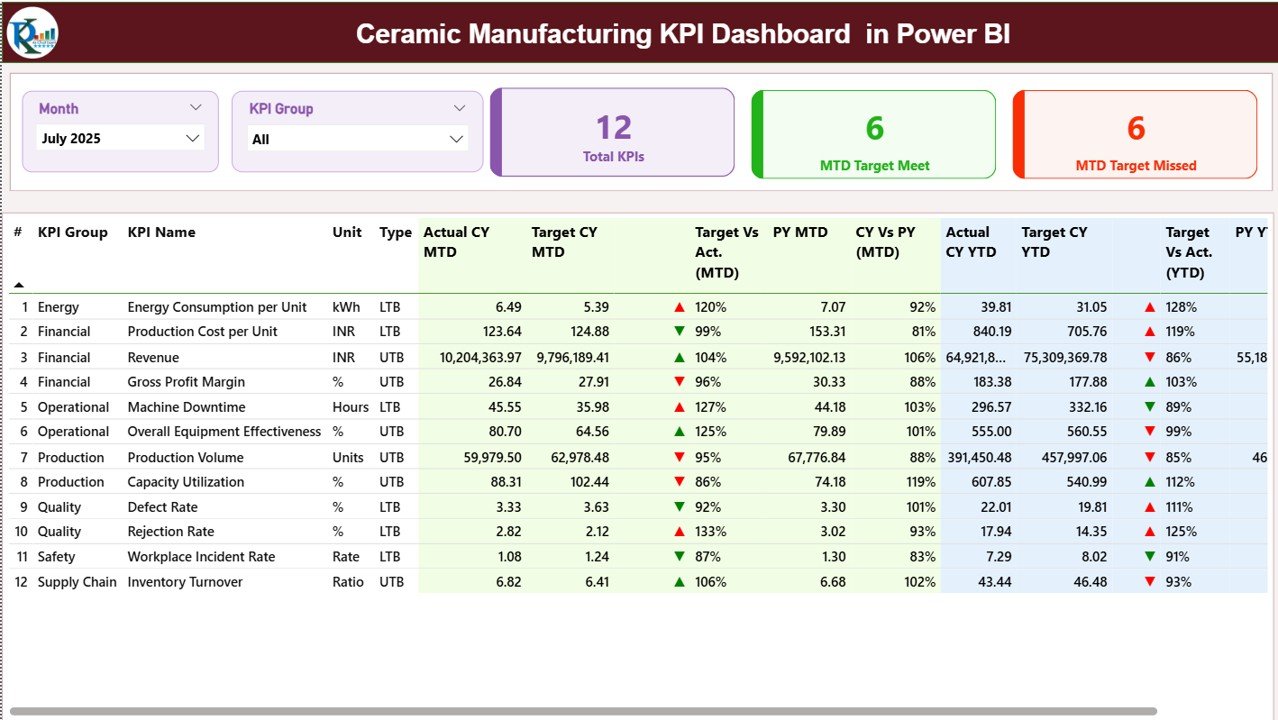
At the top, you get:
-
Month slicer
-
KPI Group slicer
KPI Cards display:
-
Total KPI Count
-
MTD Target Meet Count
-
MTD Target Missed Count
Below that, a detailed KPI table shows:
-
KPI Number
-
KPI Group
-
KPI Name
-
Unit
-
Type (LTB / UTB)
-
Actual CY MTD
-
Target CY MTD
-
Target vs Actual %
-
PY MTD
-
CY vs PY %
-
YTD comparisons with icons
Everything updates dynamically based on slicer selection.
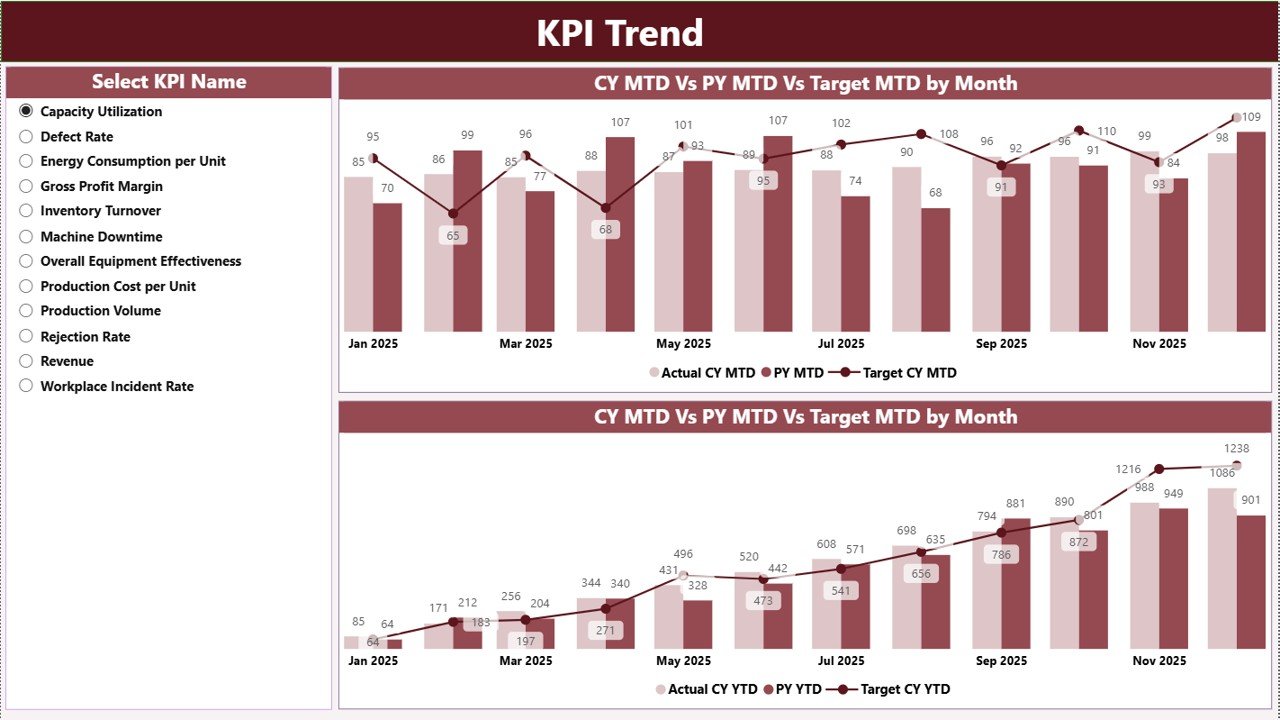
📈 2️⃣ KPI Trend Page – Performance Over Time
Select a KPI from the left-side slicer.
View two combo charts:
-
MTD Trend Chart
-
YTD Trend Chart
Each chart compares:
-
Current Year Actual
-
Previous Year Actual
-
Target Values
Spot seasonal patterns, cost spikes, rejection rate trends, and production fluctuations instantly.
📘 3️⃣ KPI Definition Page – Drill-Through Insights
This hidden page allows you to drill through from the Summary page.
View:
-
KPI Formula
-
KPI Definition
-
KPI Group
-
Unit
-
KPI Type
A back button returns you to the main dashboard.
Clarity without clutter.
⚙️ How to Use the Ceramic Manufacturing KPI Dashboard in Power BI
This dashboard uses structured Excel sheets as the data source.
You only need to maintain three sheets:
📂 Input Actual Sheet
Enter KPI Name, Month, MTD Actual, and YTD Actual values.
📂 Input Target Sheet
Enter KPI Name, Month, MTD Target, and YTD Target.
📂 KPI Definition Sheet
Define KPI Number, Group, Name, Unit, Formula, and Type.
After updating Excel, simply refresh Power BI — and the dashboard updates automatically.
No complex modeling required.
🏭 Who Can Benefit from This Ceramic Manufacturing KPI Dashboard in Power BI
This dashboard is perfect for:
🏭 Ceramic Tile Manufacturers
🏺 Sanitary Ware Factories
🏢 Ceramic Product Companies
📊 Plant Managers
💼 Finance Managers
🛠️ Operations Heads
📈 Business Owners
Whether you manage one production line or multiple manufacturing units, this dashboard scales with your needs.
Ceramic manufacturing performance cannot rely on static reports. It requires interactive analysis.
When you use this Power BI dashboard consistently, you:
✔ Detect production inefficiencies early
✔ Reduce rejection and defect rates
✔ Control fuel and raw material costs
✔ Improve machine utilization
✔ Strengthen financial transparency
✔ Increase profit margins
Instead of waiting for monthly summaries, you gain instant insight.
If you want smarter reporting, stronger cost control, and data-driven decision-making, this Ceramic Manufacturing KPI Dashboard in Power BI is your ultimate solution.
Click hare to read the Detailed blog post
Visit our YouTube channel to learn step-by-step video tutorials
👉 https://www.youtube.com/@PKAnExcelExpert