The cement manufacturing industry operates in a fast-moving and performance-focused environment where every decision directly impacts productivity, operational costs, and profitability. Plant managers and business leaders must continuously monitor production output, plant efficiency, logistics performance, sales results, and quality standards. However, many organizations still depend on disconnected spreadsheets and manual reporting systems, making performance tracking slow and inefficient.
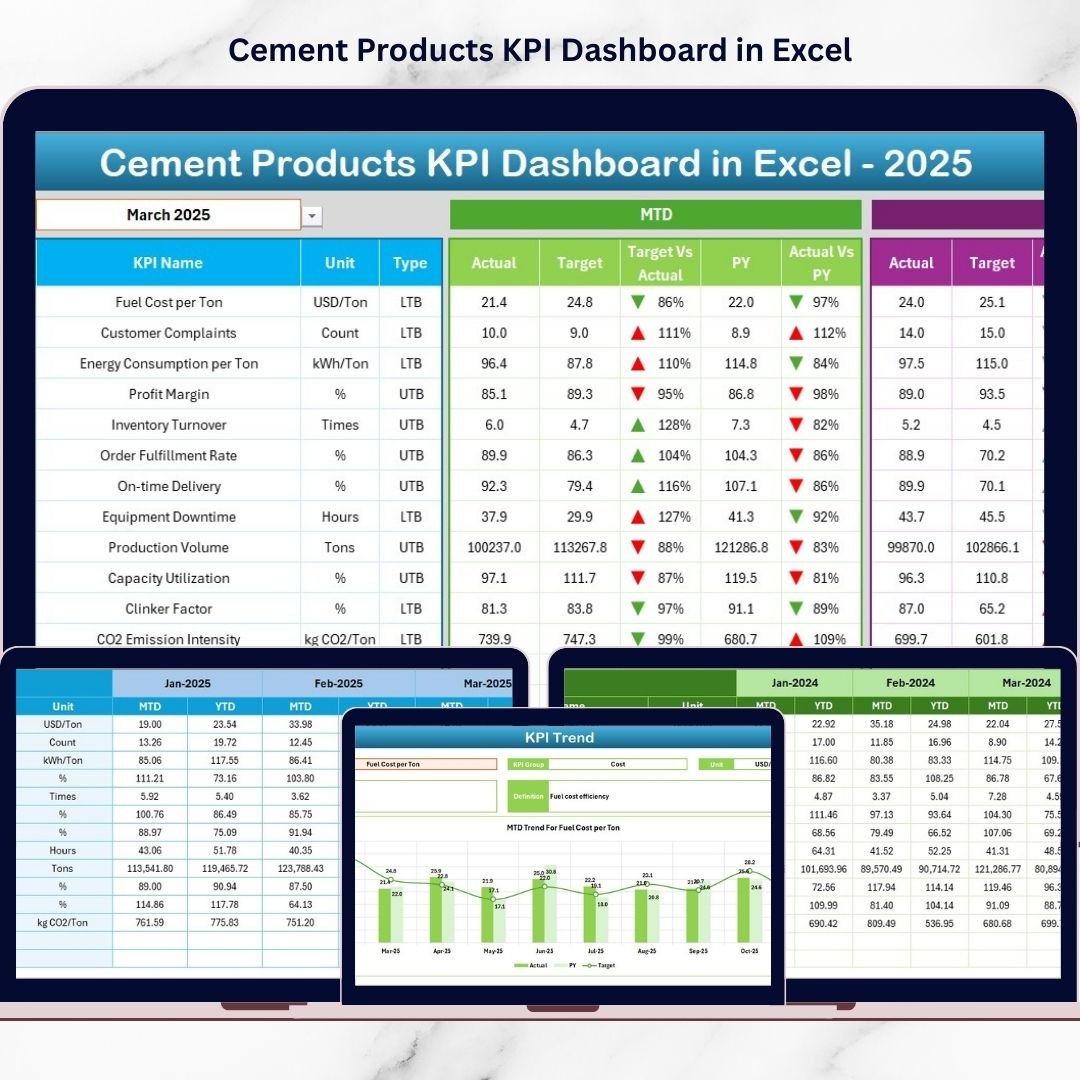
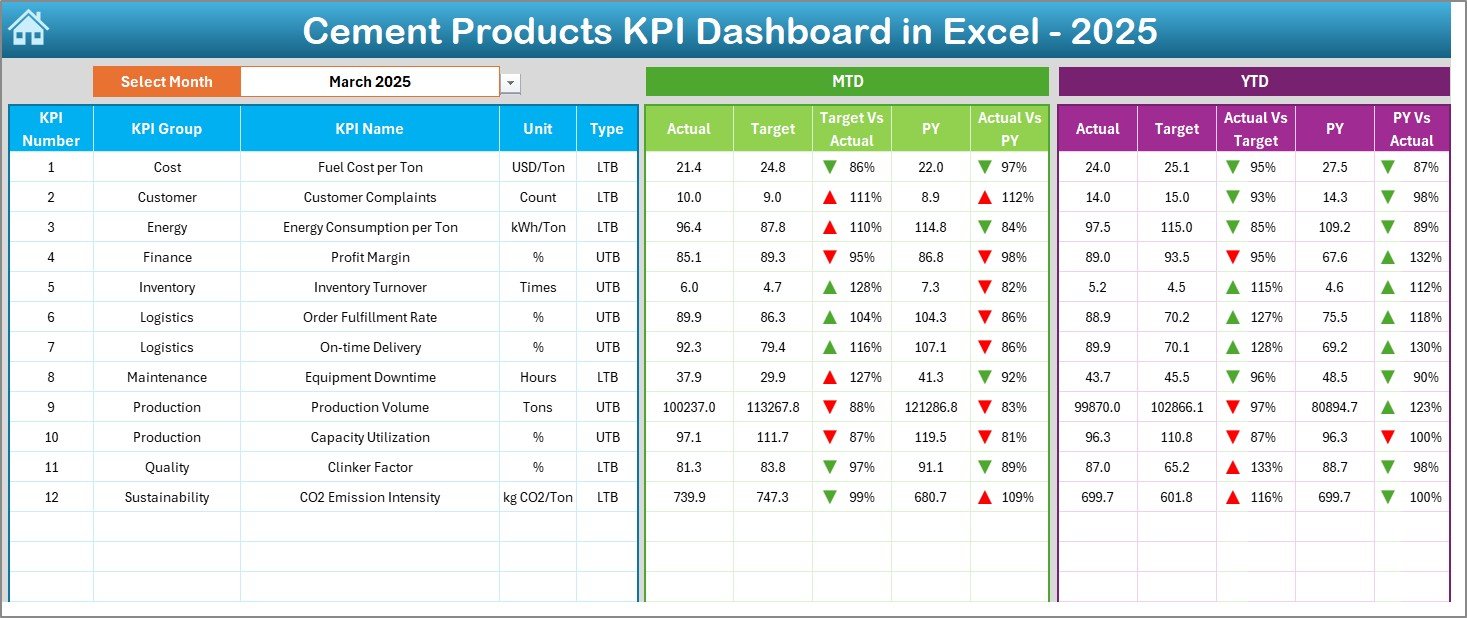
The Cement Products KPI Dashboard in Excel is a powerful, ready-to-use performance monitoring solution designed to transform complex operational data into clear, actionable insights. Built entirely in Microsoft Excel, this interactive dashboard allows cement companies to track key performance indicators (KPIs), compare results against targets, and analyze trends — all from a single centralized system.
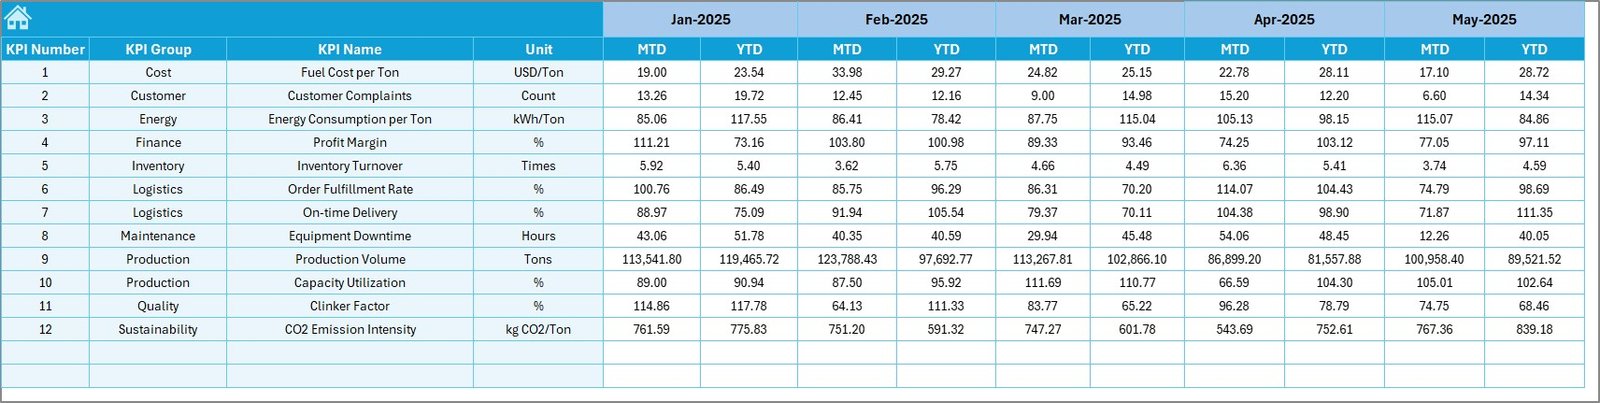
Instead of reviewing multiple reports separately, decision-makers can instantly evaluate operational performance through automated calculations, visual indicators, and dynamic dashboards. The system combines Month-to-Date (MTD) and Year-to-Date (YTD) analysis with previous year comparisons, helping organizations identify improvement opportunities quickly. 📊🏭
Designed for simplicity and efficiency, the dashboard requires no advanced technical skills. Users simply update performance data, and the dashboard automatically refreshes charts, KPIs, and performance indicators. This enables faster analysis, better planning, and smarter decision-making.
Whether you manage plant operations, production planning, finance analysis, or executive reporting, this Excel dashboard helps your organization gain visibility, improve accountability, and drive continuous performance improvement.
## Key Features of Cement Products KPI Dashboard in Excel
📊 Interactive KPI Dashboard – Monitor production, sales, cost, and operational KPIs in one unified interface.
📅 Dynamic Month Selection – Select reporting month and update the entire dashboard instantly.
🎯 Actual vs Target Comparison – Identify performance gaps using automated variance analysis.
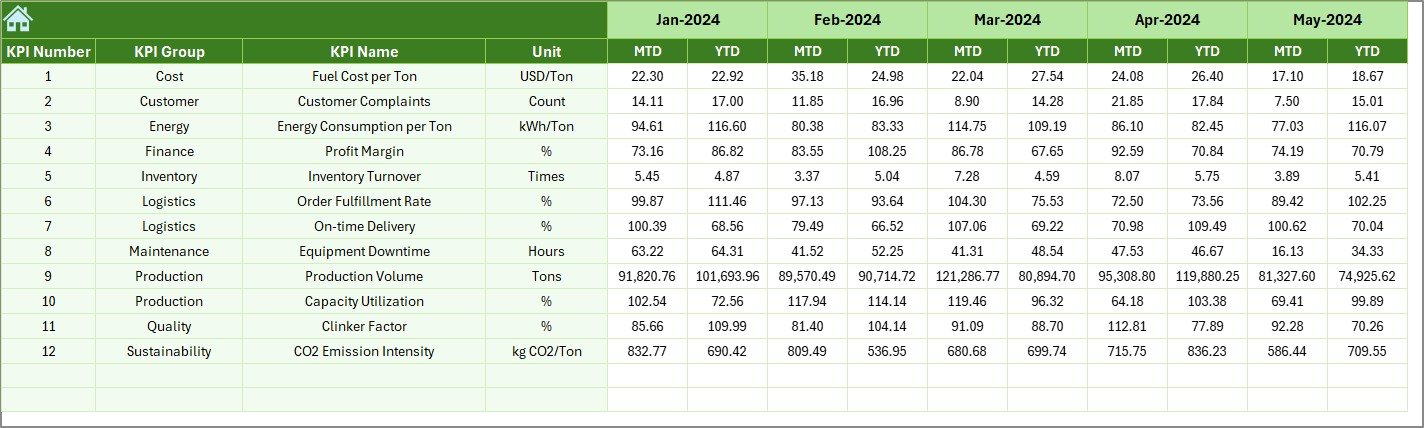
📈 Previous Year Benchmarking – Compare current results with historical performance.
🔺 Visual Trend Indicators – Up and down arrows instantly show improvement or decline.
⚡ Automated Calculations – Reduce manual reporting effort and improve accuracy.
📂 Structured Data Management – Organized sheets for actual data, targets, and historical numbers.
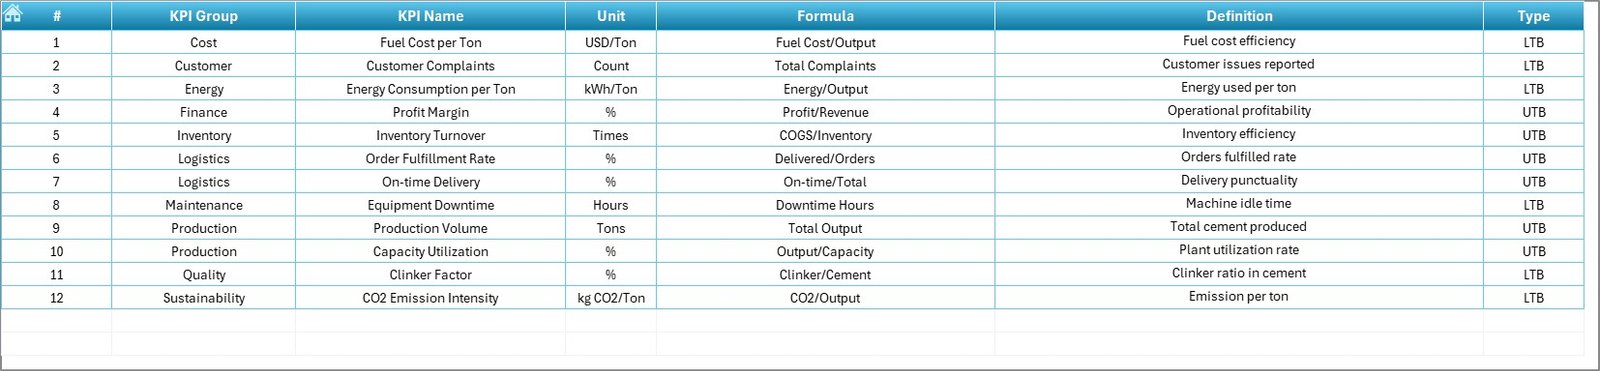
📘 Central KPI Definition Library – Maintain standardized KPI formulas and definitions.
These features convert Excel into a professional manufacturing performance analytics tool.
## What’s Inside the Cement Products KPI Dashboard in Excel
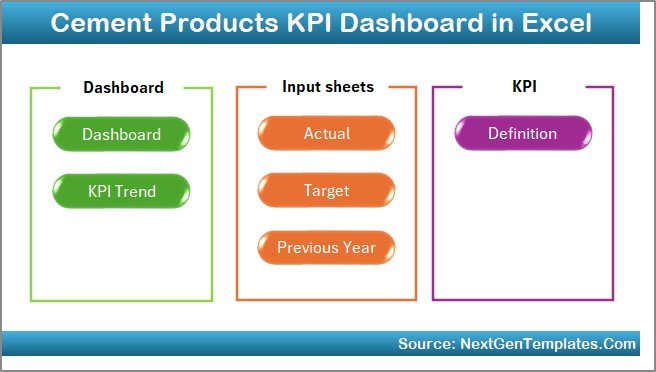
This ready-to-use template includes seven professionally structured worksheets:
✅ Home Sheet – Navigation panel for quick access to all reports.
✅ Dashboard Sheet – Main KPI overview with MTD and YTD analysis.
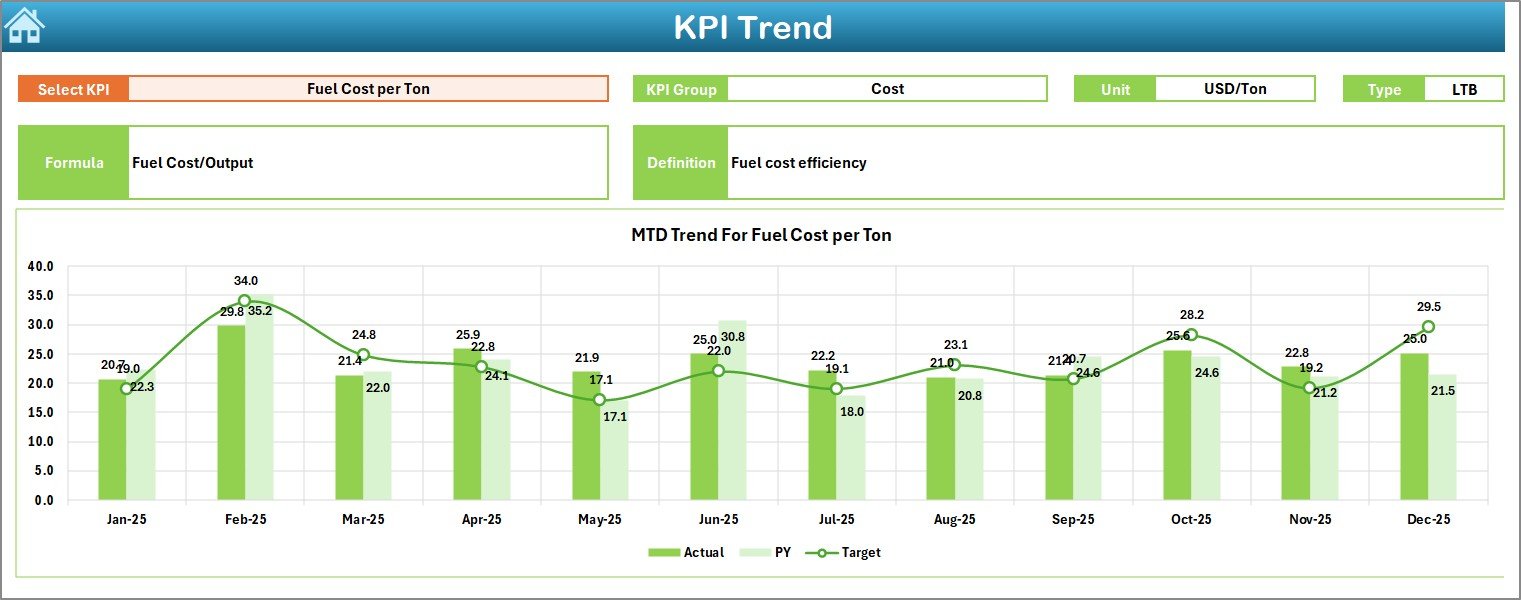
✅ KPI Trend Sheet – Detailed trend charts and KPI analysis.
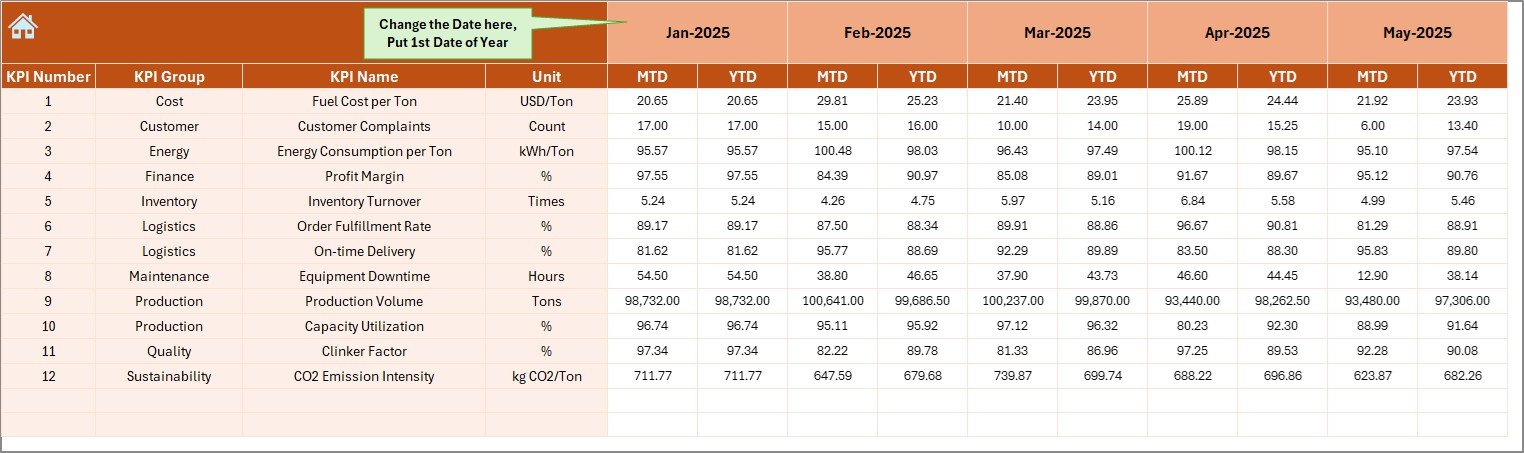
✅ Actual Numbers Input Sheet – Current year performance data entry.
✅ Target Sheet – Planned KPI targets for comparison.
✅ Previous Year Numbers Sheet – Historical benchmarking data.
✅ KPI Definition Sheet – Central documentation of KPI details.
Together, these sheets create a complete cement performance monitoring environment.
## How to Use the Cement Products KPI Dashboard in Excel
Using the dashboard is simple and efficient:
1️⃣ Define KPIs in the KPI Definition Sheet.
2️⃣ Enter monthly targets in the Target Sheet.
3️⃣ Add previous year data for benchmarking.
4️⃣ Input actual performance values regularly.
5️⃣ Select the reporting month from the dashboard.
6️⃣ Analyze performance trends and take action.
Within minutes, organizations can start tracking performance professionally without complex setup.
## Who Can Benefit from This Cement Products KPI Dashboard in Excel
This dashboard is ideal for:
🏭 Plant managers and production supervisors
📊 Operations and performance analysts
💰 Finance and cost management teams
🚚 Supply chain and logistics managers
📈 Business executives and decision-makers
🏢 Cement manufacturing companies of all sizes
From operational monitoring to strategic planning, this dashboard supports every level of management.
A structured KPI monitoring system transforms manufacturing operations. By centralizing performance data and automating analysis, the Cement Products KPI Dashboard in Excel enables organizations to move from reactive reporting to proactive decision-making.
Instead of spending hours preparing reports, teams gain instant visibility into performance trends and operational efficiency. The result is improved productivity, reduced costs, and stronger business performance. ✅
### Click here to read the Detailed blog post
Visit our YouTube channel to learn step-by-step video tutorials:
👉 YouTube.com/@PKAnExcelExpert